Original Title: The State of Onchain Yield: From Stablecoins to DeFi and Beyond
Original Author: Christopher Rosa
Original Translation: Peggy, BlockBeats
Editor's Note: This report systematically dissects the five major sources of on-chain yield: interest rate transmission of tokenized cash, staking and re-staking rewards, lending spreads, AMM fees, and structured designs. Currently, various on-chain yield tools are flourishing in the market, from stablecoin wrappers to re-staking/LRTs and structured vaults, with the focus of discussions primarily on annualized figures. The report provides us with a deeper perspective: what risks lie behind high yields? In fact, APY does not equal real returns; the key is how much remains after accounting for risk and complexity discounts.
In today's market, there are increasingly attractive yield projects. As the number of yield tools surges, the gap between explosiveness and sustainability is widening. Understanding the balance of yield, risk, and operational complexity is key to identifying long-term value. Investors should always ask themselves two questions: How much risk am I taking on? After operational costs, how much do I truly net?
The following is the full content:
One of the most striking innovations in DeFi is on-chain yield, which generates income through blockchain financial activities without relying on traditional intermediaries. Initially, DeFi yields primarily came from simple mechanisms like lending and liquidity provision. Today, this ecosystem has evolved into a strategically diverse and structurally complex field, encompassing a wide range of risk types, economic models, and asset classes.
This article proposes a framework to understand and compare various yield generation methods within the DeFi ecosystem. We categorize and analyze based on dimensions such as yield volatility, underlying asset types, yield generation mechanisms, and associated risks.
First, we focus on non-yielding stablecoins.
These assets are pegged to the dollar and do not pay interest; their design aims for stability and quick settlement rather than generating income for holders. When held on self-custody or non-reward platforms, these assets do not generate any yield. Some platforms may advertise rewards for custodial balances, but we do not account for these. Our focus is on whether the issuer directly or through platform partners pays cash yields to holders. Starting from zero yield, we will gradually explore various tools and strategies for capturing yield, with increasing complexity and risk.
Next, we discuss platform-dependent yield-bearing stablecoins.
These tokens do not pay native interest themselves; yields are only passed to users' custodial accounts when the platform and issuer reach a yield distribution arrangement. Yields apply only to assets held on that platform; if self-custodied or if the platform is not involved in such arrangements, the yield remains zero. We categorize these assets separately to avoid confusing the issuer's and platform's yield distribution mechanisms with platform promotions or loyalty programs. In contrast, there are decentralized non-yielding stablecoins, where holders must actively participate in staking protocols like sDAI to earn yields.
Subsequently, the article delves into debt-based strategies, which represent the first tier where yields are designed to be distributed to holders. Some staking stablecoins allocate a portion of fixed yields to token holders rather than retaining all in the issuer's reserves. Centralized fiat-collateralized wrapped assets hold short-term government securities and automatically pass fund yields.
Next, the article analyzes protocol-level yield mechanisms, which generate yields through on-chain operations rather than issuer reserves. This category includes native staking, re-staking, and liquid staking mechanisms of proof-of-stake (PoS) assets, as well as lending markets. In these markets, interest rates fluctuate with capital utilization and credit demand, typically exceeding risk-free yield levels.
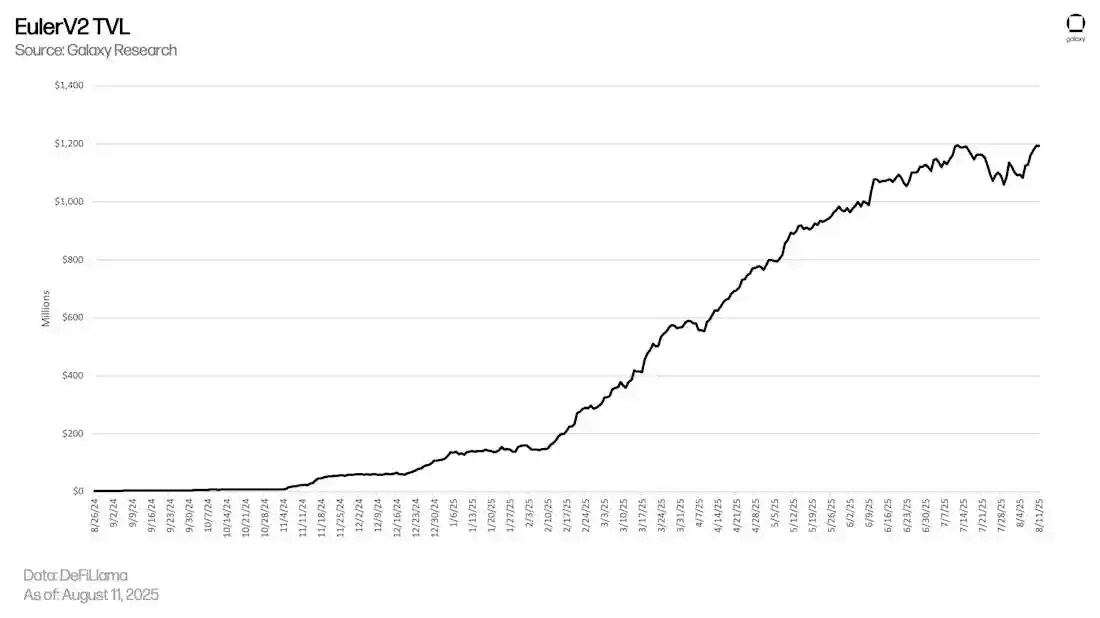
After discussing protocols, we explore structured and actively managed yield strategies. These strategies are actively operated or designed by teams or protocols, including projects like Pendle V2, Boros, and Euler V2, which achieve yields through cash flow combinations, setting terms, or applying leverage.
The final layer consists of yields driven by market activities themselves, including fees earned from providing liquidity as automated market makers (AMMs), incentive programs, and yield farming.
Finally, the article introduces a stablecoin risk framework and expands the perspective to examine the entire ecosystem from the dimensions of yield versus risk and yield versus complexity. We arrange various assets from cash-like stability to more engineered yield structures, helping readers weigh the risks and operational costs associated with each additional percentage point of yield.
Non-Yielding Stablecoins: Centralized Issuance
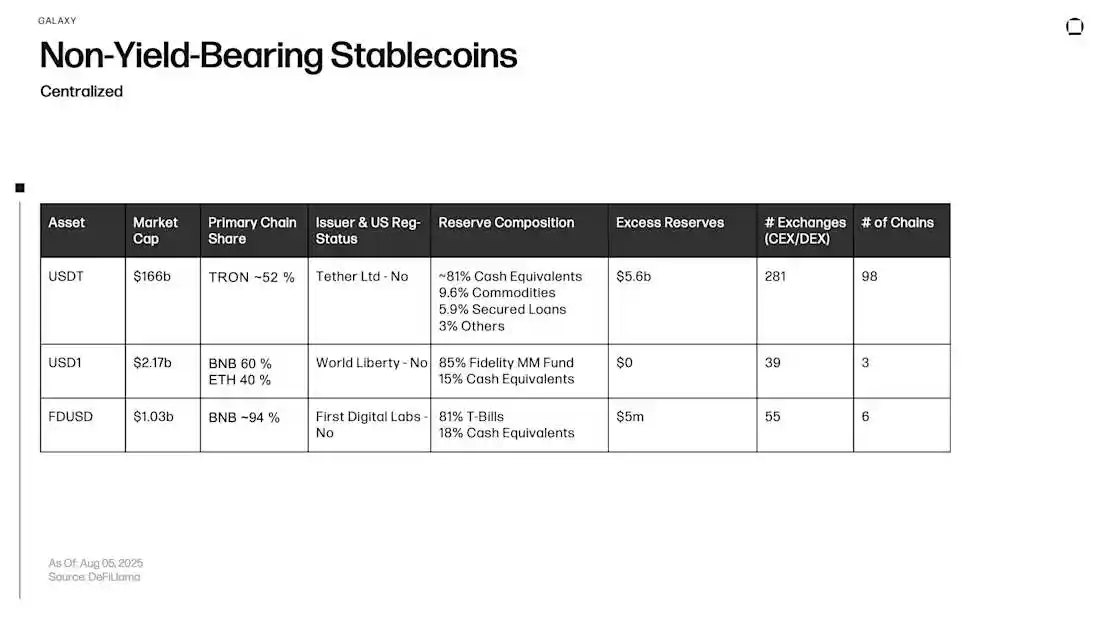
Stablecoins serve as the primary liquidity medium between exchanges, wallets, and protocols. Non-yielding stablecoins are typically pegged to the dollar, with their settlement function supported by high-quality, liquid reserve assets such as short-term government bonds, overnight repurchase agreements, cash held by regulated custodians, or government money market funds.
In this article, we classify USDT, FDUSD, and USD1 as non-yielding stablecoins because these issuers do not pay native interest to holders. While some platforms may advertise returns on these assets, such yields stem from the platform's own lending or promotional activities and are not directly paid by the issuer, thus falling outside the scope of this discussion.
As the largest stablecoin by market capitalization, USDT plays a pegging role in exchange order books and on-chain paths. Its issuer, Tether, discloses that reserves are concentrated in cash equivalents and other short-term assets, with "excess reserves" set aside as a capital buffer to support pegging stability and redemption mechanisms. USDT does not distribute reserve yields to holders; the returns advertised by exchanges come from the platform's own incentive programs, not from the issuer's yield distribution.
FDUSD, issued by First Digital, adopts a fiat-backed model, with reserves including government bonds and cash, primarily distributed to large centralized platforms. This token does not pay native interest, and the annual percentage rate (APR) displayed on the platform falls under the category of platform incentives, not within the issuer's yield definition.
USD1 is a newer fiat-backed stablecoin, with reserves including cash equivalents and some government money market funds. Current growth relies mainly on exchange distribution and incentive programs from the issuer or platform. Since it does not pay native interest to holders, we classify it as a non-yielding stablecoin; promotional rewards do not alter this classification.
Leaving yields to the issuer keeps these tokens simple. The redemption mechanism is designed for par settlement (1 token ≈ 1 dollar), allowing assets to be used instantly across multiple platforms, while the issuer can maintain deep liquidity and control transfer costs.
However, for holders, the opportunity cost cannot be ignored. For instance, Tether's government bond holdings, if calculated at the average yield of short-term government bonds, would have generated approximately $12.6 billion in interest income over the past three years. Ultimately, this results in a stable, highly liquid settlement layer designed more for accessibility and simplicity than for paying yields to holders.
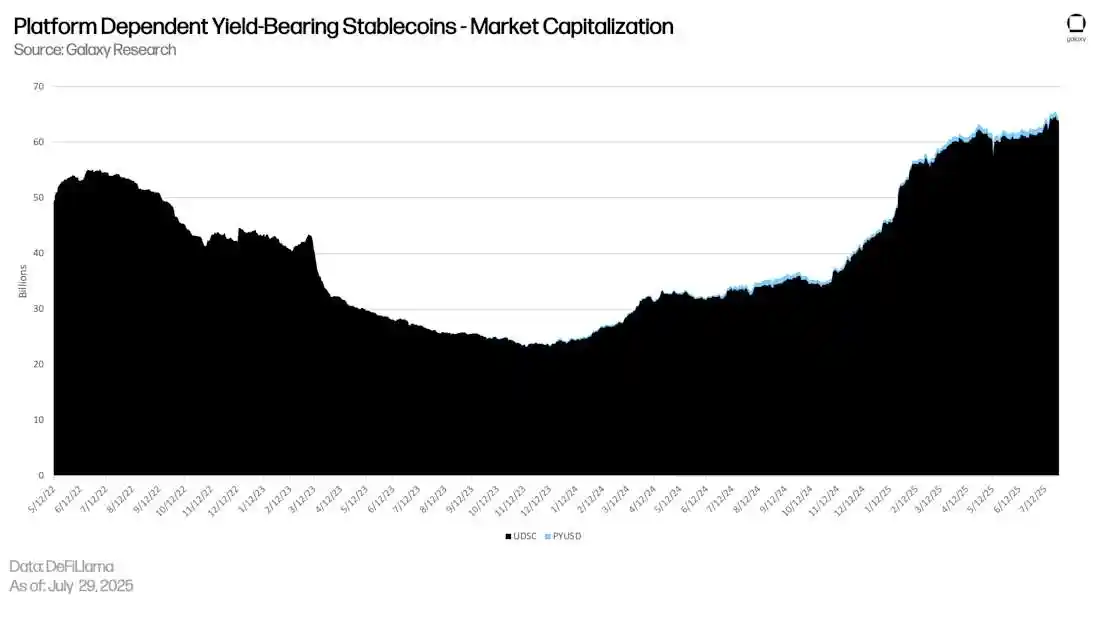
Platform-Dependent Yield-Bearing Stablecoins
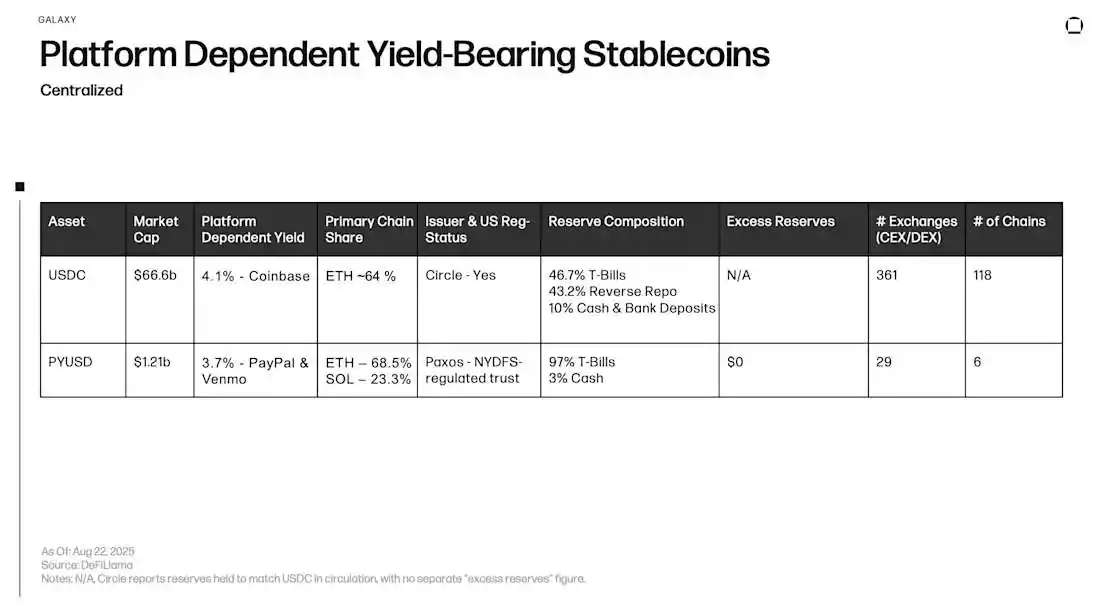
USDC and PYUSD are both fiat-backed, dollar-pegged stablecoins, with reserves composed of high-quality liquid assets. A portion of USDC's reserves is held at reserve banks, while the remainder is invested in short-term government bonds and reverse repurchase agreements through government money market funds. PYUSD is issued by Paxos Trust Company and regulated by the New York State Department of Financial Services, with reserves including short-term government bonds and cash.
Where do the yields come from?
Neither of these tokens pays native interest themselves. When held on self-custody or platforms not participating in reward programs, users do not earn any yield. The issuer of USDC, Circle, has established a business partnership with Coinbase to distribute a portion of reserve yields to Coinbase, which then pays USDC rewards to users. For PYUSD, PayPal and Venmo may pay balance rewards to users within their applications through collaboration with Paxos.
These reward programs have a degree of autonomy, often with caps or tiered structures, and apply only to balances held on specific platforms. The GENIUS Act, signed by President Trump in July 2025, may restrict such indirect interest transmission, with specific impacts depending on how regulators draft implementation rules. If regulation tightens, platforms may shift from cash yields to points or cashback forms.
Since each platform holds only a small portion of the circulating supply, most reserve yields still belong to the issuer. This explains why platforms can advertise attractive yield rates while issuers still maintain substantial profits.
Key Points
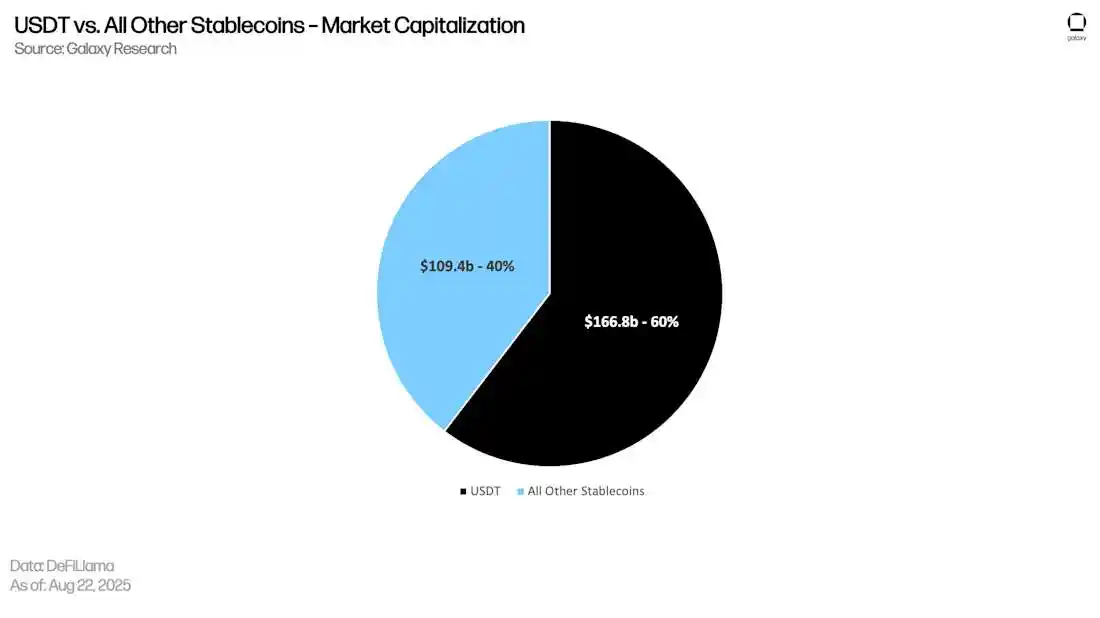
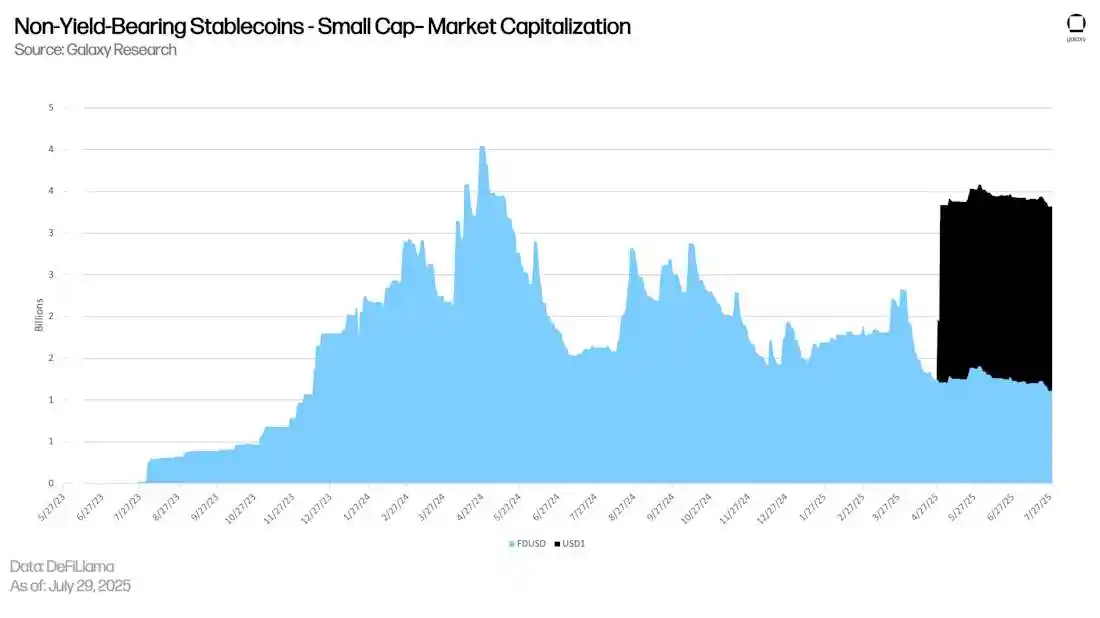
Smaller stablecoins compete for market share: USDT and USDC dominate the stablecoin supply, while smaller emerging projects (like FDUSD, USD1, PYUSD) compete in the remaining market. Regardless of the platform, USDT does not pay any yield; USDC only shares a portion of yields for custodial balances on the Coinbase platform, which constitutes only a small fraction of total supply. Therefore, most holders of USDT and USDC still do not receive any yield, while issuers retain most of the interest income from government bonds. Although PYUSD, USD1, and FDUSD have gained some attention as new stablecoins, their combined supply still accounts for only a small portion of the non-yielding stablecoin market, with the market landscape still firmly controlled by long-term leaders.
Overlooked interest income: The zero-yield structure of USDC and USDT means retail holders miss out on substantial potential interest. Against a backdrop of short-term government bond yields exceeding 4%, the opportunity cost of idle stablecoins has accumulated to hundreds of billions of dollars over just a few years, highlighting the scale of this structural issue.
Funds that remain in "cash-only" stablecoins are essentially just changes in on-chain custody. This paves the way for the next phase of decentralized assets, such as non-yielding stablecoins like USDS, DAI, USDf, and USDe, which are fully minted and burned on-chain. These tokens maintain the broad availability of USDT and USDC while relying on transparent collateral asset pools or real-time hedging mechanisms, rather than centralized treasury assets. Before further exploring their yield-enhanced versions (such as yield achieved through staking wrappers), it is crucial to understand how these foundational layers ensure the value of one dollar without paying interest.
Non-Yielding Stablecoins: Decentralized Issuance
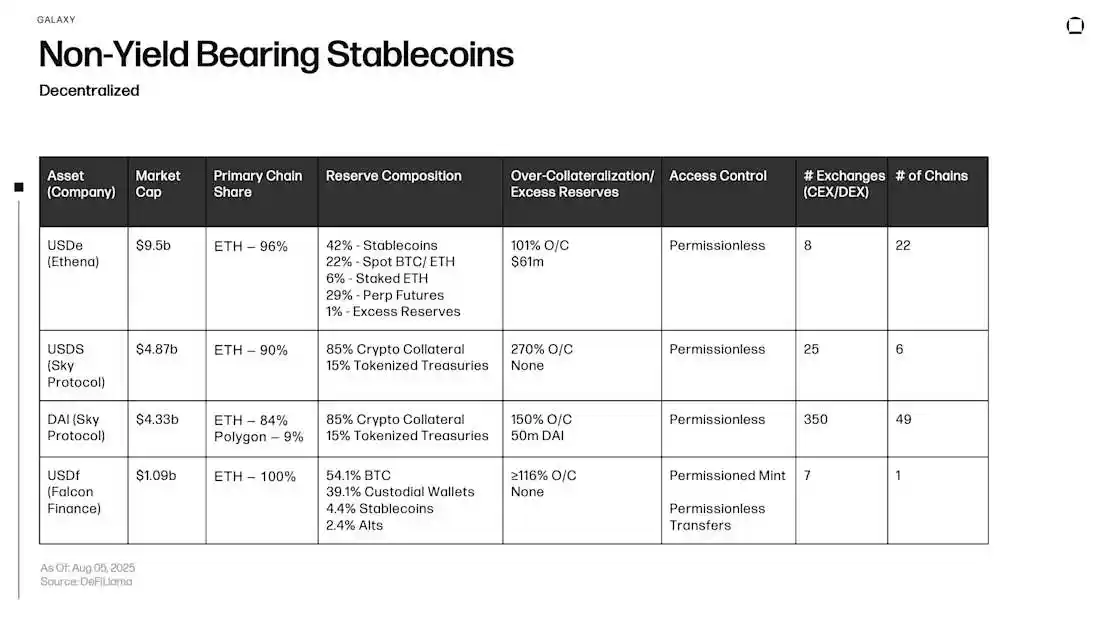
Similar to centralized non-yielding stablecoins, decentralized stablecoins do not pay interest to holders, but their methods of maintaining the peg differ. These tokens do not rely on traditional assets like cash or government bonds; instead, they achieve a one-dollar peg through on-chain mechanisms such as over-collateralization, synthetic hedging, and internal surplus mechanisms.
USDe is a "Delta-neutral" synthetic dollar stablecoin. Whenever the system receives one dollar's worth of spot collateral assets (such as ETH, stETH, or BTC), it opens a corresponding short position in perpetual contracts on a designated platform to hedge the spot yield against contract losses. The system also retains a small reserve of stablecoins (about 1%, measured in USDC/USDT) for redemptions and additional margin, and holds a small amount of ETH as collateral for the ETH-M (contract priced in ETH) short position. This pegging mechanism relies on continuous hedging operations and liquidity buffers. The original USDe does not pay any yield; only after being staked as sUSDe can it earn perpetual contract funding fees and staking rewards when using liquid staking tokens (LST) as collateral.
USDS and DAI are over-collateralized stablecoins minted through on-chain vaults. Borrowers must deposit assets (such as ETH, stETH, WBTC, or approved on-chain RWA assets) and can mint USDS or DAI up to a limit assessed based on risk, with typical collateralization rates ranging from about 115% to 175%, depending on the asset type. If the collateral vault falls below the liquidation threshold, the protocol will auction off the collateral assets to repay the debt. Borrowers must pay a floating stability fee and incur penalties upon liquidation; these revenues belong to the protocol's surplus pool or treasury, used for system guarantees or token buybacks, rather than being distributed to regular holders. Simply holding USDS or DAI does not yield any returns; only by participating in savings modules (such as DAI → sDAI, USDS → sUSDS) can returns be earned.
USDf is a stablecoin minted based on an on-chain collateral asset pool, requiring a minimum collateralization rate of 116%. Acceptable collateral assets include stablecoins, BTC, ETH, and some mainstream tokens. The protocol does not set up an independent reserve fund; the additional 16% of collateral assets serves as a redemption buffer and liquidation guarantee. Simply holding USDf does not yield returns; it must be staked in designated savings modules to earn rewards.
Overall, these designs indicate that decentralization itself does not imply that stablecoins will generate yields; it merely shifts the pegging mechanism from fiat reserves to on-chain engineering. Whether depositing collateral assets into over-collateralized vaults or deploying them in Delta-neutral hedging structures, the yields generated belong to the protocol, not the end users. This undistributed yield also brings about incentive mechanisms similar to centralized stablecoins: once the underlying stablecoins gain market recognition in terms of stability and liquidity, the market quickly spawns "staking wrapper" versions that pass the underlying cash flows to holders.
The next section will explore these yield-bearing derivative versions, which represent the first step in transforming idle stablecoins into on-chain productive assets.
Key Points
Diverse designs, common results: Despite differing structures, the four decentralized non-yielding stablecoins all achieve a one-dollar peg, but the mechanisms employed vary significantly: USDS relies on a high ratio of over-collateralization (about 270%); DAI and USDf provide moderate buffers (approximately 150% and ≥116%, respectively); USDe maintains stability through Delta-neutral hedging plus a 1% reserve. While they belong to the same category, their risk characteristics are not the same.
Adoption differentiation: Among decentralized non-yielding stablecoins, USDe has become the most rapidly growing project, currently leading in market capitalization and deployed across 22 chains, demonstrating the potential of new collateral designs in reshaping market share. In contrast, DAI and USDS are in the middle tier, while USDf remains a niche product.
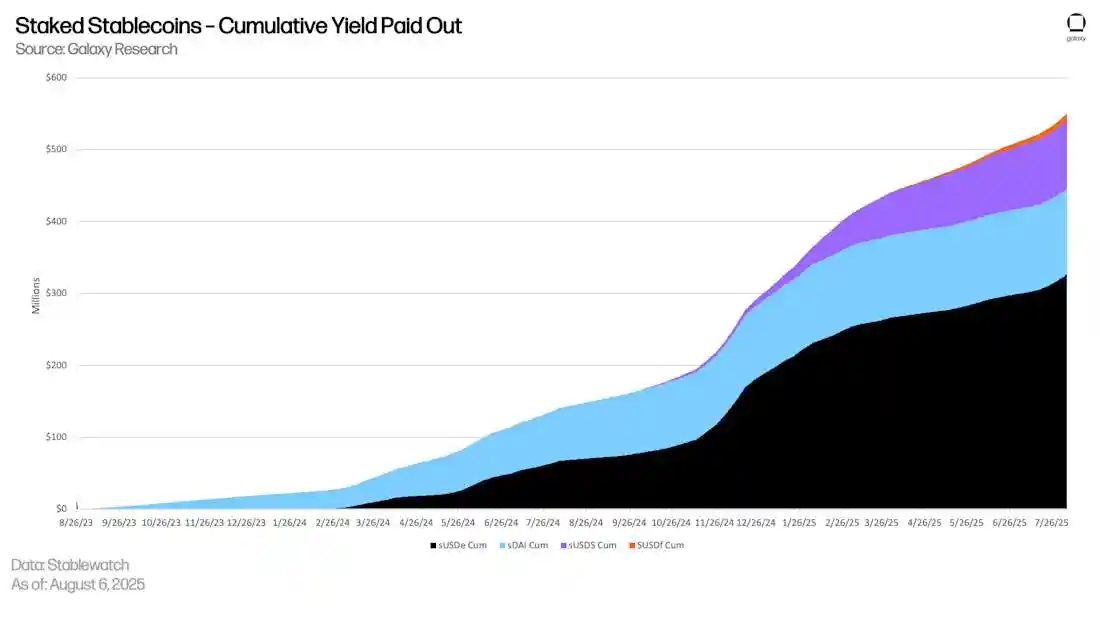
Opportunity costs still exist: Despite differing structures, these tokens still direct most reserve or strategic yields to the protocol treasury rather than to holders, highlighting a yield gap of billions of dollars. It is this gap that has spurred the "staking wrapper" products discussed in the next section, aimed at redistributing these yields back to users.
Issuer policies determine yield distribution: The yield rates of sDAI and sUSDS fluctuate, typically linked to stability fees. However, Sky is actively promoting user migration to sUSDS, offering better parameters and incentives, so the yield differences between sUSDS and sDAI reflect not only market conditions but also the issuer's strategic choices.
The total market capitalization of leading decentralized non-yielding stablecoins far exceeds that of small centralized stablecoins: The total market capitalization of top decentralized non-yielding stablecoins approaches $20 billion, while that of small centralized stablecoins is only about $4 billion, forming a stark contrast.
After establishing a zero-yield baseline, we will shift our focus to yield-bearing wrapper products, such as sUSDS, sDAI, sUSDf, and sUSDe. These transform originally static stablecoins into automatically compounding on-chain assets. The gap between the "zero return" provided by centralized and decentralized non-yielding tokens and the potential yields generated by their reserve assets reveals a clear market efficiency deficiency. Staking vaults are the key tools to fill this gap, allowing users to unlock the yield potential of stablecoins without sacrificing liquidity or composability.
Debt-Based Strategies
Staking Stablecoins
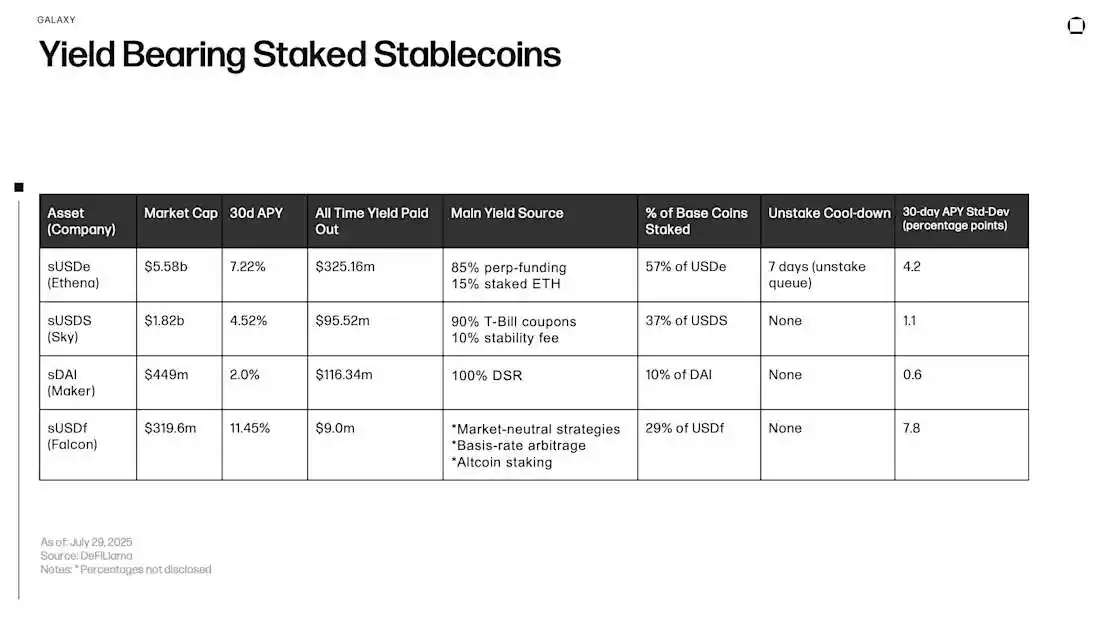
Staking stablecoins represent an evolutionary layer of on-chain dollar assets, allowing users to earn on-chain yields while maintaining the payability and broad applicability of their original tokens. When users deposit USDe, DAI, USDS, or USDf into the protocol's vault, they receive corresponding wrapper tokens (sUSDe, sDAI, sUSDS, or sUSDf). The redemption value of these wrapper tokens automatically increases with the inflow of protocol revenue. Yields are not reflected through the minting of new tokens but rather through the increasing claim of each wrapper token on the underlying stablecoin, keeping wallet balances unchanged while continuously compounding purchasing power in the background.
Although these wrapper tokens share an automatic compounding mechanism, their underlying cash flow sources differ:
sDAI and sUSDS pass through government bond interest and stability fee income from over-collateralized debt vaults;
sUSDf transmits fixed-rate credit income from the institutional lending platform FalconX;
sUSDe combines perpetual contract funding fees and liquid staking rewards collected through Ethena's Delta-neutral hedging strategy.
These mechanisms collectively transform idle stablecoin balances, which were previously in a state of opportunity cost, into flexible dollar-denominated savings tools that can still circulate freely in DeFi.
Different wrapper tokens also face varying regulatory treatments in different jurisdictions. In some markets, such products may be considered securities or collective investment instruments, leading some issuers to impose geographic restrictions on U.S. users or provide access through qualified investor exemptions.
Wrapper tokens can directly access lending markets, liquidity pools, and leveraged cycles, allowing users to flexibly switch between "stability" and "yield" based on their needs, transforming the same dollar asset into an interest-bearing on-chain tool.
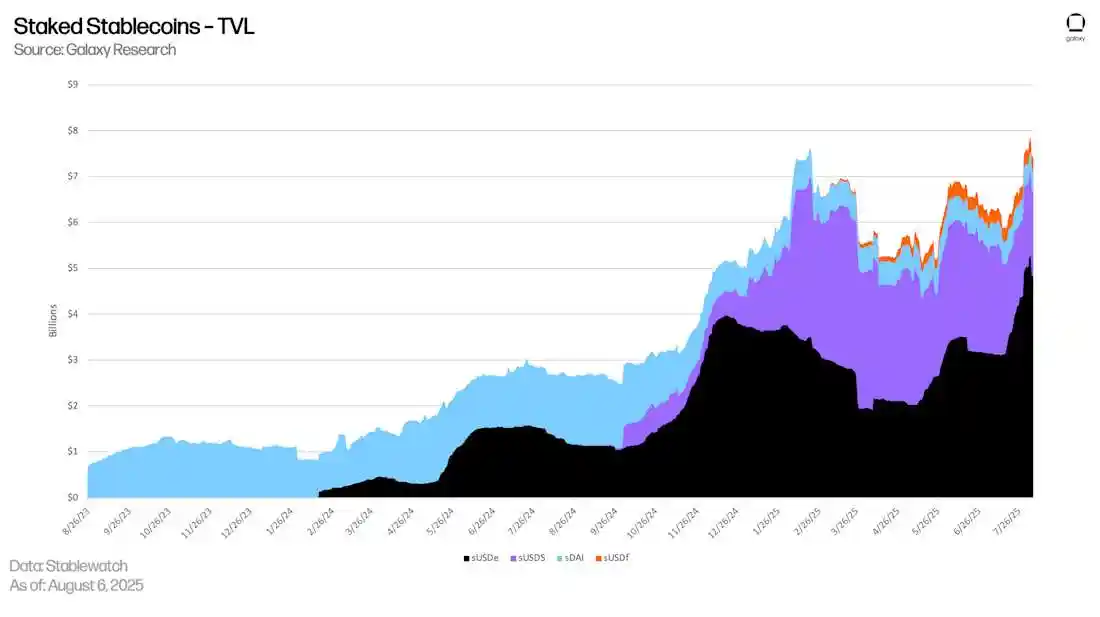
Key Points
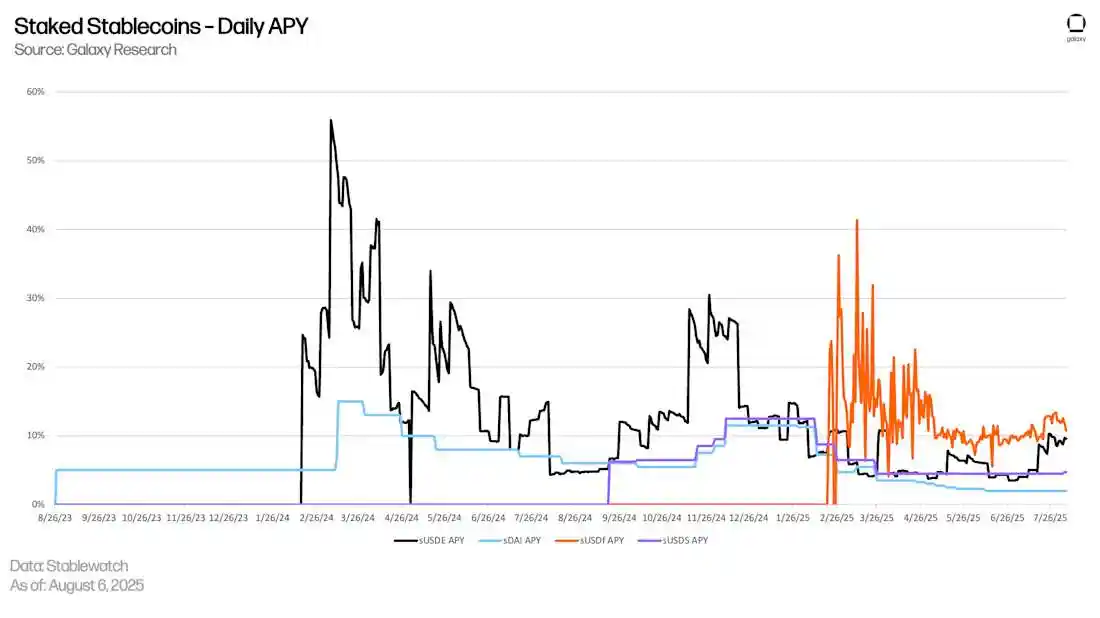
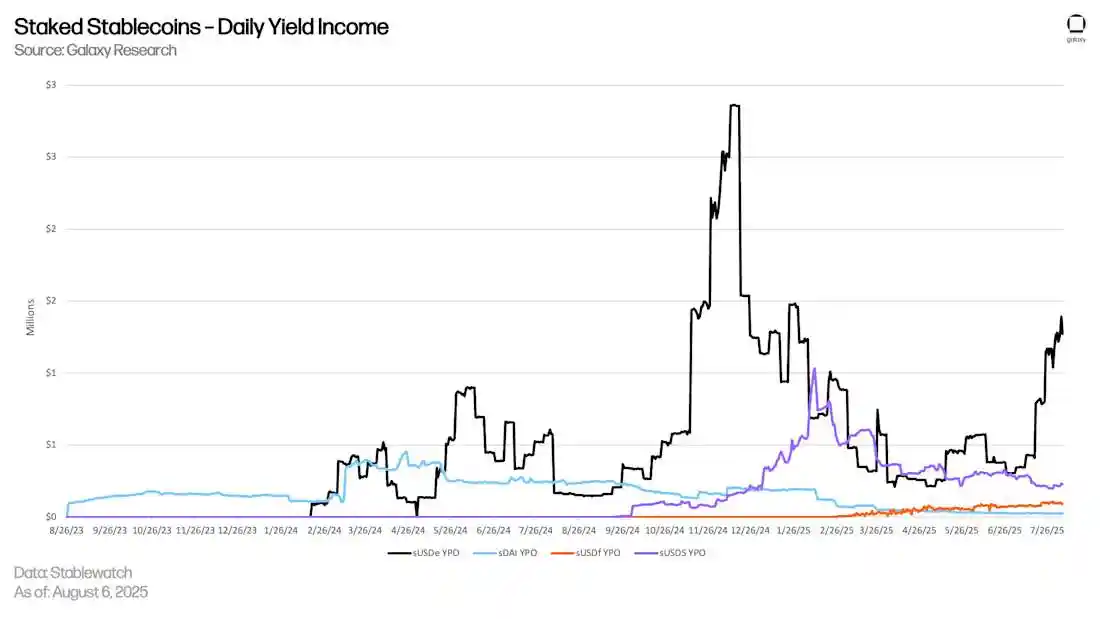
Ethena's sUSDe has become the leading product in the staking stablecoin sector: In the entire staking stablecoin segment, sUSDe currently dominates in total value locked (TVL), daily yield, and cumulative distribution amounts, far surpassing sDAI, sUSDS, and sUSDf.
At the beginning of 2024, sUSDe's yield briefly exceeded 50%. During this period, Ethena gained exceptionally high income from perpetual contract funding fees and basis trading, while the staking yield from its ETH collateral assets also contributed additional percentage points. Due to the limited initial supply of staked USDe, the limited supply of sUSDe led to concentrated yield distribution, thus driving up the annual percentage yield (APY). As funds continued to flow in and arbitrage opportunities narrowed, the same pool of funds had to be distributed among a larger number of sUSDe holders, leading to a decrease in yield.
After mid-2024, funding rates also stabilized, further compressing yields. Currently, sUSDe's 30-day rolling annualized yield stabilizes in the range of about 7% to 12%, still reflecting positive capital flows but no longer exhibiting the high volatility of the early stages.
Recent reasons for the rise in sUSDe yields?
The yield of sUSDe comes from daily accessible funding fees and incentive income, divided by the current circulating supply of sUSDe. Recently, three developments have pushed up the numerator while the denominator has remained relatively unchanged:
SPAC funding drives ENA buybacks, enhancing basis trading
In July 2025, the publicly listed special purpose acquisition company (SPAC) TLGY announced plans to merge with StablecoinX, a vault company within the Ethena ecosystem, along with approximately $360 million in PIPE investment (of which $260 million is cash and $100 million is ENA). The cash portion is used to repurchase locked ENA from a subsidiary of the Ethena Foundation, which will then use these funds for a market buyback of ENA at about $5 million per day over approximately six weeks. The transaction is expected to be completed in the fourth quarter, after which StablecoinX will continue to accumulate ENA according to a multi-year agreement. Market makers hedge this liquidity through the same spot long/perpetual short basis trading as Ethena, thereby enhancing funding rates and increasing the yield sources for sUSDe.
Treasury Redemptions Reduce USDe Circulation, but sUSDe Remains Stable
Ethena's treasury is repurchasing USDe in the secondary market and redeeming it, which reduces the circulation of non-staked USDe, while the supply of sUSDe remains nearly unchanged. Since protocol revenue is only distributed to sUSDe holders, the numerator increases while the denominator remains constant, leading to an increase in yield per sUSDe. In short: the reduction in stakable USDe means a decrease in newly issued sUSDe, thereby avoiding yield dilution.
"Liquid Leverage" Stacking Incentives on Aave Protocol
Under Aave's efficient mode (E-Mode), users can hold a position of 50% USDe / 50% sUSDe in a loop and receive an additional approximately 12% in platform incentive tokens, distributed daily, on top of the native sUSDe yield.
Yield rates are converging: After experiencing fluctuations in funding rates at the end of 2024, the 30-day rolling annualized yields of the four staking stablecoins have begun to converge. The extreme volatility of sUSDe has stabilized, currently centering around approximately 10%, comparable to the upper levels of other products.
Yield differences reflect underlying mechanism designs: The yield rates of sDAI and sUSDS adjust more smoothly, controlled by governance mechanisms; while the yield curves of sUSDe and sUSDf are more volatile, reflecting their dependence on perpetual contract funding fees and institutional credit flows. Overall, the yield range for all four has stabilized between the mid-single digits and low double digits.
Centralized Fiat-Collateralized Yield Stablecoins
Centralized fiat-collateralized yield stablecoins are tokenized assets based on regulated cash equivalents (such as dollar deposits and short-term government bonds), typically held by a single trust institution or asset manager. Issuers operate under a strict regulatory framework, required to perform KYC (Know Your Customer) and AML (Anti-Money Laundering) processes, and are often only open to qualified investors, regularly publishing audit or attestation reports to prove that each token is backed by a 1:1 asset.
This sounds similar to USDC and USDT. However, unlike these two mainstream stablecoins, such tokens distribute yields to holders. As long as a user’s address passes whitelist certification and assets remain within the issuer's ecosystem, yields will be automatically distributed without additional action. The trade-off is clear: investors gain professional custody, transparent audits, and institutional-grade entry, but lose the freedom of minting/burning, composability, and open liquidity found in fully decentralized models.
Unlike payment stablecoins restricted by the GENIUS Act, tokenized cash equivalent funds like BlackRock's BUIDL and Franklin Templeton's BENJI are classified as securities and can still distribute fund yields under the securities legal framework. Ondo's USDY is also issued as a security, thus its retail availability in the U.S. is limited by securities law rather than the GENIUS Act. In short, the GENIUS Act restricts interest payments on payment stablecoins but does not prohibit the distribution of yields from tokenized money market funds or similar securities.
Key Points
The tokenized government bond market is experiencing parabolic growth: The market capitalization in this sector reached $5.6 billion in April 2025, an increase of approximately $4.7 billion, marking a 545% rise and setting a historical high.
"Tokenized" government bond trackers: These tokens invest approximately 80%–100% of their reserve funds in short-term U.S. Treasury bonds and overnight repurchase agreements, so their 4%–5% yield essentially reflects the front-end Treasury yield transmission. The yield is determined by the market, reflecting supply and demand dynamics and market expectations of Federal Reserve policy paths. Therefore, the annualized yield of these tokens is highly correlated with the yield of 3-month Treasury bills, deviating slightly only due to fees, cash drag, or asset allocation differences.
High entry barriers and limited distribution channels: The primary issuance of BUIDL, BENJI, and USDY is only available to qualified investors, which explains the very few on-chain holding addresses: BENJI has fewer than 1,000 addresses, and BUIDL has fewer than 100, despite their market capitalizations reaching billions of dollars.
High market concentration with clear target users: BUIDL alone accounts for nearly half of the market capitalization in this segment, clearly targeting institutional treasury users seeking exposure to tokenized money markets; USDY and BENJI attract a smaller investor group focused on RWA (real-world assets).
Liquidity remains limited: Currently, these tokens are only listed on 5–10 trading platforms, with major liquidity concentrated in licensed institutional channels rather than public AMM (automated market maker) markets. Before being listed on broader exchanges and enhancing on-chain liquidity, these tokens resemble "tokenized fund shares" rather than truly interchangeable and composable stablecoins.
To date, stablecoin yields primarily stem from debt structures within the traditional financial system, with returns dependent on off-chain collateral and interest rates, ultimately determined by issuers, banks, and market makers. In contrast, the operational model of protocol-level yields is entirely different: rewards are distributed in the form of native tokens, with funding sources including block issuance, transaction fees, and other on-chain revenues. The native re-staking mechanism further utilizes the same collateral assets across multiple services to generate additional yields, shifting risks from traditional finance to smart contracts, slashing penalties, and enhanced cross-protocol correlations.
Protocol-Driven Yield
Native Staking Mechanism
The native staking mechanism transforms Proof-of-Stake (PoS) tokens into productive assets, allowing holders to share the income earned by validators for maintaining network security and operation (after deducting the commission retained by validators). Most of the yield comes from newly issued tokens, compensating validators for proposing blocks and validating blocks; another portion comes from transaction fees and other on-chain revenue sources, such as maximum extractable value (MEV), which is gradually increasing.
As the token inflation rate declines over time, while fee income fluctuates with network activity, the actual yield rate is a dynamic variable influenced by the token economic model, network throughput, and validator behavior. When assessing staking yields, it is essential to consider the liquidity costs associated with locking assets, as well as tail risks such as slashing.
Where Does the Yield Come From? (Using Ethereum as an Example)
Ethereum is currently the largest staking protocol, and here are its main sources of yield:
Newly Issued ETH (Protocol Rewards)
Ethereum issues new ETH through the PoS mechanism.
Rewards are distributed to validators for:
Proposing blocks (when selected as block proposer)
Validating blocks (voting on block validity)
Participating in sync committees (for light client support)
These base rewards are algorithmically adjusted based on the total staked ETH across the network.
Priority Fees (also known as Tips)
Users can attach priority fees when submitting transactions to incentivize validators to process transactions faster.
Unlike base fees, priority fees are not burned but are directly paid to the validators proposing the blocks.
Priority fees are volatile, typically rising during network congestion or periods of DeFi activity.
Maximum Extractable Value (MEV)
Validators that integrate MEV relays or block builders can extract additional value by reordering, inserting, or censoring transactions within blocks.
Common MEV strategies include:
Sandwich attacks
Arbitrage between decentralized exchanges
Front-running liquidation events
MEV income is optional and non-guaranteed, available only to validators connected to MEV relays (such as Flashbots).
MEV income is highly variable, significantly influenced by market activity and validator participation.
Native Staking Methods on Ethereum
Running a Validator Node (Minimum 32 ETH)
Deposit exactly 32 ETH into the official staking contract.
Running a validator node requires ensuring the node is online; otherwise, it will face slashing penalties.
All rewards go directly into the validator's balance.
To withdraw funds, one must initiate the exit process and wait in the validator queue.
Sources of yield: from block proposals, block validations, and priority fees collected through validator participation.
Staking through Exchanges (e.g., Coinbase, Kraken) — Custodial Native Staking
Deposit ETH into an exchange account and select "Stake."
The exchange uses its validator infrastructure to stake ETH on behalf of users.
Users do not receive liquidity tokens (unless they actively choose wrapped tokens like cbETH).
Rewards are displayed in the staking balance within the platform.
Exchanges typically charge a fee from staking rewards.
Sources of yield: the same as running a node independently, but shared between the exchange and the user. Users receive net yields after platform fees are deducted.
Key Points
Yield Source Structure: Rewards primarily come from two channels: most chains pay validators or delegators with newly issued tokens, while another portion comes from transaction fees and on-chain income (such as MEV). This structural difference is crucial—newly issued tokens are inflationary, while fee-driven yields do not dilute token value.
Real Yield Perspective: Nominal yield rates must be assessed in conjunction with token supply expansion and validator commissions. High APRs may yield negative actual purchasing power after accounting for inflation and fees; whereas models like Ethereum with burn mechanisms may result in actual yields exceeding nominal rates.
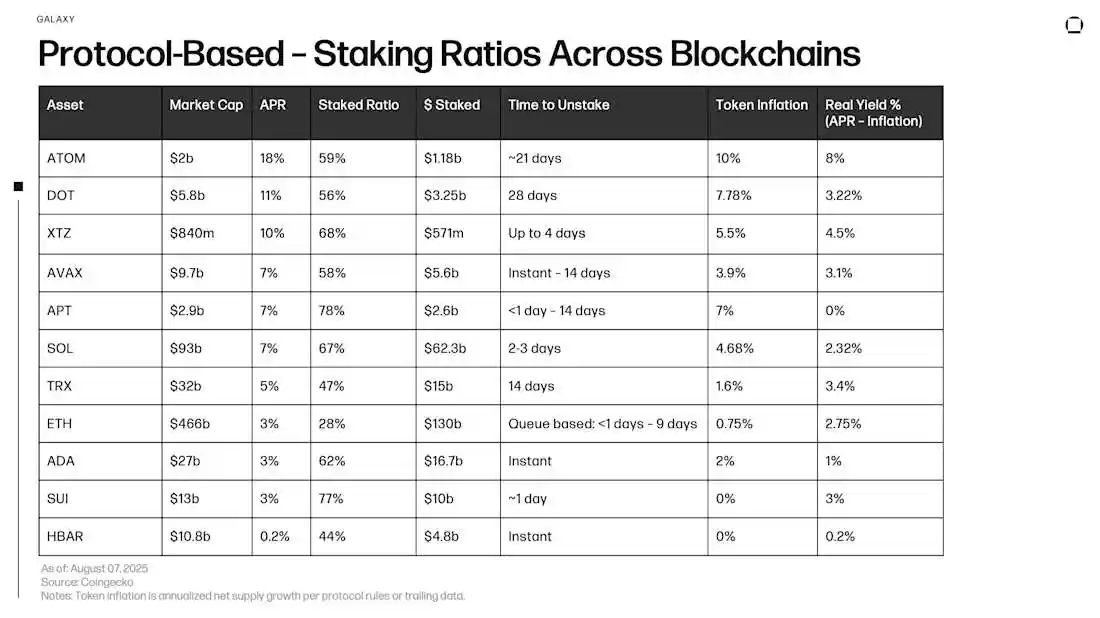
Relationship Between Participation and Security: A higher staking ratio typically means more economic weight is used to secure the network, but it may also compress yields and reduce circulating supply, exacerbating price volatility when large holders exit.
Liquidity Differences: The unstaking time varies significantly across different chains: for example, Hedera's HBAR or Cardano's ADA can be withdrawn instantly, while Stellar's XLM and Polkadot's DOT require waiting several weeks, and the timing is not fixed. Ethereum's experience shows that even "flexible" systems can experience congestion when many validators exit simultaneously.
Risks
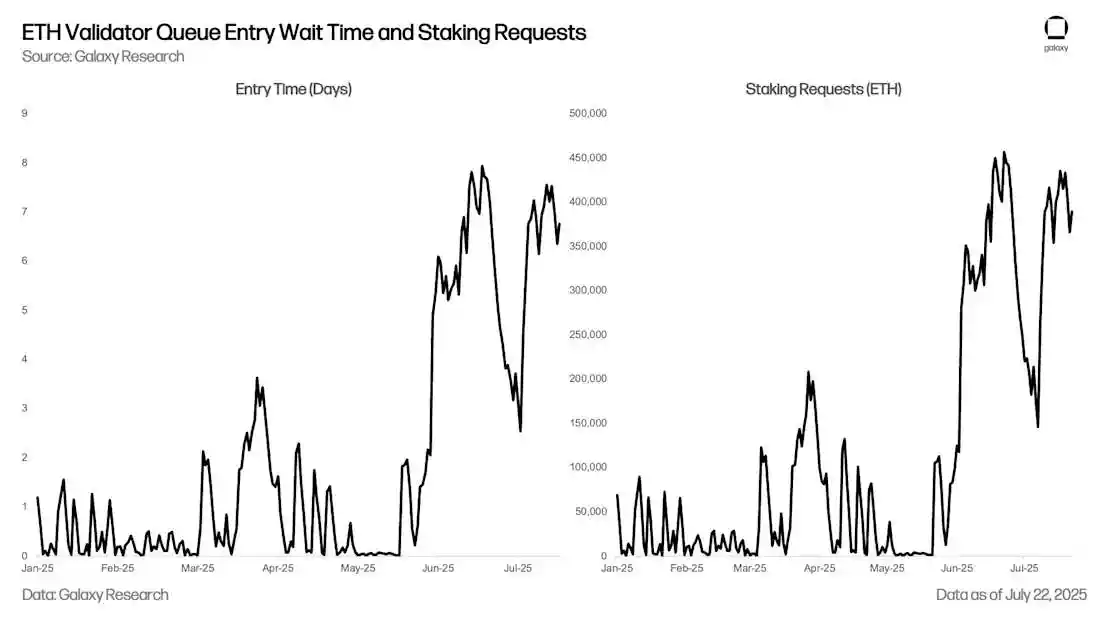
Queue Congestion for Exits: In late July 2025, the Ethereum validator exit queue exceeded 600,000 ETH, approximately $2.3 billion, with waiting times extending to over 8 days, setting a historical high. Galaxy's report "Why the Ethereum Exit Queue Suddenly Expanded" provides a detailed analysis. Such a backlog during market pressure could lead to funds being trapped and create selling pressure when unstaked tokens eventually flow into exchanges.
Penalty Mechanisms and Performance Risks: Validators may have part of their staked assets slashed if they exhibit double-signing or go offline. Delegators also bear this tail risk, thus they must trust the operational capability and discipline of the supported nodes.
Reward Volatility: The monetary policy of tokens may change (for example, XLM recently lowered its maximum inflation rate to 10%), while fee income fluctuates with network usage, so sustained stable yields are not guaranteed.
Smart Contract and Cross-Chain Bridge Risks: Even with native staking, validator software and underlying protocols still rely on complex smart contracts and code, which may have vulnerabilities or security risks. While native staking avoids the bridging and oracle risks common in liquid staking, it remains exposed to potential issues in client implementations or consensus rules.
Regulatory and Tax Uncertainty: Different jurisdictions have varying points in time for taxing staking income (upon receipt or upon sale), and policy changes can alter the economic benefits of staking in a short time.
Liquid Staking
As mentioned earlier, since Ethereum transitioned from Proof of Work (PoW) to Proof of Stake (PoS) in 2022, staking has become one of the foundational practices in DeFi. By locking ETH (or SOL on Solana) in network contracts, token holders help maintain consensus security and earn rewards. Traditional staking, while supporting network validation mechanisms, also means that assets are locked until the exit or unbinding process is completed, thus limiting liquidity and leaving capital that could be used for other purposes idle.
Liquid staking addresses this limitation. When users stake ETH or SOL, they receive a liquid staking token (LST) that represents their staked assets. After obtaining LST, holders can trade, lend, or use it as collateral in DeFi while still earning the underlying staking rewards.
In short, liquid staking delegates native staking to third-party operators in exchange for a composable token.
Where Does the Yield Come From?
The yield sources for liquid staking are the same as for native staking. The difference lies in the operational method: users delegate the responsibilities of running validators (key management, node uptime, block proposing and validation, fee and MEV revenue settings) to third-party operators and receive a liquid staking token (LST) that can be freely used in DeFi. Subsequent sections will further explore the application opportunities of these tokens in the on-chain ecosystem.
Risks and Key Points
Unstable Peg (De-Pegging Risk)
Liquid staking tokens (LST) like stETH aim to maintain a peg with ETH, but this connection may deviate. A recent example saw stETH trading at a discount due to a triple pressure scenario: soaring ETH borrowing costs on the Aave protocol, users accumulating leverage in liquid staking, and congestion in the validator exit queue slowing redemptions. In such cases, the arbitrage mechanism weakens, and the liquidity pool becomes imbalanced, causing LST prices to deviate from ETH. If large holders concentrate their sell-offs during periods of low liquidity, even slight imbalances may persist unless the market has deeper, more stable liquidity or faster redemption mechanisms.
Liquidity Crisis
Whether users can smoothly enter and exit LST positions heavily depends on the health of the secondary market. For example, the stETH/ETH trading pair on Curve Finance is a major liquidity hub for stETH but is prone to imbalance during market volatility. If a large amount of LST is dumped into these pools, it may lead to one-sided liquidity, resulting in high slippage and poor trade execution. Although Lido has staked over 9 million ETH, its market share has recently declined, and adjustments to Curve pool parameters have exposed the fragility of LST liquidity infrastructure. Once liquidity thins and the exit queue backs up, users may only hold discounted assets and be unable to redeem immediately.
Leverage Amplification Effect
Many users borrow ETH using LST (like stETH or rETH) as collateral, then exchange ETH for more LST and re-stake, creating a cycle of leverage. This strategy can amplify returns during stable market conditions but also introduces systemic risk. When the peg deviates or interest rates soar, such positions are vulnerable to liquidation, potentially triggering a chain sell-off of LST, further depressing prices, draining liquidity pools, and triggering more liquidations, creating a feedback loop. Leverage amplifies both returns and risks, particularly evident in volatile markets.
Centralization and Counterparty Risk
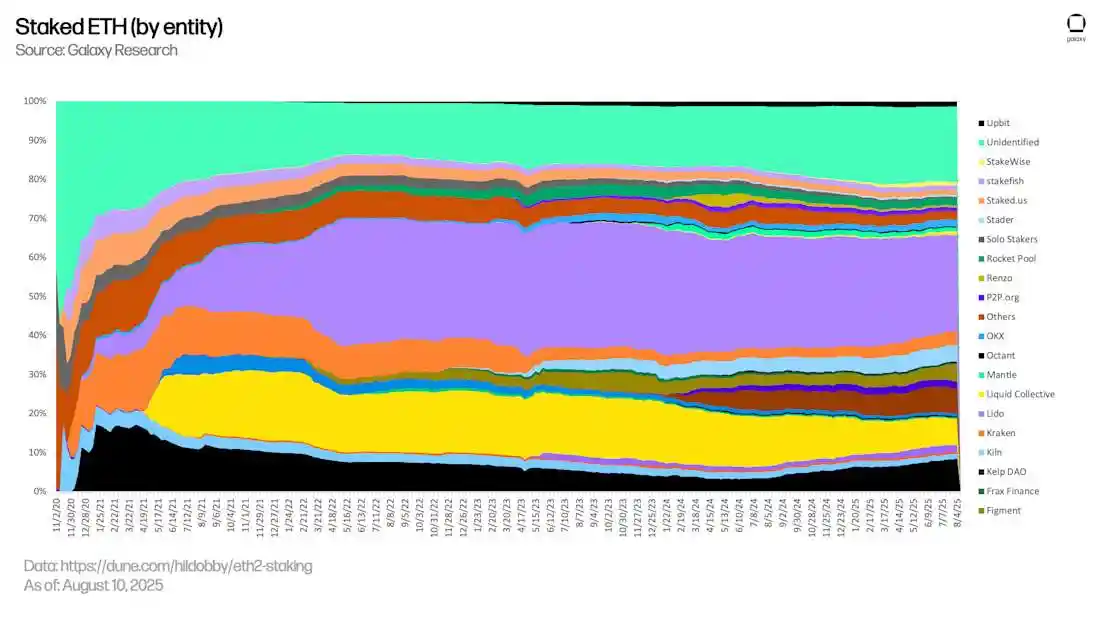
Although LST protocols aim to decentralize the staking process, many still rely on a few validator operators and governance structures. For instance, Lido manages a significant amount of liquid-staked ETH, creating systemic concentration risk. Any governance issues, validator errors, or smart contract vulnerabilities could impact protocol stability and trigger market chain reactions. Additionally, the DeFi ecosystem's reliance on a few liquidity pools and wrapped tokens means that design parameters (like Curve's amplification factor or redemption mechanisms) significantly affect user experience and market health.
Redemption Delays and Market Vulnerability
Although Ethereum has supported the withdrawal of staked ETH since the Shapella upgrade in 2023, the redemption process for LST still relies on the validator exit queue on the blockchain. During peak demand periods, this queue may become severely congested, leading to redemption delays. If the secondary market is also under pressure at this time, users may be unable to sell their unstaked ETH at face value. The mismatch between redemption logic and market liquidity exposes LST to liquidity shortage risks during high volatility or structural stress.
Liquid Re-Staking
Liquid re-staking is the next stage of on-chain capital efficiency evolution, built on the foundation of liquid staking. Through protocols like EigenLayer, users can deposit their liquid staking tokens (LST) into "Active Validator Services" (AVS) — decentralized systems that require trustless validator security. In exchange, users receive a new liquid re-staking token (LRT), such as eETH, ezETH, or rsETH. These LRTs retain the composability and liquidity of the original LST while adding new sources of yield.
The core advantage of liquid re-staking lies in its incentive stacking capability:
Users continue to earn native staking rewards from Ethereum;
They can also receive incentives provided by AVS, including points (similar to crypto versions of "miles"), airdrops, and early token distributions;
Many LRT protocols also support DeFi integrations, such as liquidity mining and lending, further enhancing potential yields without sacrificing asset liquidity.
This multi-layer incentive structure transforms previously passive, locked collateral into active tools that generate yield and participate in DeFi. It allows ETH or SOL to become multi-purpose capital, providing security for multiple networks while earning returns.
As the re-staking economy matures, liquid re-staking is expected to become a key component of modular infrastructure in Ethereum and Solana.
Where Does the Yield Come From?
Liquid re-staking tokens (LRT) unlock additional sources of yield on top of standard staking rewards, thereby enhancing overall returns. Specifically, these include:
Re-staking incentives from AVS: LRT participates in networks like EigenLayer's "Active Validator Services" (AVS), providing security for emerging decentralized services. These services pay incentives to re-stakers, including points (similar to crypto versions of frequent flyer rewards), early token distributions, or future airdrops.
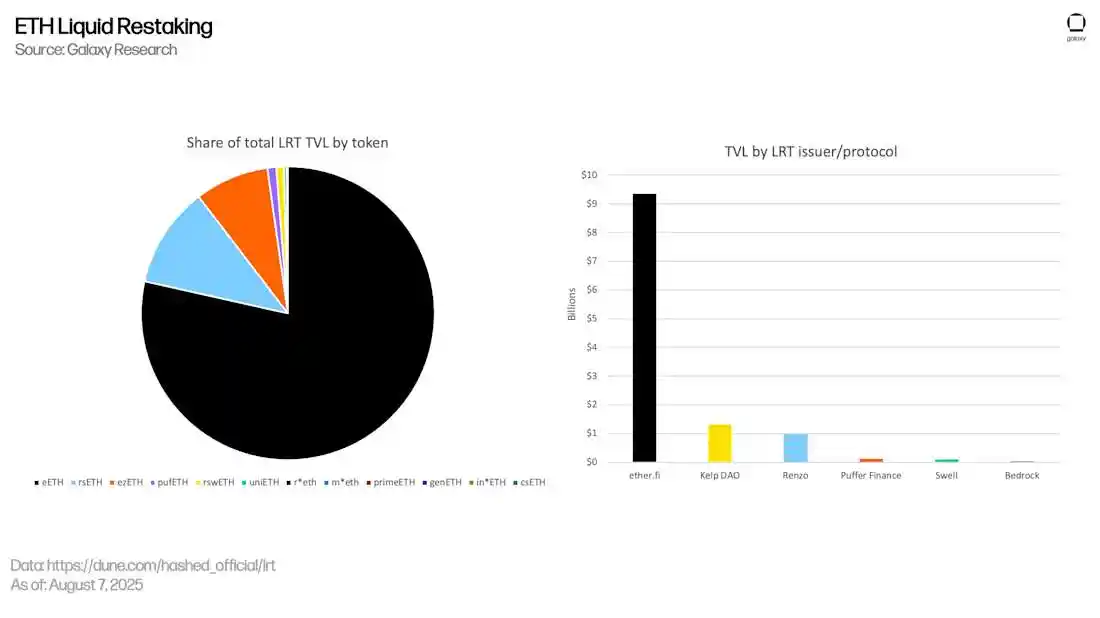
Protocol incentive programs: Issuers of LRT (such as Renzo, ether.fi, Kelp DAO) typically launch loyalty points, reward multiplier mechanisms, or liquidity mining activities to attract user participation. These incentives can significantly boost net yields, especially in early stages.
DeFi integration: LRT can typically be deposited into lending markets, decentralized exchange (DEX) liquidity pools, or automated vaults, allowing users to earn additional on-chain yields while receiving re-staking rewards.
Key Points
LRT Expands Staking to New Yield Layers
Liquid re-staking tokens (LRT) redeploy staked ETH or SOL into decentralized services, providing security for them and unlocking new incentive sources beyond standard staking rewards.
Re-staking yields are driven by AVS, not just Ethereum.
Unlike LST, which relies solely on Ethereum's native PoS rewards, LRT also layers incentives from AVS, including points, airdrops, and early token distributions, representing an expanded yield path for EigenLayer and its ecosystem.
LRT Maintains Liquidity and Composability
Similar to LST, LRT is an ERC-20 (or SPL on Solana) token that can be freely traded, participate in DeFi, and access lending markets, vaults, and AMMs. Users can continuously earn yields without locking their assets.
Not All Yields Are Paid in ETH or SOL
Currently, many LRTs yield forms include points, future protocol tokens, or ecosystem incentives. These rewards do not always possess liquidity or certainty, but they play a central role in the current yield strategy.
Protocols Compete Through Multi-Layer Incentives
Leading LRT issuers (such as Renzo, ether.fi, Kelp DAO) actively enhance user returns through loyalty points, reward multiplier mechanisms, and integrations with EigenLayer and partner AVS, making LRT a dynamic component in DeFi yield stacking.
LRT Is Still in Development
Re-staking remains an emerging field, and ongoing attention is needed regarding risks surrounding penalty mechanisms (slashing), AVS reliability, smart contract complexity, and incentive dilution.
Risks
The composability of LRT brings powerful strategies but intertwines risks. If an AVS is attacked or a node operator violates penalty rules, multiple positions may suffer penalties simultaneously, causing LRT holders, LST holders, and native stakers to share the associated losses. What appears to be an attractive yield stacking relies on the prudent behavior of operators, the transparency of governance mechanisms, and the market's ability to withstand liquidity shocks, especially during concentrated exits of large positions.
Lending Mechanism
On-chain lending transforms idle tokens into productive capital. Depositors provide assets to money market contracts and receive interest-bearing certificates; borrowers, on the other hand, borrow assets from liquidity pools at floating rates with over-collateralization, where rates increase as fund utilization rises. When the margin of a position falls below a safe threshold, the smart contract automatically triggers a liquidation mechanism. The interest paid by borrowers flows in real-time to depositors, thus the yield directly reflects the market's immediate demand for leverage.
Unlike non-yielding stablecoins that sit statically in wallets, DeFi lending protocols channel these assets into shared liquidity pools, turning them into yield-generating capital. Anyone can deposit stablecoins, immediately becoming a "lender" and earning a floating interest rate set by the protocol's algorithm. Borrowers must provide separate collateral assets to borrow funds from the public pool and pay interest back into the pool. This mechanism constructs a real-time operating credit market, where supply and demand continuously adjust dynamically: when borrowing demand surges, yields rise; when liquidity is abundant, yields fall. The liquidation process is automatically executed when the value of collateral assets falls below the safe threshold.
Essentially, non-yielding stablecoins only provide dollar exposure to a single issuer and do not generate income; whereas the DeFi lending market circulates these collateral assets among multiple participants, transforming idle tokens into systemic credit tools while distributing yields and risks between lenders and borrowers.
Where Does the Yield Come From?
Lending protocols operate through various mechanisms to create additive yield paths for both sides of the market.
Interest Paid by Borrowers
The core component is that lenders earn floating rate yields paid by borrowers. The interest rate dynamically adjusts based on fund utilization—higher borrowing demand leads to higher rates. Borrowers may use this to hedge risks, leverage, or release liquidity without selling assets.
Protocol Incentive Programs
Many lending protocols, especially in early or growth stages, distribute native governance tokens (such as COMP, AAVE, MORPHO) to lenders and borrowers. These incentives act as subsidies, enhancing lenders' net annual percentage yield (APY) while offsetting borrowers' costs. In some cases, the incentives distributed even exceed the base interest rate, enabling "yield farming" even in low-rate environments.
Native Yields of Underlying Assets
When users lend assets that have native yields (such as stETH, rETH, or ezETH), they can still earn the staking or re-staking rewards embedded in these tokens. These rewards continue to accumulate passively during the asset's deployment in the lending pool, forming dual sources of yield:
One part comes from staking or re-staking mechanisms;
The other part comes from lending interest or protocol incentives.
In some cases, this structure can be further amplified through leveraged cycles (for example, lending ETH and then re-staking or lending again), achieving compounded yields.
Yield Stacking Mechanism: An Important Aspect of DeFi Innovation
Yield stacking is gradually becoming a representative innovative mechanism in the DeFi space. Previous analyses have pointed out that users can stake ETH or SOL as liquid staking tokens (LSTs), such as stETH, rETH, or JitoSOL, and further re-stake them as liquid re-staking tokens (LRTs), such as eETH or ezETH. These underlying assets can continuously earn yields through protocol staking and re-staking processes.
However, this is just the initial layer of the yield structure.
On lending platforms like Aave, users can deposit LST or LRT into the lending market, thereby earning additional interest returns on top of the original staking yields. Such platforms typically pay depositors a floating annual percentage yield (APY), with funds sourced from borrowers providing collateral assets to obtain liquidity. This mechanism allows users to form dual yield paths without needing to unstake or sell assets: one source comes from protocol staking, and the other from interest income in the lending market.
The emergence of this model reflects that DeFi yield strategies are evolving towards greater complexity and efficiency.
Using stETH to Achieve Yield Stacking
Suppose a user holds stETH worth $10,000, representing ETH staked through Lido, continuously earning Ethereum's native staking rewards. Instead of holding stETH statically in a wallet, the user chooses to deposit it into Aave V3—the most advanced market of the protocol—as collateral.
Through this operation, the user not only continues to earn staking rewards from stETH but also qualifies for additional lending income from the Aave protocol. On the Aave platform, other users can borrow stETH, and stETH holders can share in the interest paid by borrowers.
This strategy allows a single asset to generate multiple sources of yield simultaneously, combining passive staking income with protocol-level lending returns while retaining the liquidity of the collateral asset for funding when needed.
Yield Stacking Strategies for Stablecoins
The concept of yield stacking naturally extends to stablecoins. For example, users can deposit stETH into Aave as collateral and borrow stablecoins like USDe or DAI.
The borrowed stablecoins can further be used for:
Re-depositing into Aave or other protocols to earn lending yields
Investing in yield farms or automated strategy vaults
Converting into more stETH or other LSTs to cycle holdings and increase exposure
Whether passively held or actively deployed, this portion of borrowed funds constitutes a second layer of broader yield strategies, making leverage a composable and capital-efficient tool to maximize yields across multiple protocols.
Yield Cycling Mechanism on Aave
Aave also supports users in achieving yield stacking through "cycling" operations, where they borrow funds against collateral and then reinvest the borrowed assets into similar assets. For example, users can use stETH as collateral to borrow ETH, then convert the ETH into more stETH and re-deposit it into Aave. Each round of cycling increases the user's exposure to stETH and further compounds their staking and lending yields. This strategy is commonly referred to as "leveraged staking."
While cycling operations can amplify potential returns, they also introduce leverage risks. Since this strategy is debt-supported, changes in market conditions (such as stETH price falling below ETH or rising borrowing rates) can quickly increase the loan-to-value (LTV) ratio. Once the LTV exceeds the liquidation threshold set by the protocol, the user's collateral may face partial or full liquidation.
Therefore, cycling strategies are inherently more volatile, especially in environments with low liquidity or significant market fluctuations, requiring active monitoring. For most users, this is a high-reward strategy that requires risk tolerance and operational precision.
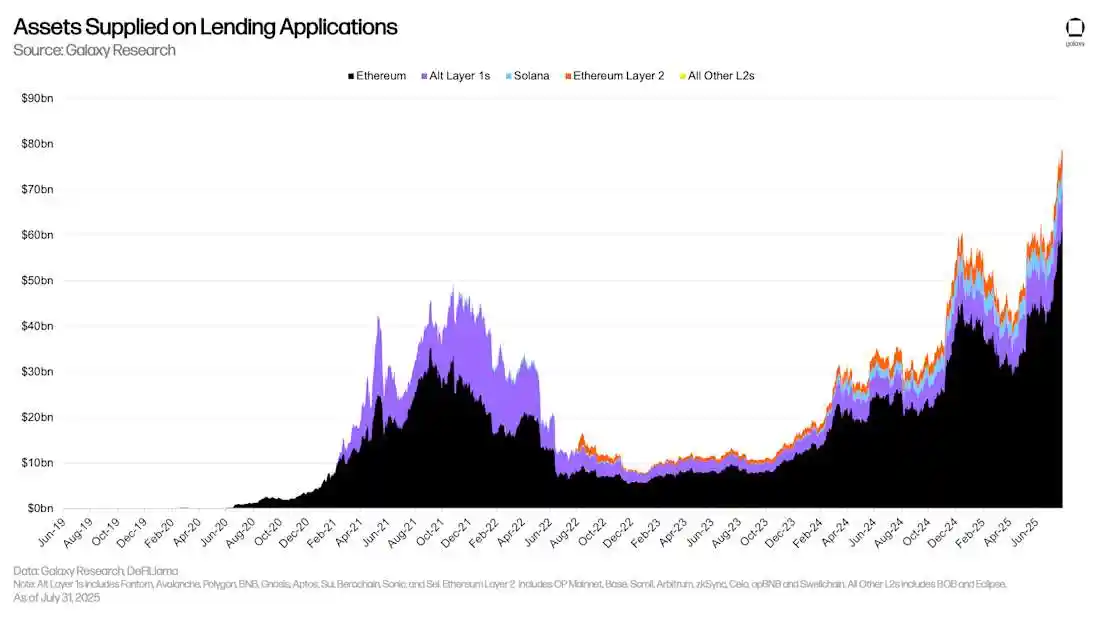
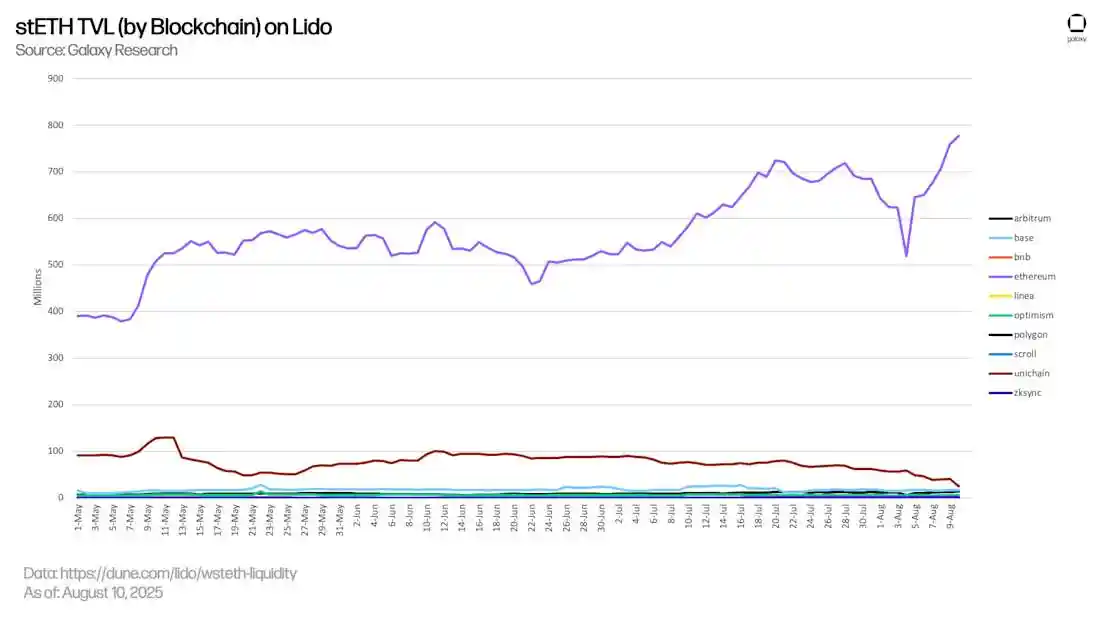
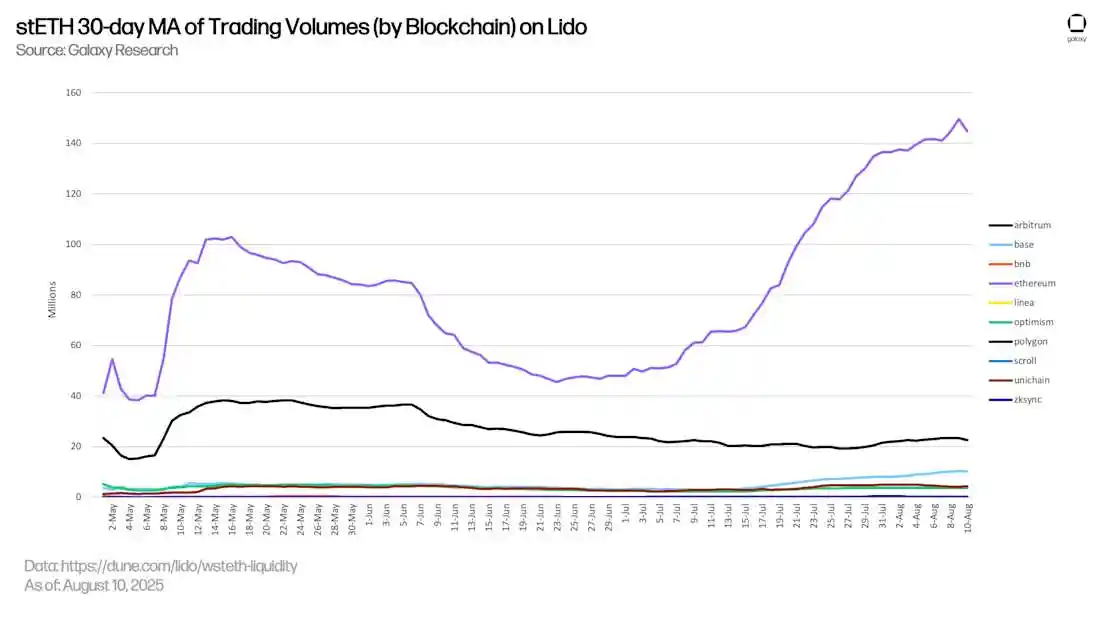
The stack of colored bands in the chart above shows capital scattering across dozens of chain-specific deployments. While this diversifies tail risk, it also dilutes on-chain liquidity and forces traders to bridge or pay up for cross-chain liquidity, an operational headache that did not exist when lending was an almost-pure Ethereum story in 2020-2021.
Together the charts confirm that the lending sector has recovered in size but not in efficiency: abundant deposits chase episodic borrowing booms, rates gyrate accordingly, and liquidity is now spread over far more venues and chains than in the last cycle, a landscape that rewards active rate-shopping and careful collateral management.
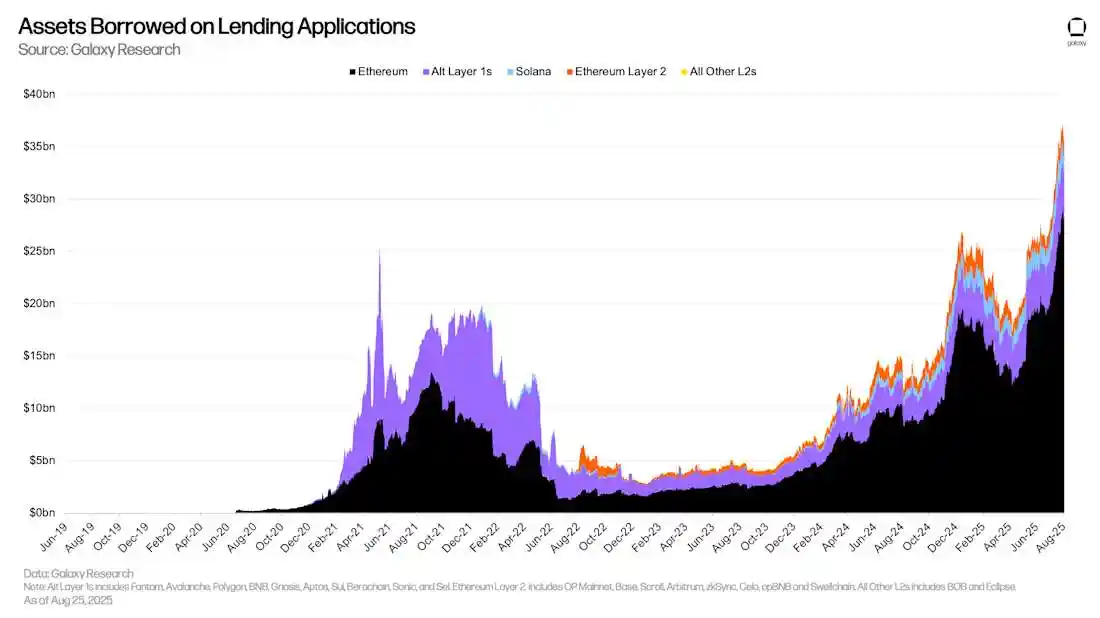
Key Points
Market activity has returned to high levels, but the structure is changing. The activity in the decentralized lending market is nearing historical highs, but there is a noticeable shift in the funding structure. Currently, the total supply in the funding market has surpassed $80 billion, while the outstanding loan size is close to $35 billion, returning to levels seen during the 2021–2022 bull market. The Ethereum mainnet (the black portion in the chart) remains the primary support, but the fastest-growing segment comes from layer 2 networks (L2) like Optimism and emerging alternative layer 1 networks (alt-L1), echoing the migration phenomenon noted in Galaxy Research's "State of Crypto Lending" report released in April.
Despite the overall activity warming up, the utilization rate of funds remains weak, reflecting structural liquidity excess. In each market upcycle, the gap between fund supply and borrowing continues to widen, with only about 40% of deposits actually being borrowed. This "idle" state keeps borrowing rates for mainstream assets at mid-to-low levels, even as speculative demand in the market rises without significant fluctuations.
Lending costs exhibit cyclical fluctuations rather than long-term trends. The annual percentage rate (APR) for stablecoins on the Ethereum mainnet fell below 2% at the end of 2022, while during the funding rate fluctuations in the first quarter of 2024, it surged to 15%. The current 7-day moving average stabilizes in the 5%–6% range. This pattern aligns with observations in the April report, indicating that lending yields are closely related to leveraged trading (such as arbitrage and re-staking cycles) rather than stemming from sustainable credit demand.
Risk Factors in DeFi Lending
Liquidity Mismatch and Utilization Risk
The current deposit size in the DeFi lending market is nearing $85 billion, while outstanding loans are only about $35 billion, indicating that approximately 60% of funds are idle. Galaxy's lending report released in April noted: "By the end of 2024, the total open DeFi borrowing will only be $19 billion, covering 20 protocols, despite rebounding nearly 9.6 times from the bear market low." If the market suddenly shifts to safer yield channels, protocols may be forced to lower interest rates or incentivize users to withdraw funds, particularly pressuring smaller chains with weaker liquidity.
Diversified Collateral Assets and Concentrated Liquidations
Currently, more than a dozen L1 and L2 networks host lending pools, but the liquidation mechanisms for most assets still rely on a few bots and arbitrageurs. Once price correlation shocks occur, cross-chain liquidations may happen rapidly, even outpacing the response capabilities of bridging or arbitrage mechanisms, thereby amplifying market pullbacks during each spike in funding rates.
Interest Rate Fluctuations Driven by Speculative Leverage, Not Sustainable Credit Demand
Since 2021, the APR for stablecoins in the Ethereum lending market has fluctuated dramatically between 2% and 16%, primarily influenced by funding rate trading and re-staking cycles rather than genuine funding demand. Galaxy's report states: "Lending yields are closely related to leveraged trading, not long-term credit demand." Investors need to be aware that high-yield moments (such as rates exceeding 12%) are often short-lived and quickly revert to the mean.
Asymmetric Access
Although anyone can provide liquidity, many high-yield opportunities (such as independent lending pools on smaller L2s) often require cross-chain operations, custom oracles, or governance whitelist permissions. Ordinary users who leave funds on the mainnet may face the same market risks but receive lower returns, reflecting a structural issue of "mismatch between risk and availability," which is not reflected in the surface APR metrics.
In summary, while the DeFi lending market continues to grow in scale, it still faces structural risks such as liquidity mismatches and cyclical fluctuations, which are not commonly seen in non-yielding collateralized stablecoins (like the CDP model). Investors should carefully assess the systemic vulnerabilities behind their pursuit of yields.
Structured Yield
As DeFi gradually evolves from basic lending and staking mechanisms to more complex financial structures, a new wave of protocols is exploring how to repackage and customize yields themselves. This area is known as "structured yield," focusing on separating, automating, or tokenizing future cash flows to make yield mechanisms more akin to complex instruments in traditional finance.
Among them, Pendle and Euler v2 are representative innovative projects in this field. Both aim to provide users with more advanced yield strategies, but their paths differ: Pendle achieves yield splitting and trading through yield tokenization, while Euler v2 builds flexible yield combinations through modular strategy vaults.
Pendle V2
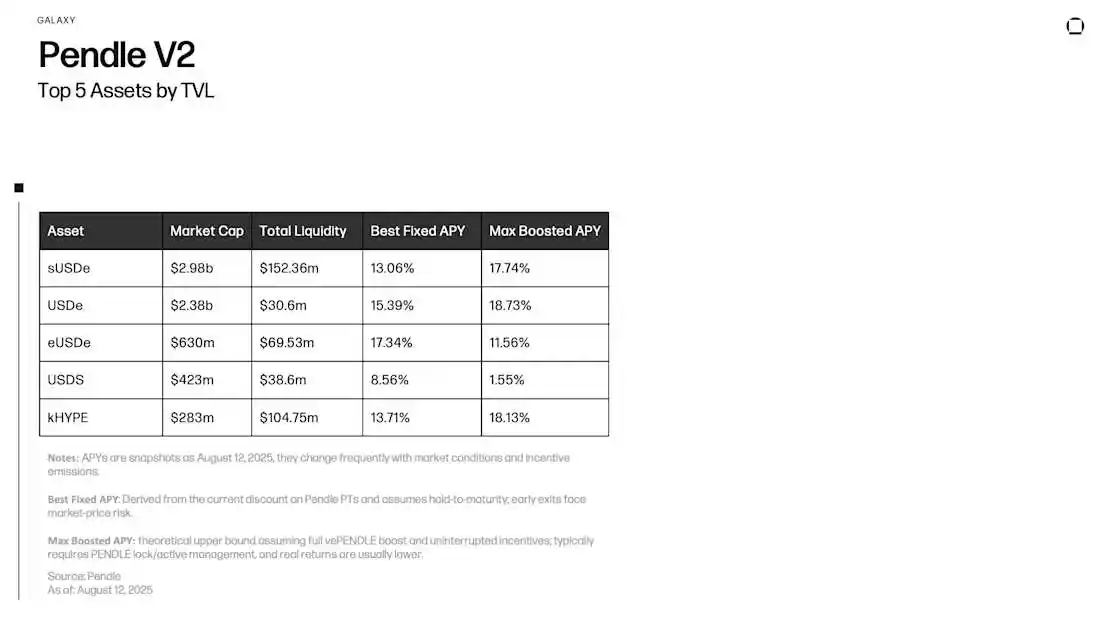
Maximum Boosted APY: The "Maximum Boosted APY" displayed by Pendle is a theoretical upper limit, assuming users receive the full vePENDLE incentive boost, choose the optimal liquidity pool, continuously capture rewards, and follow the current incentive plan. This yield is volatile, dependent on incentive mechanisms, and does not constitute a guarantee. Typically, it requires locking PENDLE tokens or actively managing LP (liquidity provider) and YT (yield token) positions. Actual yields may be significantly lower than theoretical values and do not include trading fees, slippage, and gas costs.
Pendle is a DeFi protocol that allows users to split yield-generating assets into two independent tokens, enabling more precise control over time-based yields. This mechanism, known as "Yield Tokenization," allows users to separate, trade, and structure yields, breaking through the limitations of traditional staking or lending protocols.
When users deposit supported assets (such as stETH, ezETH, sDAI, or USDe), Pendle locks the asset and issues:
Principal Token (PT): Represents the right to redeem the original asset at a set maturity date. PT does not generate yield and typically trades at a discount. Holding PT is akin to locking in a fixed return, regardless of how market yields fluctuate during the holding period.
Yield Token (YT): Captures all floating yields generated from the investment period until maturity. YT holders receive returns based on yield accumulation, and its market price reflects expectations for future rewards, making it usable for speculation or hedging against interest rate trends.
This structure is similar to the "Principal/Interest Separation" mechanism introduced by mortgage securities on Wall Street in the 1980s, allowing users to customize exposure based on risk preferences. Risk-averse users can purchase PT to lock in fixed returns, while those seeking high yields or directional trades can buy YT to capture floating returns such as staking APY or protocol incentives. These tokens can be freely traded, combined, or sold individually.
Users can deposit PT tokens as collateral in Aave or Morpho and manually perform yield cycling operations. However, such strategies require active management, including monitoring borrowing limits, liquidation risks, and position rebalancing under market volatility. Lending platforms typically accept PT rather than YT, as PT is similar to zero-coupon bonds, redeemable at face value upon maturity, with clearer pricing and risk assessment. YT, on the other hand, is a floating, time-decaying yield token that is usually not accepted as collateral.
Pendle separates principal and yield and automates operations through ecosystem tools. For example, the Boros protocol builds PT yield cycling strategies based on Pendle: borrowing against PT as collateral, purchasing more PT, re-depositing, and repeating the operation within preset risk limits. The goal is to capture the spread between the fixed yield implied by PT and the floating borrowing rate, forming stable returns after deducting fees and slippage. While cycling strategies are common in DeFi, this "fixed spread" model is unique to Pendle PT design. Cycling operations on other assets (like LST) primarily aim to amplify exposure rather than lock in spreads.
Boros
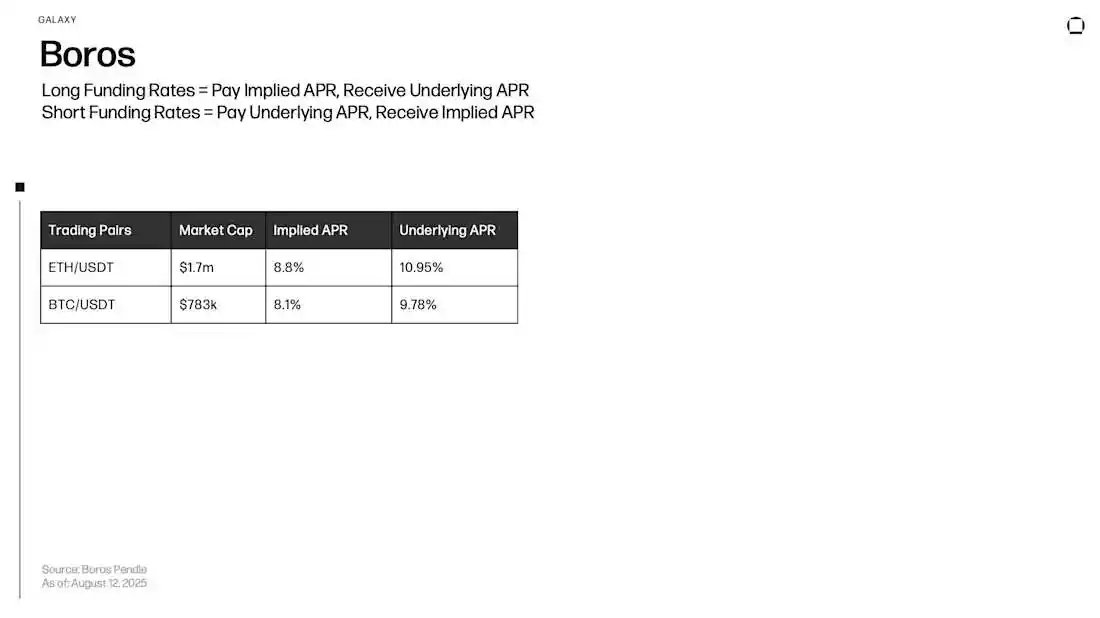
Boros is a platform within the Pendle ecosystem focused on automating specific types of yield strategies—leveraged cycling operations based on funding rate spreads for Principal Tokens (PT). Unlike users manually operating Pendle, Boros encapsulates the entire process into a simplified vault mechanism, allowing users to achieve amplified fixed yields without personally managing complex processes.
Overall, Boros's vault executes the following cycling operations:
Purchasing discounted Principal Tokens (such as PT-USDe or PT-sDAI) on Pendle, which can be redeemed at face value upon maturity;
Using the held PT as collateral, depositing it into lending platforms like Morpho or Aave;
Borrowing stablecoins (such as USDC or USDe) against the PT collateral;
Using the borrowed stablecoins to purchase PT again;
Repeating the above process to continuously compound exposure.
This cycle amplifies the returns of Pendle's fixed yield positions through capital reutilization, effectively constructing a leveraged exposure to fixed-income assets. The core of this strategy lies in the positive spread between the fixed yield implied by PT and the floating borrowing rates on lending platforms. As long as borrowing costs are lower than the implied yield of PT, this strategy can achieve net positive returns.
Boros automates the execution of the above cycle through smart contract vaults, managing collateral ratios, borrowing limits, and position health, so users do not need to manually monitor liquidation risks or rebalance. Vault parameters are preset and publicly auditable, allowing users to choose different risk levels and maturity structures based on their preferences.
By simplifying complex multi-step operations into a single deposit, Boros transforms advanced interest rate arbitrage strategies into immediately deployable DeFi tools, enabling users to capture structured yields using fixed-income tools within the Pendle ecosystem more capital-efficiently.
Where Does the Yield Come From?
In the Pendle protocol, stETH is split into two tokens:
YT-stETH (Yield Token): Current market price is approximately 0.04 stETH
PT-stETH (Principal Token): Current market price is approximately 0.96 stETH
Maturity Time: Approximately one year
Base Annual Yield (Lido Staking): Approximately 5%
Market Implied Annual Yield of PT: Approximately 4.2%
When a user purchases 1 YT-stETH, they acquire all staking yield rights for that stETH before maturity. If the staking rewards over the year amount to 0.05 stETH, and the user only paid 0.04 stETH to purchase YT, the net yield would be 0.01 stETH, resulting in an annual return rate of 25%, without the need for leverage or borrowing.
Yield Token (YT)
YT grants holders the right to all yields from the underlying asset, which in this case is the staking rewards from Lido's stETH. The yield equals the actual staking returns received minus the cost of purchasing YT. Since the trading price of YT is significantly lower than the principal value, even modest yields can result in high capital returns. Therefore, YT is often viewed as a "quasi-leverage" yield tool, but it does not involve borrowing or liquidation risks. If the actual yield exceeds the market-implied yield, YT positions will achieve excess returns.
Principal Token (PT)
PT represents the principal portion. Users purchase PT at a discount (e.g., 0.96 stETH) and redeem it at maturity for 1 stETH at face value. This discount represents the fixed yield. The behavior of PT is similar to that of zero-coupon bonds, with its price gradually approaching face value as the maturity date nears. The "fixed annual yield" displayed in the Pendle application is the yield to maturity. PT does not participate in staking rewards or incentive points, providing stable and predictable returns.
Trading Flexibility
In Pendle's automated market-making mechanism (AMM), both PT and YT can be freely traded before maturity:
YT: Can be sold at any time. A common strategy is to sell early when the yield portion has been realized or when market interest rates rise and prices increase, locking in profits.
PT: Can also be sold at any time. While holding until maturity allows for the full discount yield, PT can also be liquidated early when market interest rates decline or when demand for fixed yields increases, leading to a rise in PT prices.
Boros' Yield Mechanism
Boros generates structured yields by automating the execution of cyclical strategies based on Pendle's Principal Token (PT), utilizing the spread between PT's fixed yield and the borrowing cost of stablecoins.
The specific process is as follows:
Fixed Yield Source: The Boros vault first purchases Pendle's Principal Tokens (e.g., PT-USDe or PT-sDAI), which are typically traded at a discount and can be redeemed at face value upon maturity.
Leverage Operation: Boros uses PT as collateral to borrow stablecoins (e.g., USDC or USDe) on platforms like Morpho or Aave, then uses the borrowed funds to purchase more PT, expanding the position size. This cycle can be executed multiple times within risk thresholds, thereby amplifying the returns on the original capital.
Spread Yield: The core yield of this strategy comes from the spread between PT's fixed yield and the floating interest rates on lending platforms. The net yield is approximately the annual yield of PT minus the borrowing rate and associated fees and slippage. The vault operates within risk limits, with the final yield being approximately the net spread multiplied by the leverage factor. The larger the spread, the higher the return; if the borrowing rate exceeds the yield of PT, the strategy may turn negative.
Cycle Efficiency: Refers to the exposure size that can be achieved per unit of capital after deducting slippage, fees, and collateral ratio limits. The higher the efficiency, the more cycles can be executed, and the greater the leverage factor; conversely, lower efficiency limits the amplification effect.
Incentive Layer Optional: Some vaults may layer Pendle's incentive mechanisms (e.g., PENDLE distribution or LP rewards) to further enhance yields. Although these incentives are not guaranteed, they can significantly increase net annual returns under specific market conditions.
By automating cycles and managing through smart contracts, Boros transforms complex fixed yield arbitrage strategies into one-click DeFi vaults, enabling users to obtain structured, leveraged yields in a more capital-efficient manner under on-chain logic guarantees.
Risks and Key Points
Yield Spread Risk (YT)
If the market price of the Yield Token (YT) implies an annual yield higher than the actual yield of the underlying staked asset, the trade may not achieve the expected return unless market conditions improve. Even if the implied yield at the initial purchase is lower than the actual yield, future staking annual returns may still decline below the expected level at the time of purchase.
Time Effect on YT Price
As Pendle tokens approach maturity, the price of YT typically trends downward, as its value is only the remaining unpaid yield unless there is a significant change in the yield of the underlying asset.
Interest Rate and Market Value Volatility (PT)
The market price of the Principal Token (PT) fluctuates with interest rate expectations. If sold before maturity, the actual return may be higher or lower than the originally expected fixed yield; however, holding until maturity allows for redemption at face value.
No Liquidation ≠ No Risk
The "quasi-leverage" characteristic of YT stems from its pricing mechanism rather than borrowing behavior, thus there is no liquidation or oracle risk. However, the ultimate return still depends on whether future yields are realized.
Pendle Yield Curve: Inverted Structure
The yield of short-term maturity tokens is higher than that of long-term tokens. This phenomenon is typically driven by the following factors:
Upcoming PTs are usually traded at deeper discounts.
Market demand is concentrated on short-term trades.
Investors may price in uncertainty or volatility in the long-term market.
Traditional Treasury Yield Curve: Normal Structure
Long-term bonds typically offer higher yields to compensate for time and inflation risks. This is a common structure in traditional interest rate markets (e.g., U.S. Treasuries).
In traditional finance, yields reference the U.S. Treasury's fixed-term series (e.g., 1-month, 3-month, 6-month Treasury bills, and 1-year, 2-year, 5-year Treasury bonds).
Euler V2
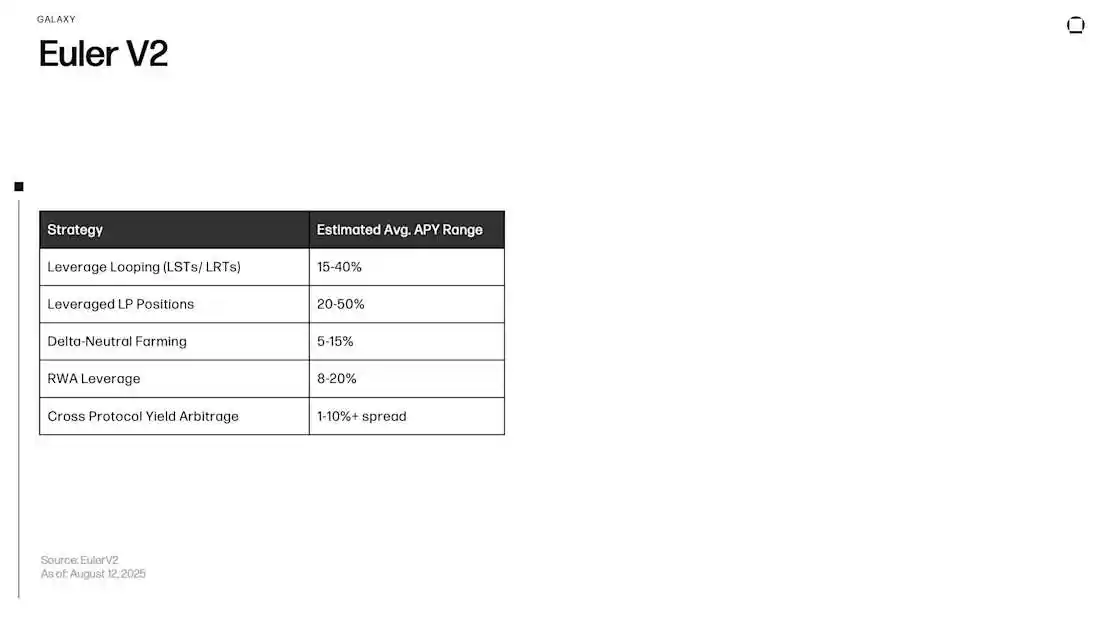
The Euler v2 protocol provides users with fundamental yield opportunities through its decentralized lending market. Users can deposit assets into independent vaults that comply with the ERC-4626 standard to earn interest or use them as collateral to borrow other tokens, with customizable interest rates. However, the platform's core innovation lies in its "Managed Strategy Vaults." These vaults are typically dynamically adjusted by risk curators to achieve optimal risk management, automatically executing complex DeFi operations, allowing users to deploy funds into structured products with minimal manual intervention.
By tokenizing strategies into transferable shares, Euler v2 transforms passive lending into actively managed positions, enhancing the overall composability of the ecosystem.
Strategy One: Leveraged Cycling Operations for LST and LRT
What is it?
This strategy is a recursive lending mechanism designed to amplify exposure to yield-generating tokens. Users deposit LST (liquid staking tokens) or LRT (liquidity re-staking tokens) into the vault. The vault then uses the asset as collateral to borrow related assets (usually WETH), which are then exchanged for more original LST/LRT and re-deposited into the vault. This process is known as "cycling" or "folding," achieving leverage through repeated operations, thereby amplifying the user's base yield.
Involved Assets
Key assets include high-quality LSTs (e.g., wstETH) and LRTs (e.g., eETH), with borrowed assets typically being WETH.
Yield Source
The yield from this strategy comes from two channels: the staking or re-staking annual yield of LST/LRT itself, and the supply annual yield paid by the Euler vault for the deposited assets. As positions are leveraged, both staking/re-staking yields and supply yields accumulate at a larger nominal amount, enhancing overall returns.
Strategy Two: Leveraged LP (Liquidity Provider) Positions
What is it?
This strategy allows liquidity providers (LPs) to earn yields while holding LP tokens and to leverage these tokens. Users deposit LP tokens from automated market makers (e.g., Uniswap) into the Euler vault. The vault uses these tokens as collateral to borrow one of the underlying assets in the trading pair. The borrowed assets can be used to purchase more LP tokens or free up funds for other uses, all without selling the original LP tokens.
Involved Assets
Collateral assets are LP tokens (e.g., WETH/USDC LP), and borrowed assets are the underlying tokens in the trading pair (e.g., WETH or USDC).
Yield Source
The primary yield comes from the base returns of the LP position, specifically the trading fees generated in the AMM pool. Through leveraging, users can amplify their exposure to these fees. Additionally, users can earn the supply annual yield (APY) paid by the Euler platform for providing LP tokens as collateral.
Strategy Three: Directionless Yield Strategy (Delta-Neutral Farming)
What is it?
This is an advanced strategy aimed at generating yields while minimizing the risk of asset price volatility. Users deposit stablecoins (e.g., USDC) as collateral into the vault, which then borrows volatile assets (e.g., ETH) and immediately exchanges them for more stablecoins. This creates a "Delta-neutral" position, with the user's yield coming from the interest rate spread rather than price movements of the volatile assets.
Involved Assets
Stablecoins (USDC, DAI) serve as collateral, while volatile assets (ETH, WBTC) are the borrowed assets.
Yield Source
The yield comes entirely from the net interest rate spread. Users earn supply yields on the stablecoin collateral while paying the borrowing costs of the volatile assets. As long as the yield on stablecoins exceeds the borrowing costs, this strategy will yield positive returns.
Strategy Four: Cross-Protocol Yield Arbitrage
What is it?
This is an opportunistic strategy that exploits interest rate differences between different DeFi protocols for arbitrage. The Euler vault can be programmed to borrow assets at relatively low rates on Euler and then deposit those assets into other protocols (e.g., Pendle, Yearn, or emerging incentive-based funding markets) to earn higher annual yields. This is a form of on-chain "spread trading" strategy.
Involved Assets
Assets used for arbitrage are typically stablecoins or WETH, as they have deep liquidity in the DeFi ecosystem.
Yield Source
The yield comes directly from the interest rate spread between the two protocols, specifically the APY earned on the external protocol minus the borrowing costs on Euler. Such yields are highly volatile and depend on short-term market imbalances and incentive mechanisms.
Risk Warnings and Key Points
Improvements and Risk Considerations in Euler v2
Although Euler v2 introduces a modular lending architecture and key risk management mechanisms, there are still a series of risk factors affecting asset suppliers and borrowers:
Euler v1 Attack Incident
In March 2023, Euler Finance v1 was attacked, resulting in the theft of approximately $190 million in crypto assets (including DAI, wBTC, stETH, and USDC). The attacker manipulated the liquidation process through a flash loan operation, exploiting inadequately checked functions in the protocol. Although most of the funds were recovered in subsequent investigations and negotiations, the incident exposed potential vulnerabilities in collateral integrity, liquidation logic, and flash loan attacks, reminding us that even audited protocols may have complex logical flaws, especially when combining leverage mechanisms and automated financial operations.
Interest Rate Volatility Risk
Euler adopts a utilization-based interest rate model (IRM), where the supply yield fluctuates with borrowing demand. When utilization is low, yields may approach zero; conversely, at high utilization, while returns may rise, they may also reflect liquidity tightness. Interest rate changes can occur rapidly, especially in vaults employing dynamic IRM.
Liquidity Constraints
Users can only withdraw assets when there is idle liquidity in the vault. In high utilization scenarios, it may not be possible to exit positions immediately, requiring a wait for borrowers to repay or for new funds to enter. This risk is particularly pronounced in assets with significant market volatility or a narrow borrower base.
Underlying Asset Risk Exposure
When users provide assets to the vault, they must bear the price risk of those assets. If a token becomes unpegged, is attacked, or performs poorly due to strategy failure, its value will decline. Some vaults utilize yield-bearing assets (such as sDAI or wstETH), which can enhance returns but also introduce protocol-specific risks.
Sustainability of Rewards Risk
Some markets display high APYs due to external incentives (on-chain reward streams or point distributions from platforms like Merkl). These incentives are temporary and uncertain; once they cease, actual yields may drop significantly, catching users who entered based on high yield expectations off guard.
Vault Governance Risk
Each vault is managed by a specific governance entity, which can adjust reserve factors, interest rate curves, caps, and collateral parameters. These changes will affect interest calculations and the risk level of the vault. Asset suppliers must trust the rationality and transparency of the governance entity's decisions, but this is not an absolute guarantee.
Smart Contract Risk
Euler v2 has been restructured and audited following the v1 attack incident, but it remains a complex system that includes custom interest rate models, governance controls, and token integrations. Vulnerabilities in core contracts or interest rate calculation logic could still lead to fund losses or risk misjudgments. While smart contract risks can be mitigated, they cannot be completely eliminated.
Oracle and Pricing Dependencies
Euler relies on external oracles (such as Chainlink or Pyth) for pricing collateral and borrowing assets. If an oracle fails, experiences delays, or is manipulated, it could lead to incorrect interest rate adjustments, distorted asset pricing, or even trigger systemic vault halts. Although oracle infrastructure has been widely validated, it remains a critical dependency.
Protocol Governance and Systemic Risk
The Euler protocol is managed by the Euler DAO, which can authorize upgrades, pause mechanisms, or adjust vault policies. If the DAO's operations stagnate or are manipulated, it will affect the protocol's responsiveness and security mechanisms. Additionally, Euler v2 inherits systemic risks from the Ethereum ecosystem.
Activity-Generated Yield
Liquidity Providers
Liquidity providing (LPing) refers to users proportionally depositing two types of tokens into a decentralized exchange (DEX) liquidity pool, providing traders with a path for exchange. In return, users receive a portion of the trading fees collected by that liquidity pool. Unlike lending, LP does not involve borrowers; their assets are stored in automated market maker (AMM) contracts, which are responsible for pricing and executing trades. For example, to provide liquidity in the wETH/USDC pool on Uniswap v3, users must deposit wETH and USDC in equivalent value.
Understanding the Mechanism of LPing
What is AMM?
In traditional exchanges or order book systems, users submit orders that are matched by counterparties. The counterparties are typically market makers who provide quotes, bear inventory risk, and profit through bid-ask spreads and exchange rebates. Prices are determined by the active quotes and matching of buyers and sellers, with trades executed only when someone is willing to accept your price.
In contrast, in an AMM, the counterparty is a pool of tokens hosted by a smart contract. The contract calculates prices based on the token balances in the pool using a formula, always providing quotes. Users trade with the liquidity pool rather than with a specific institutional counterparty. Anyone can deposit tokens into the pool and proportionally share the trading fees paid by traders. The price in the pool adjusts as balances change, and arbitrage mechanisms help keep prices aligned with external markets.
A simple analogy: the order book is a "market" for buyers and sellers, while the AMM is an "automatic vending machine" for asset pairs. The vending machine prices based on the remaining goods on the shelf, and trading fees are distributed to liquidity providers who "restock" the machine.
Why Are There Different Trading Pairs and Liquidity Pools?
If the AMM is an automatic vending machine for assets, then "what's on the shelf" is key. AMMs are organized by trading pairs, each containing two assets, such as wETH/USDC or USDC/USDT. The existence of trading pairs is to meet users' needs for direct exchanges between specific assets.
Highly correlated assets (like stablecoins) are suitable for low-slippage formulas and low fees; while more volatile assets require more flexible pricing mechanisms, often accompanied by higher fees. Within the same trading pair, there may be multiple liquidity pools with different fee rates, allowing traders and LPs to choose the most suitable economic model based on market conditions.
Uniswap v3's Liquidity Pools and Fee Tiers
Each trading pair in Uniswap v3 has multiple liquidity pools corresponding to different fee tiers. For example, the wETH/USDC trading pair is most active in the 0.05% and 0.30% fee pools. Liquidity between pools with different fee tiers does not share, so LP earnings depend on the chosen fee tier and the price range set.
How to Choose Fee Tiers and Their Trade-offs
0.05% Pool: Suitable for low-volatility, narrow-spread markets. This pool typically has high trading volume, especially when gas costs are lower on L2 networks, allowing LPs to earn many small fees. The downside is that each trade incurs a lower fee, requiring reliance on sustained trading volume to cover inventory risks and management costs.
0.30% Pool: Suitable for high-volatility or wide-spread markets, or when the 0.05% pool is too crowded and LPs hold a smaller share. Each trade incurs a higher fee, helping to offset inventory risk. However, trading volume is usually lower, leading to greater volatility in fee income and stronger path dependence.
Price Range and Tick Mechanism
Uniswap v3 divides prices into small units called Ticks. After selecting a trading pair and fee tier, LPs must set the price range in which their liquidity will be effective. The upper and lower limits must fall on multiples of Ticks, and LPs can only earn fees when the market price is within that range.
As trades push prices to move within the Tick range, LPs' assets convert between the two tokens, and fees are distributed to LPs within the current Tick range.
Narrow Range: High fee density when within the range, but requires frequent monitoring; if prices deviate, fees may not be earned.
Wide Range: Lower fees earned per unit of capital, but longer time spent within the range, resulting in lower maintenance costs.
Out of Range: Assets held by LPs will concentrate in one token, and no fees will be earned unless the range is readjusted or market prices return.
Providing Liquidity to AMM Pools and Choosing Fee Tiers
Once you have selected the trading pair, the fee tier of the liquidity pool, and the price range in which your liquidity will be effective, you need to deposit two tokens in equivalent amounts. The smart contract will mint a non-fungible token (NFT) representing your share of the position and the fees earned.
As long as the market price fluctuates within your set range, you will continuously earn fee income, and the liquidity pool will automatically adjust your holdings between wETH and USDC. If the price exceeds your set range, you will stop earning fees until you readjust the range or the market price returns to your Tick range. You can exit at any time by removing liquidity and claiming any unpaid fees.
Summary of the Operational Process:
Choose the liquidity pool and fee tier: In Uniswap v3, the wETH/USDC trading pair is most active in the 0.05% and 0.30% fee tiers. Higher fee pools incur more fees per trade, but trading volume may be lower; lower fee pools typically have higher trading volumes.
Set the price range: For example, when the ETH price is $3,200, you can set a range of $2,800 to $3,600. A narrow range yields higher returns when effective but is more prone to failure; a wide range has lower yield density but remains active longer.
Deposit equivalent tokens according to the range: The contract will mint an NFT representing your position.
Earn fees when trading within the range: Fees accumulate in the contract until you claim them.
When the price exceeds the range: You will primarily hold one of the assets and will no longer earn fees until:
A) You burn the NFT, claim the fees, and readjust the range;
B) The market price returns to your Tick range.
Exit at any time: Remove liquidity to retrieve tokens and any unpaid fees.
Impermanent Loss
In LP operations, a key concept to understand is "Impermanent Loss" (IL). We continue with the example of providing liquidity in wETH/USDC on Uniswap v3 to illustrate its mechanism and impact on returns.
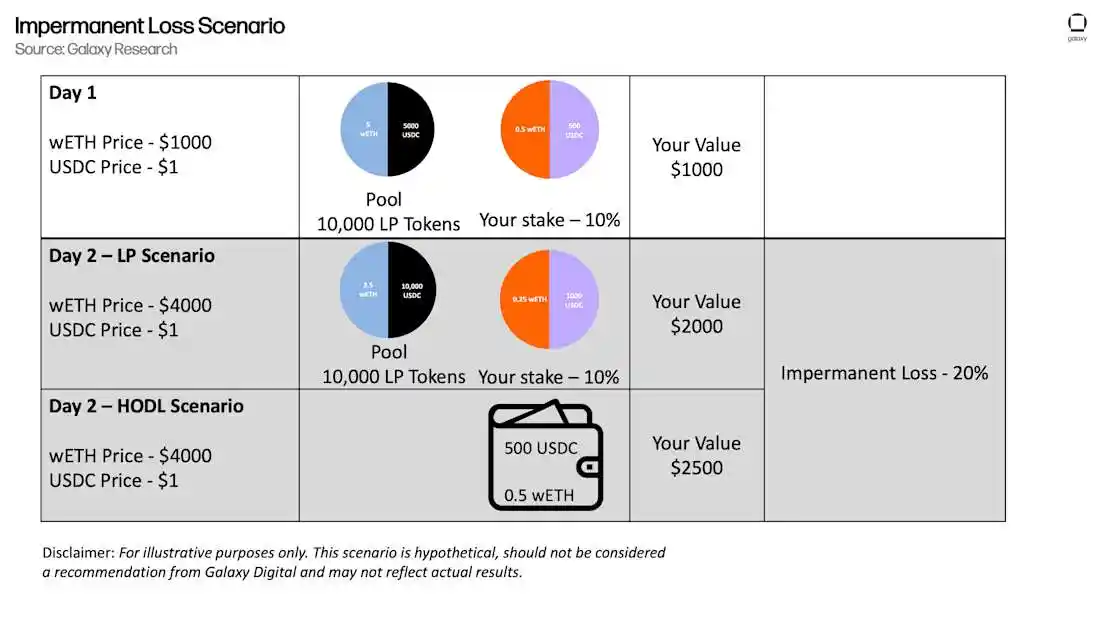
Impermanent Loss refers to the difference in value between your LP position and what it would have been worth if you had simply held the original tokens without participating in LP operations. The fees earned can partially or completely offset this difference.
How Does the Liquidity Pool Automatically Rebalance Your Position?
In a 50/50 pool like wETH/USDC, the AMM maintains prices through the exchange behavior of traders. When wETH rises, the contract sells some wETH for USDC; when wETH falls, it uses USDC to buy wETH. In Uniswap v3, this mechanism only operates when the market price is within your set Tick range; if the price exceeds the range, you will stop earning fees and primarily hold one asset until you adjust the range or the price returns.
When is Impermanent Loss Realized?
It is termed "impermanent" because it is only a paper loss; if the price returns to the level at which you entered LP, the loss will disappear. You will only truly realize IL when you close or adjust your position, such as burning LP tokens to exit or burning and re-minting to adjust the price range. Claiming fees does not realize IL; only when exiting or rebalancing does the current token composition of the liquidity pool become your actual position, thus realizing gains or losses.
LP Investment Choices
Concentrated Liquidity AMMs (like Uniswap v3)
This market-making mechanism allows users to choose a price range within which to provide liquidity. A narrower price range can yield higher fee density when effective, but requires more frequent monitoring and rebalancing. A wider range earns fewer fees per unit of capital but remains active longer, resulting in lower maintenance costs.
Stablecoin Exchange AMMs (such as Curve's stablecoin pools)
These pools focus on assets with prices close to their peg (like USDC/USDT), typically providing more stable fee income while incurring lower impermanent loss. Their returns are primarily driven by trading volume rather than price volatility.
Weighted and Multi-Asset Pools (such as Balancer)
These pools are more akin to asset portfolio exposure. Fee income will generate gains or losses based on trading volume and incentive mechanisms affecting the underlying asset allocation.
High-Throughput Chain Trading Venues (such as BNB Chain or Solana)
These platforms may have lower fees per transaction but higher trading volumes. Their economic model still depends on several core factors: whether prices are within the effective range, the proportion of active liquidity, market volatility, and incentive mechanisms.
Where Do Returns Come From?
Trading Fees (Swap Fees)
Each trade that crosses your set Tick range pays a fee to the liquidity pool, and you earn a proportional share of this fee only when the market price is within your set price range. In short, your fee income depends on the following factors:
The chosen fee tier (fee rate)
The trading volume occurring near your range
Your share of active liquidity within that range
If liquidity providers are overly concentrated in a certain range, your share will be diluted; while setting a narrower price range can increase fee density per unit of capital, it also makes it more susceptible to price deviations, increasing price risk. Additionally, gas costs and the operational costs of redeploying liquidity can erode actual returns, especially on the Ethereum mainnet.
It is important to note that the annual percentage yields (APY) displayed by many platforms are often based on short-term backtesting and may exhibit volatility; at the same time, trading volumes may migrate between different liquidity pools or chains. While fees are indeed an important source of LP income, they are inherently volatile and path-dependent, with final returns depending on whether trading flows cross your range and how much traffic you can capture.
Incentive Mechanisms and Why Many LPs Chase Them
Some platforms attract liquidity through additional token rewards. These incentive mechanisms can significantly boost the apparent annual percentage rate (APR), thereby attracting more capital inflow. However, these incentives are often temporary and may change at any time due to governance votes or budget adjustments. Once incentives decrease or cease, APY may drop sharply. If fee income itself is low, positions that initially appeared profitable due to incentives may turn into losses once the incentives end.
Incentive mechanisms can enhance LP returns for a period, but they are not a sustainable source of income. Therefore, it is advisable to always assess the underlying APY first, treating incentives as a short-term bonus and preparing for their potential disappearance.
LP income is not a fixed number. The actual returns for LPs result from the interplay of multiple factors, primarily including:
Fees captured within the effective liquidity range
Inventory changes due to price fluctuations (i.e., impermanent loss)
Management strategies and costs (such as redeployment frequency, gas expenditures, whether to hedge, etc.)
Any small change in these variables can turn a previously profitable position into a loss.
Is LPing Really Profitable?
Why Is It Difficult to Measure?
The actual return for LPs = Fee income − Inventory drift − Management costs, and these factors fluctuate with market conditions. The same LP position may appear profitable in the short term but turn into a loss in the long term, and vice versa. This depends on:
How much trading volume crosses your Tick range
The time you spend within the effective range
The price trends and volatility during your holding period
In stablecoin trading pairs, fee income is usually more stable, with lower impermanent loss. When trading volume is sufficient and the liquidity pool is not crowded, the results tend to be slightly positive. However, once gas costs, rebalancing frequency, and new liquidity dilution effects are considered, net returns may be compressed.
In blue-chip volatile trading pairs (like wETH/USDC), if the market is active and prices fluctuate around the range, it may perform well in the short term. However, as time extends or the market trends change, unhedged inventory drift often eats into fee income, leading to overall losses unless active management or hedging is performed.
Conditions that increase the probability of profitability include:
The underlying fee yield remains attractive without incentives
The set price range covers most market activity
Gas costs are low in the operational environment
Ability to respond promptly to changes in trading volume and volatility
Factors that decrease the probability of profitability include:
The liquidity pool is too crowded
Gas costs are high
The range is set too narrowly and not adjusted in time
Market prices trend unidirectionally for an extended period
Conclusion
LPing can be profitable, but it is not a "passive income tool." The outcome depends on whether trading volume crosses your range, how long you stay within the range, the price path, and operational costs. Small changes in these variables or differences in how returns are calculated can shift results from positive to negative.
Additional Risks
Toxic Order Flow
When real market prices change on external platforms, fast traders or bots may preemptively trade in your liquidity pool before the price updates. They buy from you immediately after prices rise and sell back to you immediately after prices fall, causing you to "sell low and buy high." While fees can partially mitigate losses, in high-volatility or thin liquidity pools, a few information-advantaged traders may dominate the market, and fees are often insufficient to cover costs. If there are many routine, non-information-based trades in the liquidity pool, this risk is lower, allowing LPs to earn fees without bearing the worst counterparty risk.
Liquidity Pool and Fee Tier Selection
Some trading pairs have stable daily trading flows, while others experience low trading volumes and high volatility. If the fee tier does not match the volatility or typical trade size of the trading pair, it may lead to low fee income or even almost no trading volume.
Price Path and Market State
The performance of LPs depends not only on the starting and ending prices of the position but also on the market trends during the holding period. If the market is stable and prices fluctuate within the range, it is usually favorable for LPs; however, if the market trends unidirectionally, the liquidity pool will continuously rebalance in the direction of the trend, potentially causing LPs to incur losses.
Narrow Range Close to the Current Price
An extremely narrow price range behaves similarly to a limit order. When prices quickly cross your range, the fees collected are often insufficient to cover losses, especially when considering slippage and non-ideal entry prices.
Instant Liquidity and MEV (Maximum Extractable Value)
Attempting to provide liquidity only when large trades occur is not easy. Faster bots and MEV operations (profiting by reordering or inserting trades) may seize the advantage, resulting in worse execution prices and higher gas costs for you.
Hedging and Yield Structure Risks
Opening an LP position is essentially similar to selling insurance against significant price fluctuations. Hedging operations themselves incur costs, may lag in fast markets, and can still lead to substantial losses during sudden market movements.
Yield Measurement and Benchmark Risks
LP performance may reverse depending on the evaluation method. For example, profits measured in dollars may obscure the actual losses of the tokens you deposited; on-chain data may not reflect off-chain hedges or other contextual information. Therefore, yield assessments should be approached with caution to avoid misjudgment.
Yield Farming and Incentive-Based Liquidity Pools
Yield farming refers to the process of staking the LP tokens you earn from providing liquidity into a reward contract to earn additional tokens. Incentive-based liquidity pools are those that attract liquidity by distributing extra rewards.
Example: Participating in CRV Yield Farming with DAI on Curve
Deposit DAI into Curve's DAI liquidity pool to earn trading fees.
Receive LP tokens for that liquidity pool.
Stake the LP tokens in Curve's reward pool to earn CRV incentives while continuing to earn fees.
Claim CRV at any time and decide how to handle it: sell, hold, lock for bonuses, or deploy to other protocols (like lending platforms).
Where Do Returns Come From?
Trading Fees: Each trade incurs a fee. As long as your liquidity is active in the pool, you will earn a proportional share of this income.
CRV Distribution: The incentive mechanism of the liquidity pool distributes CRV to staked LP tokens. The amount of rewards depends on the pool's weight, distribution rate, and your bonus situation.
Optional Bonuses and Locking Mechanisms: Locking CRV as veCRV can enhance rewards. Staking through Convex can yield enhanced CRV and potentially additional CVX or incentives from partner protocols.
Net returns depend on costs and risks: Apparent APY does not account for impermanent loss, time spent out of range, gas costs, or price fluctuations of reward tokens. Incentive distributions and the total value locked (TVL) in the liquidity pool will change over time, affecting actual returns.
You can also participate through optimizers (like Convex). Convex will stake LP tokens on your behalf, passing on CRV and other token rewards, applying bonuses to enhance your incentive share, and automatically reinvesting at set intervals. If gas costs are reasonable and platform fees are moderate, this method can improve net returns.
Conservative Yield Estimate Explanation
Note: The following annual percentage yield (APY) data is based on the trading fees and incentive distributions over the past 30 days, excluding impermanent loss, time spent out of range, gas costs, or rebalancing fees, and therefore does not represent a complete profit and loss assessment. These APYs are rolling snapshots and will fluctuate with changes in trading volume, liquidity, and incentive programs. We separate the underlying fee APY from the incentive APY where possible and indicate the snapshot date.
For Curve LP tokens wrapped through Convex, conservative annual yield benchmarks across different types of liquidity pools range from 2% to 10%, depending on the incentive mechanisms and market conditions.
Stablecoin Liquidity Pools (via Convex)
Fee income alone typically yields low single digits; if CRV and CVX incentives are active, the conservative range is 2% to 6% APY:
FRAX/sDAI: January 2025 APY is 3%, with base yield at 0.7% and incentive yield at 2.3%
PYUSD/crvUSD: July 2025 APY is approximately 10.2%, primarily driven by incentives
Blue-Chip Mixed Asset Pools (via Convex)
Yield volatility is higher, relying on incentive programs, with a conservative range of 4% to 10% APY:
Convex TriCryptoFRAX: Previous snapshots showed a 30-day APY of 5.8%, with incentives as the main driver
LST or ETH Trading Pairs (via Convex)
In stable markets, APY typically ranges from 2% to 4%, with fees and incentives each accounting for half:
stETH/frxETH: August 8, 2025 APY ranges from 2.6% to 3.4%, with base and incentive yields nearly evenly split.
Governance Tokens and Curve Ecosystem Trading Pairs
If incentives are concentrated, returns may be slightly higher, and risk appetite correspondingly increases:
CRV/cvxCRV: May 2025 APY is 9.8%, primarily driven by incentives.
Risks
Even stablecoin liquidity pools still face anchoring risks and smart contract risks. Incentive mechanisms may be adjusted due to governance changes; for example, the issuance rate of CRV may decrease, leading to a decline in your annual percentage rate (APR).
If you choose a volatile asset trading pair instead of a stablecoin pool, you will introduce impermanent loss risk. During periods of significant price volatility, such losses may exceed the fees and incentive income you earn, resulting in an overall loss of strategy.
Insights
TVL (Total Value Locked) by Category
DeFi has evolved from its initial decentralized exchanges (DEX) and yield farms into an on-chain economy of "yield stacking." The chart above shows that TVL is expanding from a single structure to a diversified one: liquid staking has become a major source of on-chain capital, while lending markets fluctuate with market cycles, and DEXs remain stable as infrastructure. Meanwhile, emerging areas such as re-staking, LRT (liquidity re-staking tokens), and RWA (real-world assets) are rapidly growing from a smaller base.
Unlike the incentive-driven TVL surge from 2020 to 2022, today's TVL is more diversified and sustainable, with its growth foundation increasingly supported by the income generated by the protocols themselves.
The growth of DeFi is not driven by a single narrative but is the result of multiple engines operating in parallel. As the interest rate environment and L2 adoption evolve, TVL continuously rotates between different sectors—from RWA driven by base interest rates to protocol security staking, and to trading volume-driven DEXs and lending markets—each asset class has its unique mechanisms and risk characteristics.
The Crossroads of Yield: Banks and Blockchain
After outlining the complete path of on-chain yield, we should also pay attention to its spillover effects on traditional markets, banks, money markets, and other off-chain yield tools.
On-chain stablecoins and cash-like assets that generate yield are increasingly intertwined with traditional money markets: stablecoin reserves are being invested in government bonds and repurchase agreements, while tokenized cash competes with bank deposits and retail money market funds for the same pool of short-term dollar funds. If this "parallel money market" continues to expand, capital may migrate, reshaping short-term financing structures, collateral liquidity paths, and interest rate transmission mechanisms. In many developing economies, these assets may even become a means of daily savings and payments, siphoning deposits from local banks and affecting exchange rates.
GENIUS Act: The Regulatory Boundaries of On-Chain Yield
The rise of on-chain yield raises a fundamental question: will it impact the yields of traditional bank savings accounts?
The U.S. GENIUS Act, signed into law by President Trump in July, aims to maintain the "monetary attributes" of payment stablecoins and prevent them from evolving into savings products. The act stipulates that regulated stablecoin issuers cannot pay holders any form of yield or interest, preventing them from being seen as substitutes for bank deposits.
However, the collaboration model between USDC issuer Circle and Coinbase cleverly circumvents this restriction. Circle does not directly pay yields to USDC holders but allocates part of the reserve income to Coinbase, which then distributes USDC rewards to users. Economically, users receive yields; legally, the payer is Coinbase, not the issuer. Since both parties publicly define this model as "revenue sharing," it does not violate the provision that issuers cannot pay interest.
The question is whether other issuers will follow suit and seek ways to bypass the GENIUS Act?
The Bank Policy Institute opposes this, arguing that indirectly paying yields to users through partners contradicts the legislative intent. The institute calls on Congress and regulators to close this "indirect interest payment" loophole and prohibit interest payments through affiliates or agents.
Currently, U.S. policy trends toward prohibiting stablecoin issuers from paying interest to prevent confusion with bank deposits. However, the revenue-sharing mechanism remains a real channel for on-chain yields to flow to retail users. Whether it continues in the future will depend on how the final rules define "interest payments" and whether intermediaries are considered part of the issuer.
In an assessment in April, the U.S. Treasury noted that allowing stablecoins to pay interest could siphon up to $6.6 trillion in bank deposits, depending on the scope of yield coverage. This prediction indicates that on-chain yields pose a real funding risk to banks: large-scale capital outflows would weaken banks' low-cost deposit bases, forcing them to rely on more expensive wholesale financing channels, ultimately tightening credit and raising borrowing costs for households and businesses.
For users, the logic is quite the opposite: if on-chain products can transmit government bond yields or DeFi rewards, they will become a strong alternative to traditional bank savings accounts.
Policymakers are weighing the pros and cons: yield-bearing stablecoins may siphon bank deposits and alter the structure of money markets, but they may also increase demand for government bonds, becoming a new channel for global capital allocation.
Rising Demand for Stablecoins in High-Inflation Countries
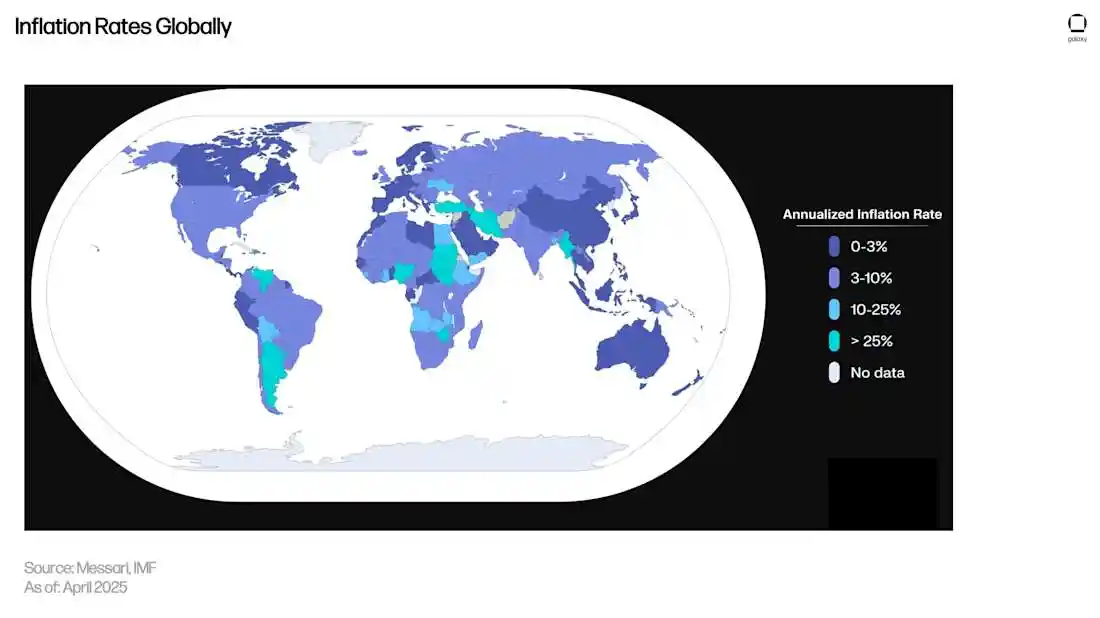
As on-chain finance continues to mature, yield-bearing stablecoins and tokenized cash accounts are providing savers with reasons to transfer funds from the traditional financial system to "programmable dollars." In regions where banking services are limited or unstable, capital flows to more practical channels: on-chain assets offer around-the-clock settlement capabilities and are expected to yield some returns, making them a realistic choice for daily fund management.
In many parts of the world, inflation has become a daily reality. In dozens of countries where annual inflation rates reach double digits or exceed 25%, households are shifting their local currency assets to stablecoins pegged to the dollar as a practical hedge against currency depreciation. Through mobile wallets and peer-to-peer payment networks, users can transfer funds around the clock, bypassing capital controls and holding a unit of account that behaves similarly to the dollar without relying on bank accounts.
In high-inflation environments, stablecoins are gradually evolving into "working currencies"—widely used for savings, invoicing, cross-border remittances, and international trade. Their advantage lies in combining a familiar dollar-denominated system with almost instantaneous settlement capabilities globally, providing users with a financial alternative that offers both stability and liquidity.
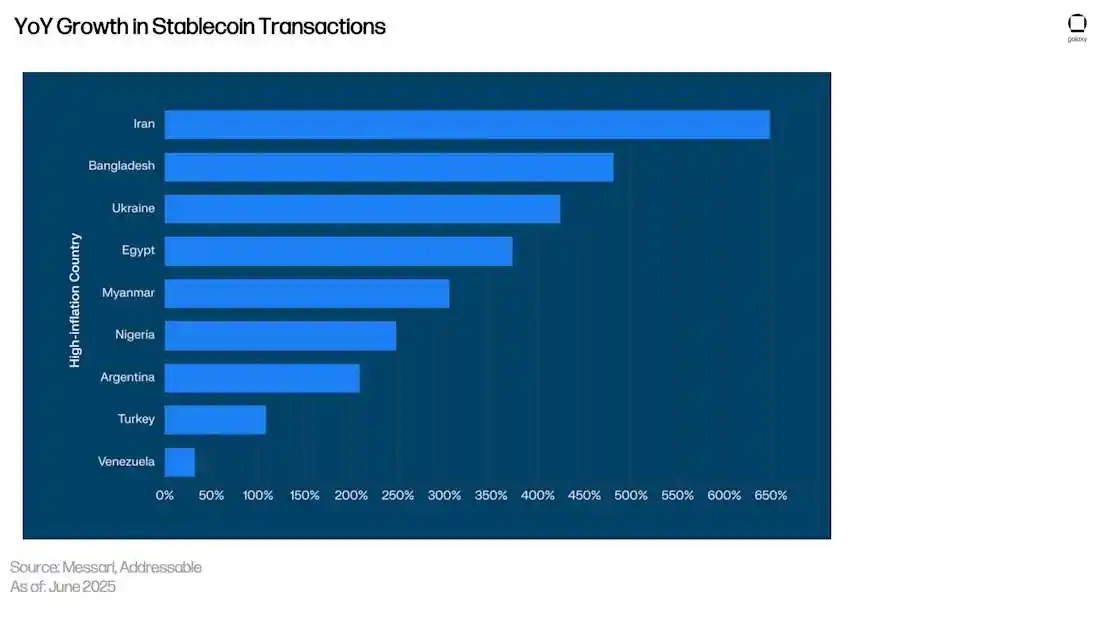
This capital migration is not without risks. Users still face issuer or custodian risks, the possibility of account freezes, and difficulties in cashing out when inflow/outflow channels are restricted. However, the appeal remains strong: predictable purchasing power and disposability far outweigh the rapidly depreciating local currency.
As on-chain payment infrastructure expands and compliance-friendly wallets continue to improve, the adoption rate of stablecoins is expected to rise in the most vulnerable areas of the monetary system. For many, stablecoins are not speculative tools but survival tools.
The chart above shows the market capitalization of USDT categorized by holder type:
Service Addresses: Typically wallets of exchanges or other merchants/fintech companies, identified by on-chain analytics firm Chainalysis.
Saver Addresses: On average, hold more than 2/3 of the USDT they receive.
Sender Addresses: On average, hold less than 2/3, typically used for quick transfers or payments.
In the tracked networks (including Ethereum, TRON, BSC, Solana, Avalanche, TON, Polygon, Arbitrum, Celo, Optimism, Kaia), the market capitalization of USDT held by savers has surpassed that of service and sender addresses, indicating that stablecoins are shifting from short-term payment tools to long-term value storage tools. This trend aligns with users in high-inflation countries using stablecoins as a hedge against local currency depreciation.
If the proportion of savers continues to rise, funds may migrate from bank deposits and overseas retail money market funds to on-chain cash tools, forcing banks and funds to intensify competition in terms of interest rates and liquidity.
Once scaled, stablecoin reserves and tokenized cash accounts may directly purchase government bonds and repurchase agreements, thereby diverting demand from traditional money markets, leading to fragmentation of the global money market and quietly altering the transmission mechanism of policy rates in cross-border markets.
Key Points
Market Overview
Current on-chain yields primarily come from two major categories of scenarios:
Off-chain cash tools: Such as high-yield savings accounts, money market funds, and government bonds, these tools transmit yields through policy rates and have broad distribution channels and deep liquidity. They constitute the "benchmark rate" for on-chain yields, providing reference points for on-chain products.
On-chain financial tools: Built on this foundation, they incorporate protocol mechanisms and market microstructures, including yield-generating or stakable stablecoins, lending pools, funding rates and basis strategies, AMM trading fees, protocol staking and re-staking mechanisms, as well as structured products that package or leverage these cash flows.
As more market behaviors or cross-protocol combinations are introduced into the design, the volatility of yields and associated risks also increase. The evolution from "cash+" strategies to "activity-driven" and "structured" strategies implies higher yield potential but also comes with greater risks, monitoring demands, and operational complexity.
Stablecoin Risk Assessment Framework
Stablecoins exhibit significant differences in asset backing, governance structures, and redemption mechanisms, and their apparent similarities may mask entirely different tail risks.
The framework below scores stablecoins across multiple dimensions, covering risk points that could lead to value loss or asset inaccessibility, and integrates these dimensions into a concise total score for easier horizontal comparison. These scores are not ratings or investment advice but rather information summaries to help readers identify which risks are most prominent in specific use cases and calculate risk-adjusted returns accordingly.
(For a more detailed DeFi risk assessment methodology, we recommend reading "A Risk Rating Framework for DeFi and Crypto Investors" by Thaddeus Pinakiewicz from Galaxy Research.)
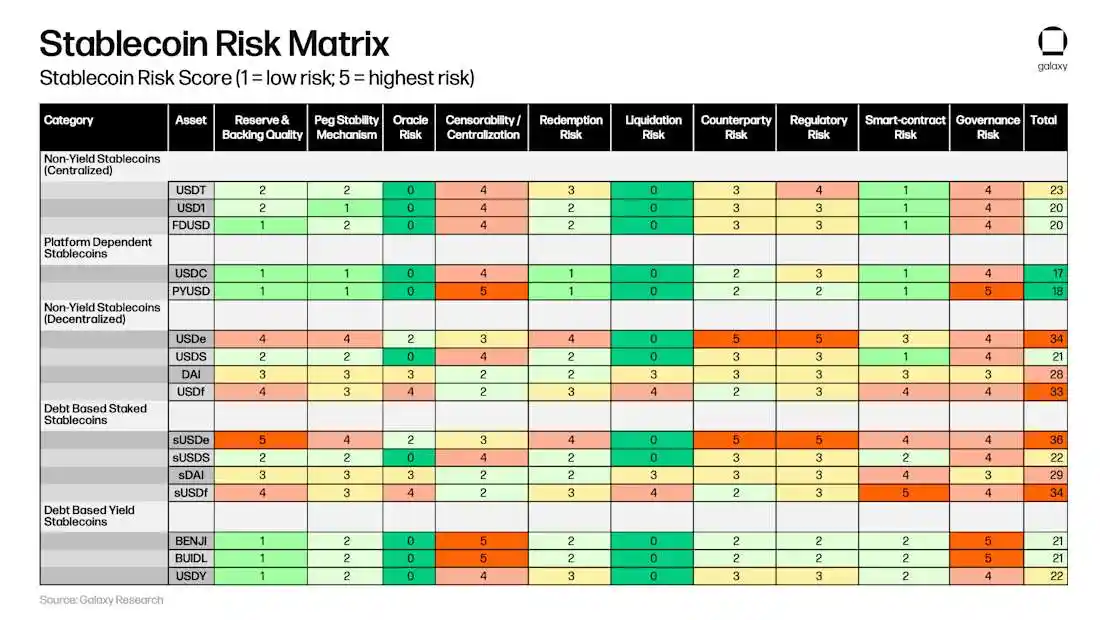
Categories of Stablecoin Risks
Reserve/Collateral Quality: Refers to the quality, liquidity, and transparency of the collateral assets, as well as whether there is genuine over-collateralization or redundant reserves.
Peg Stability Mechanism: Measures the likelihood of the token deviating from its $1 value on historical and structural levels.
Oracle Risk: Refers to the reliance on external price data and the risk of collateral mispricing due to oracle errors.
Auditability/Centralization Level: Whether the issuer or contract administrator has the ability to freeze, blacklist, or halt specific transfers. Regulated issuers typically need to retain such powers to maintain compliance, but this also means that holders face the risk of unilateral asset freezes or transaction scrutiny.
Redemption Mechanism: Refers to the convenience, speed, and related conditions for holders to exchange tokens for dollars (or underlying assets), including whether there are identity verification thresholds, minimum redemption amounts, fees, or cooling-off periods that may affect timely exits.
Liquidation Risk: Under market pressure, forced sales or on-chain liquidations may trigger the probability of a chain reaction.
Counterparty Risk: The stability and fragility of the token entry and exit channels (such as trading platforms or payment channels) that users rely on.
Regulatory Risk: Involves the clarity, strictness, and jurisdiction of the legal framework surrounding issuance and reserves.
Smart Contract Risk: Includes the technical security of the contract code, audit status, upgrade control mechanisms, and the settings for pause or blacklist functions.
Governance Mechanism: Involves the concentration of decision-making power and accountability mechanisms regarding upgrades, parameter adjustments, reserve management, and emergency operations, including key management, voting thresholds, and transparency.
Risk-Adjusted Returns
Risk-adjusted returns measure the relationship between the yield of a token and the risk that investors take to obtain that yield. Here, we take the 30-day annualized yield (APY) for each stablecoin, divide it by the corresponding total risk score from the matrix above, and finally convert the result into basis points (bps) of return per risk point.
For example: If a stablecoin's result is 18 bps, it means that for every 1 point of risk taken in the matrix, it can yield 0.18 percentage points of annualized return.
The higher the value, the more efficient the "return per unit of risk"; the lower the value, the more it indicates that investors are not receiving a commensurate return for taking on significant risk.
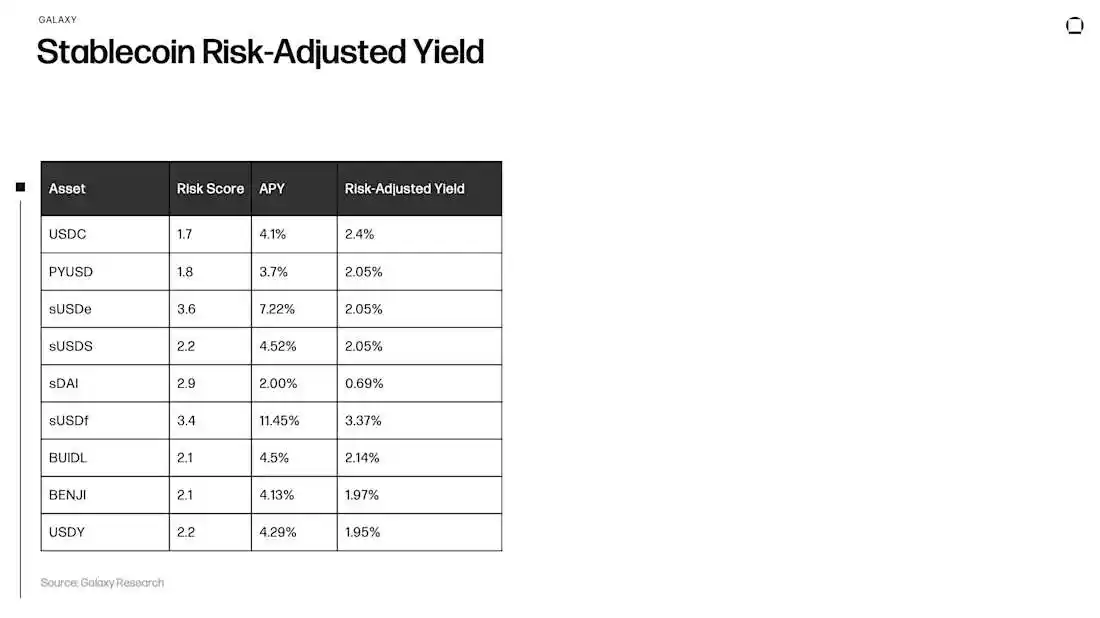
The above chart compares nominal annualized yield (APY) with risk-adjusted returns, where the latter discounts higher-risk assets.
In centralized cash-like stablecoins, such as USDC and BUIDL, risk-adjusted returns mostly cluster in the 2%–2.5% range, reflecting a moderate risk level based on stable reserve income. PYUSD is also in the same range.
Decentralized yield-bearing stablecoins show greater variation. sUSDf maintains around 3.4% after risk adjustment, as its initial annualized yield reached double digits; sUSDe and sUSDS are around 2% after risk adjustment; while sDAI, due to its low original APY, adjusts to only about 0.7%. Tokenized yield products like BENJI and USDY have risk-adjusted returns slightly below 2%.
The conclusion is: higher nominal APYs often do not withstand risk adjustments. In this snapshot, only sUSDf significantly exceeds centralized cash-like stablecoins after risk adjustment.
Yield vs. Risk, Yield vs. Complexity
There are two complementary perspectives to place these tools on an efficiency spectrum:
- Yield vs. Risk: Measures whether taking on risk can yield corresponding returns;
- Yield vs. Complexity: Examines how much yield can be retained after accounting for operational complexity.
This helps distinguish between the "economics of returns" and the "complexity of achieving returns," allowing readers to see which designs can deliver returns under the risks taken and how much of those returns remain after considering operational complexity.
Yield, Risk, and Complexity Scoring
The following chart displays various yield designs on three simple scales, ranging from 1 (low) to 5 (high).
The focus is not on precise values but on comparisons. By observing the height differences in the bar chart, one can quickly see which tools can provide higher returns under risk levels and which tools require more maintenance and operation in daily operations.
These scores are based on current design choices and recent market performance and may adjust in the future with changes in liquidity, incentive mechanisms, or protocol parameters.
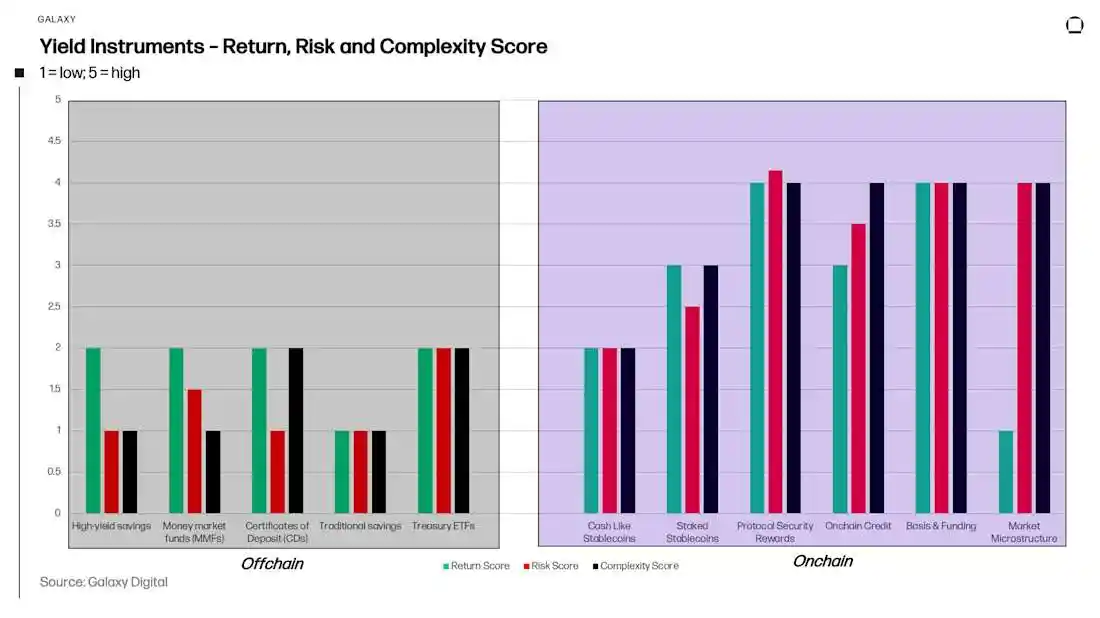
Risk and Complexity Adjusted Returns
The next chart converts yields into two efficiency metrics.
Black bars: Represent the return corresponding to each unit of measured risk.
Orange bars: Further deduct the reductions caused by operational complexity.
The gap between the two bars shows how much of the original efficiency can be retained after considering custody, operational processes, and daily monitoring. These scores are comparative snapshots based on design features and recent market performance, not precise values.
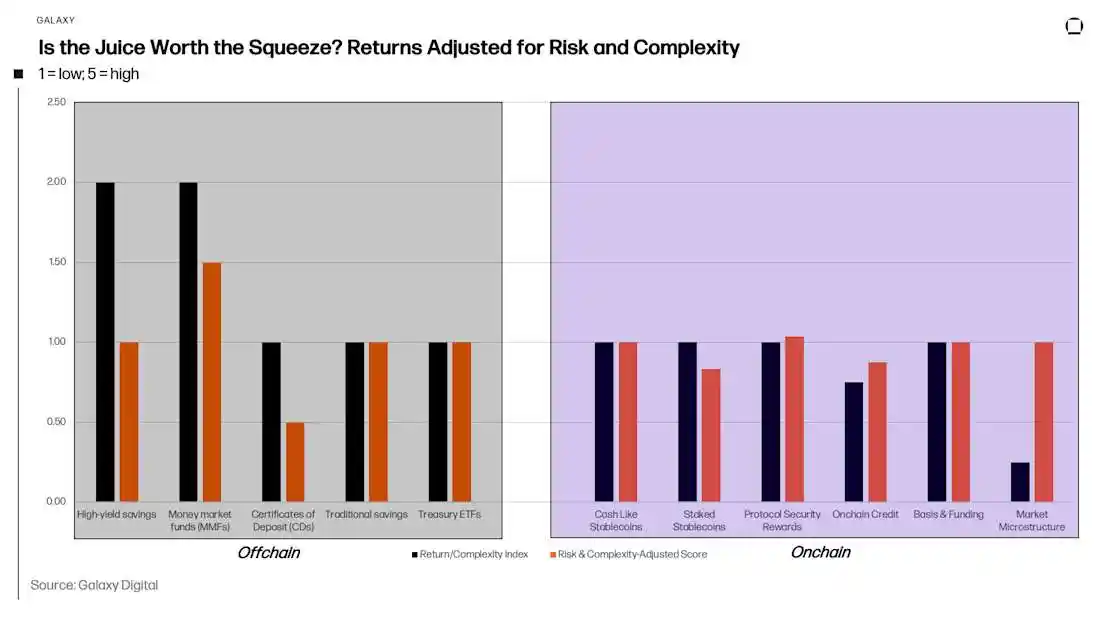
Insights
The efficiency perspective reveals a clear pattern. Cash-like tools score highest on "return per unit of risk" and suffer little loss after considering complexity reductions. Tokenized cash and similar fixed-income tools (like Pendle PT) also retain most of their efficiency. Native staking is in the middle; while re-staking and LRT's yields decline more after adding complexity considerations, as they rely on validators, incentive mechanisms, and integration relationships. Structured and incentive-driven designs perform strongly on risk-adjusted returns but relatively poorly after considering complexity; lending markets are generally at a moderate level. Actively managed AMM LPs have the lowest efficiency and experience the largest drop after complexity reductions, consistent with the characteristics of path dependence and inventory effects.
Conclusion
This article outlines five major sources of on-chain yield: the transmission of policy rates in tokenized cash; protocol rewards from staking and re-staking; credit spreads and basis yields in lending pools; market microstructure fees generated by automated market makers (AMMs); and the packaging and leveraging of these yield streams through structured products.
As different designs overlap, their yield engines, volatility, and potential failure points will change.
We compare these tools across three dimensions:
Yield Characteristics: Including yield levels, stability, and dependence on incentives;
Risk Composition: Covering asset backing and redemption, technical and oracle dependencies, liquidity and exit, governance and scrutiny risks, as well as leverage factors;
Operational Complexity: Including custody, cross-application and cross-chain operations, monitoring, and reporting.
Off-chain cash tools serve as benchmarks because they anchor the cash rates referenced by many on-chain designs.
Measurement and context are equally important. Realized yields may differ significantly from nominal snapshots. Activity-based designs depend on entry timing, price paths, and market cycles. Incentive-driven components are often temporary; as more yields can be retained long-term without incentives, efficiency will improve.
Dependencies are part of the product. Many designs will layer chains, cross-chain bridges, oracles, money markets, and staking layers. Since the same components (like a specific layer-2 network, cross-chain bridge, oracle, or LST) are often reused by different products and protocols, if one link encounters issues, it may simultaneously impact multiple positions, introducing correlation risks.
The importance of liquidity and exit is equal to that of returns: market depth, redemption terms, queuing, and restrictions will determine the performance of positions during market tightness.
On-chain yield is not magic. It is essentially: the packaging of policy rates, the distribution of protocol rewards, the pricing of credit, and the redistribution of fees. Labels may change, but the engines do not. Interpreting any yield number requires viewing it through two lenses: how much you earn for the risk, and how much remains after considering all operational costs.
免责声明:本文章仅代表作者个人观点,不代表本平台的立场和观点。本文章仅供信息分享,不构成对任何人的任何投资建议。用户与作者之间的任何争议,与本平台无关。如网页中刊载的文章或图片涉及侵权,请提供相关的权利证明和身份证明发送邮件到support@aicoin.com,本平台相关工作人员将会进行核查。


