
The six-month rolling volatility of Bitcoin has dropped from nearly 60% at the beginning of the year to about 30% currently, marking a historic low. As volatility approaches that of gold, Bitcoin's current volatility is only twice that of gold, which is also the lowest ratio in history. JPMorgan believes this makes Bitcoin increasingly attractive for institutional portfolios.
Bitcoin has been experiencing extreme fluctuations for nearly ten days, with a four-hour chart showing an ascending triangle that is about to change trend. Gold has reached a new high, peaking at 3674.
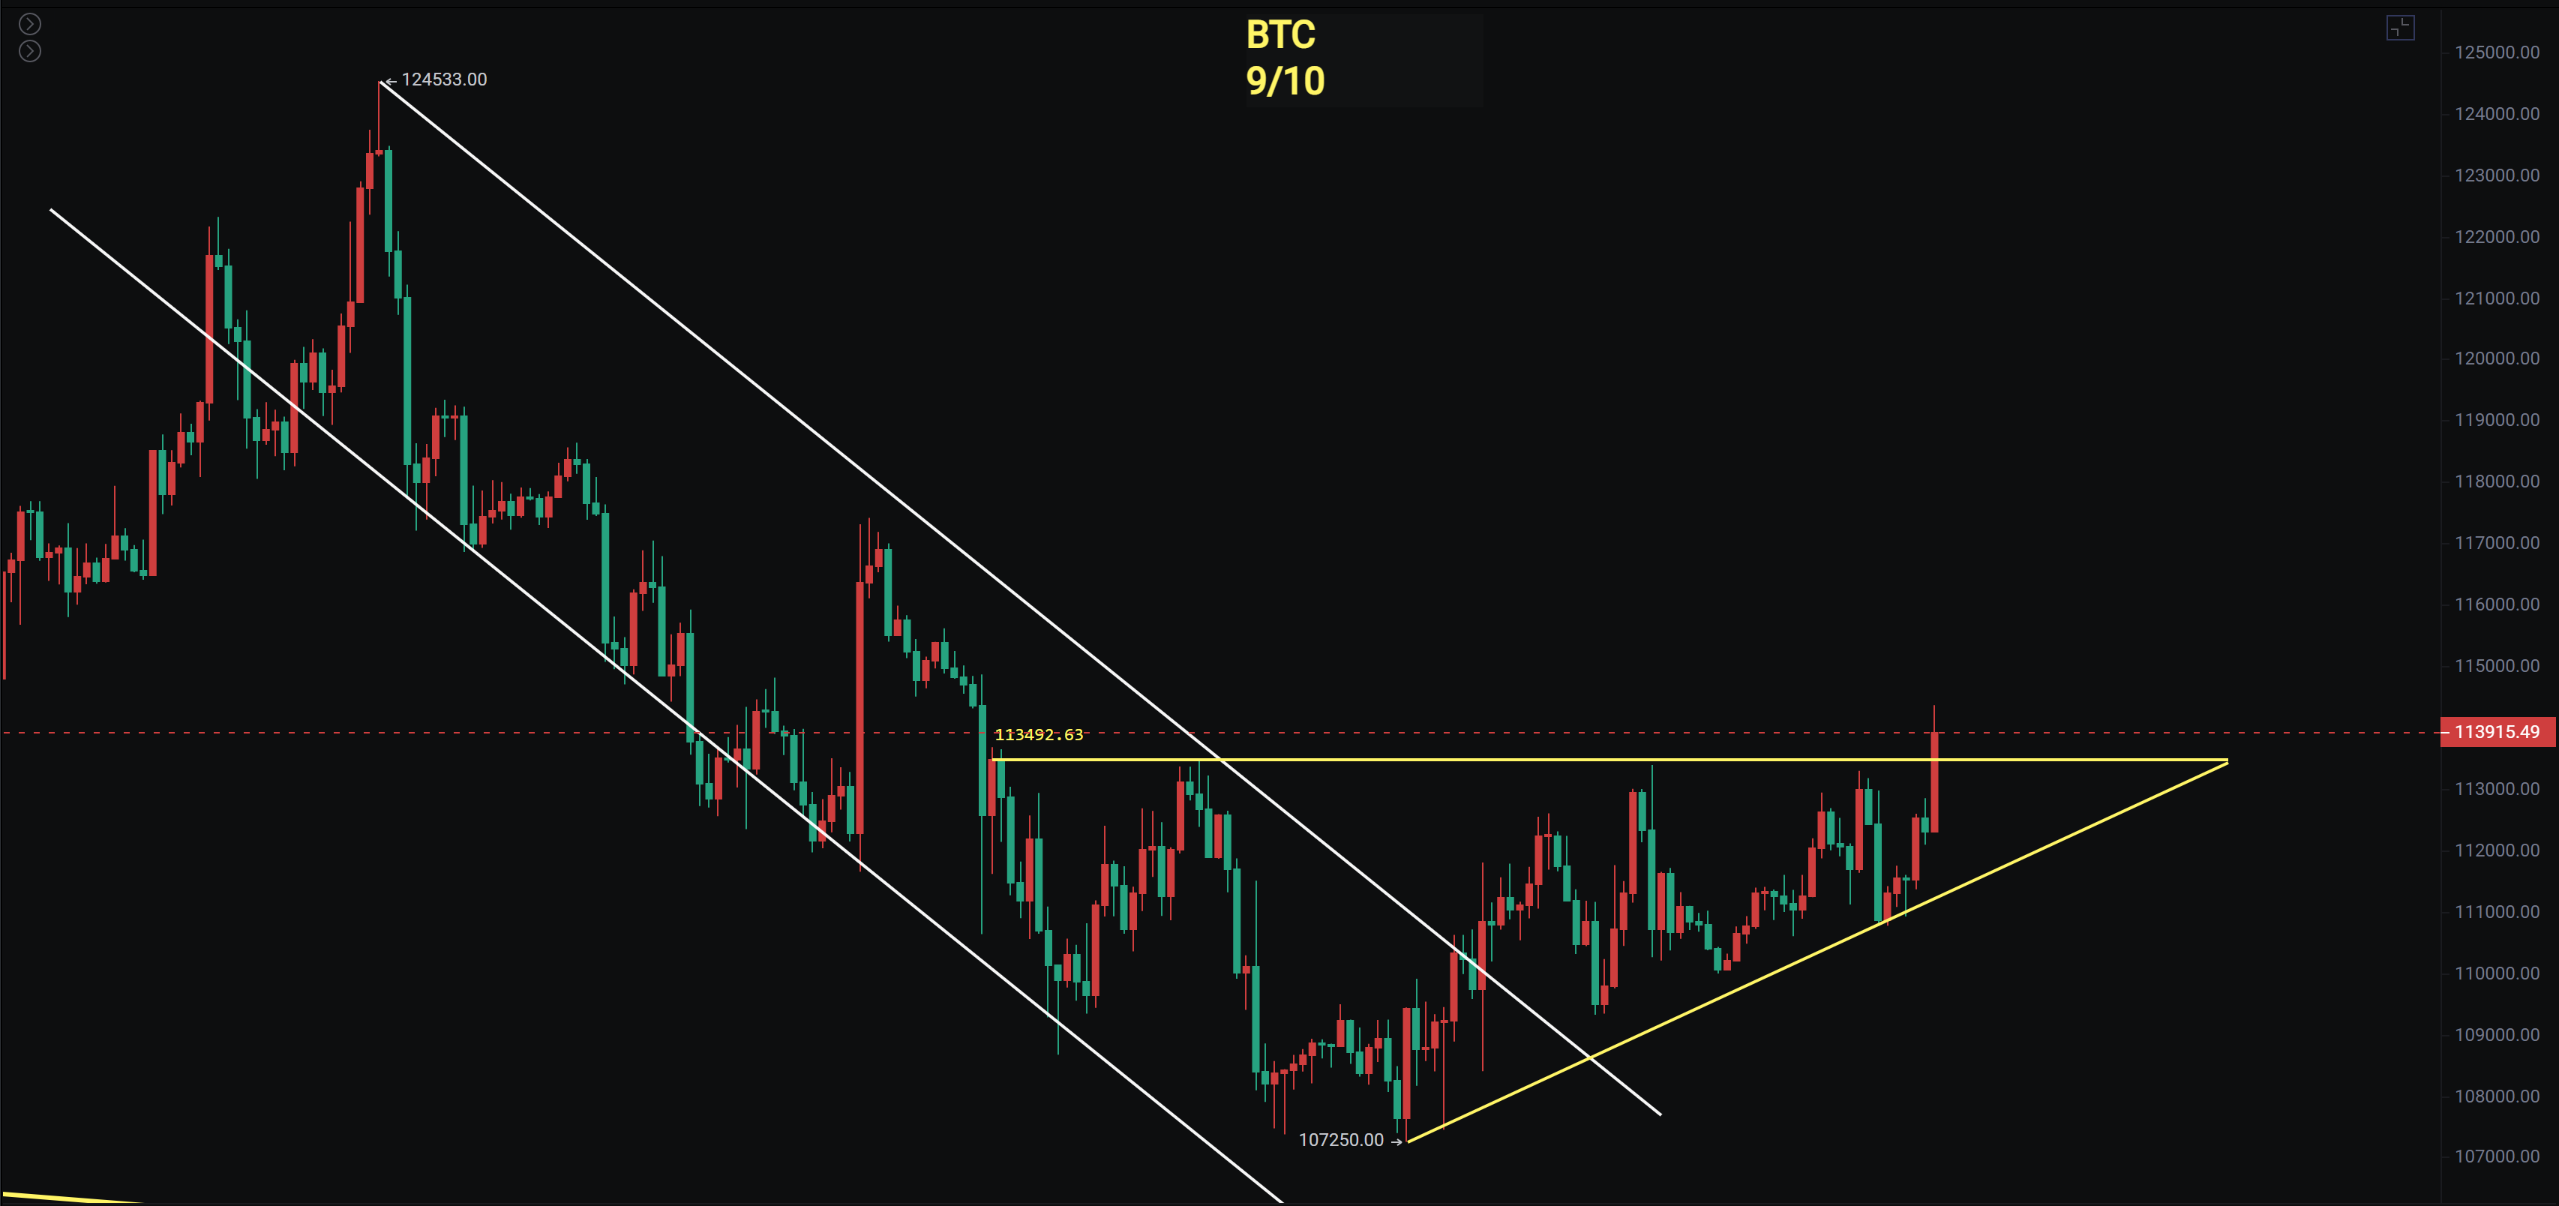
Bitcoin
Since September 1, when it was around 108,000, I have been reminding to watch for a rebound, and it has been 10 days. The current outlook remains the same, looking at resistance levels of 115,500—117,400. The four-hour chart has formed an ascending triangle and is currently breaking out.
On the daily chart, there are two bullish candles sandwiching a bearish one, with the price line above MA120 and MA20. The upward rebound pressure is at MA60, which is around 115,400 and 117,400. The Fibonacci retracement is near 0.382, with MACD continuing above the zero line and RSI turning upwards. In the analysis, I also mentioned the rebound opportunity at the lower Bollinger Band of the 3-day line; this is the first time touching the lower Bollinger Band in this cycle, so the probability of a rebound is relatively high. However, whether it can directly reach a new high will depend on the strength of the pullback after the interest rate cut, and a second pullback test is likely.
Support: 107,000—109,300
Resistance: 115,400—117,400
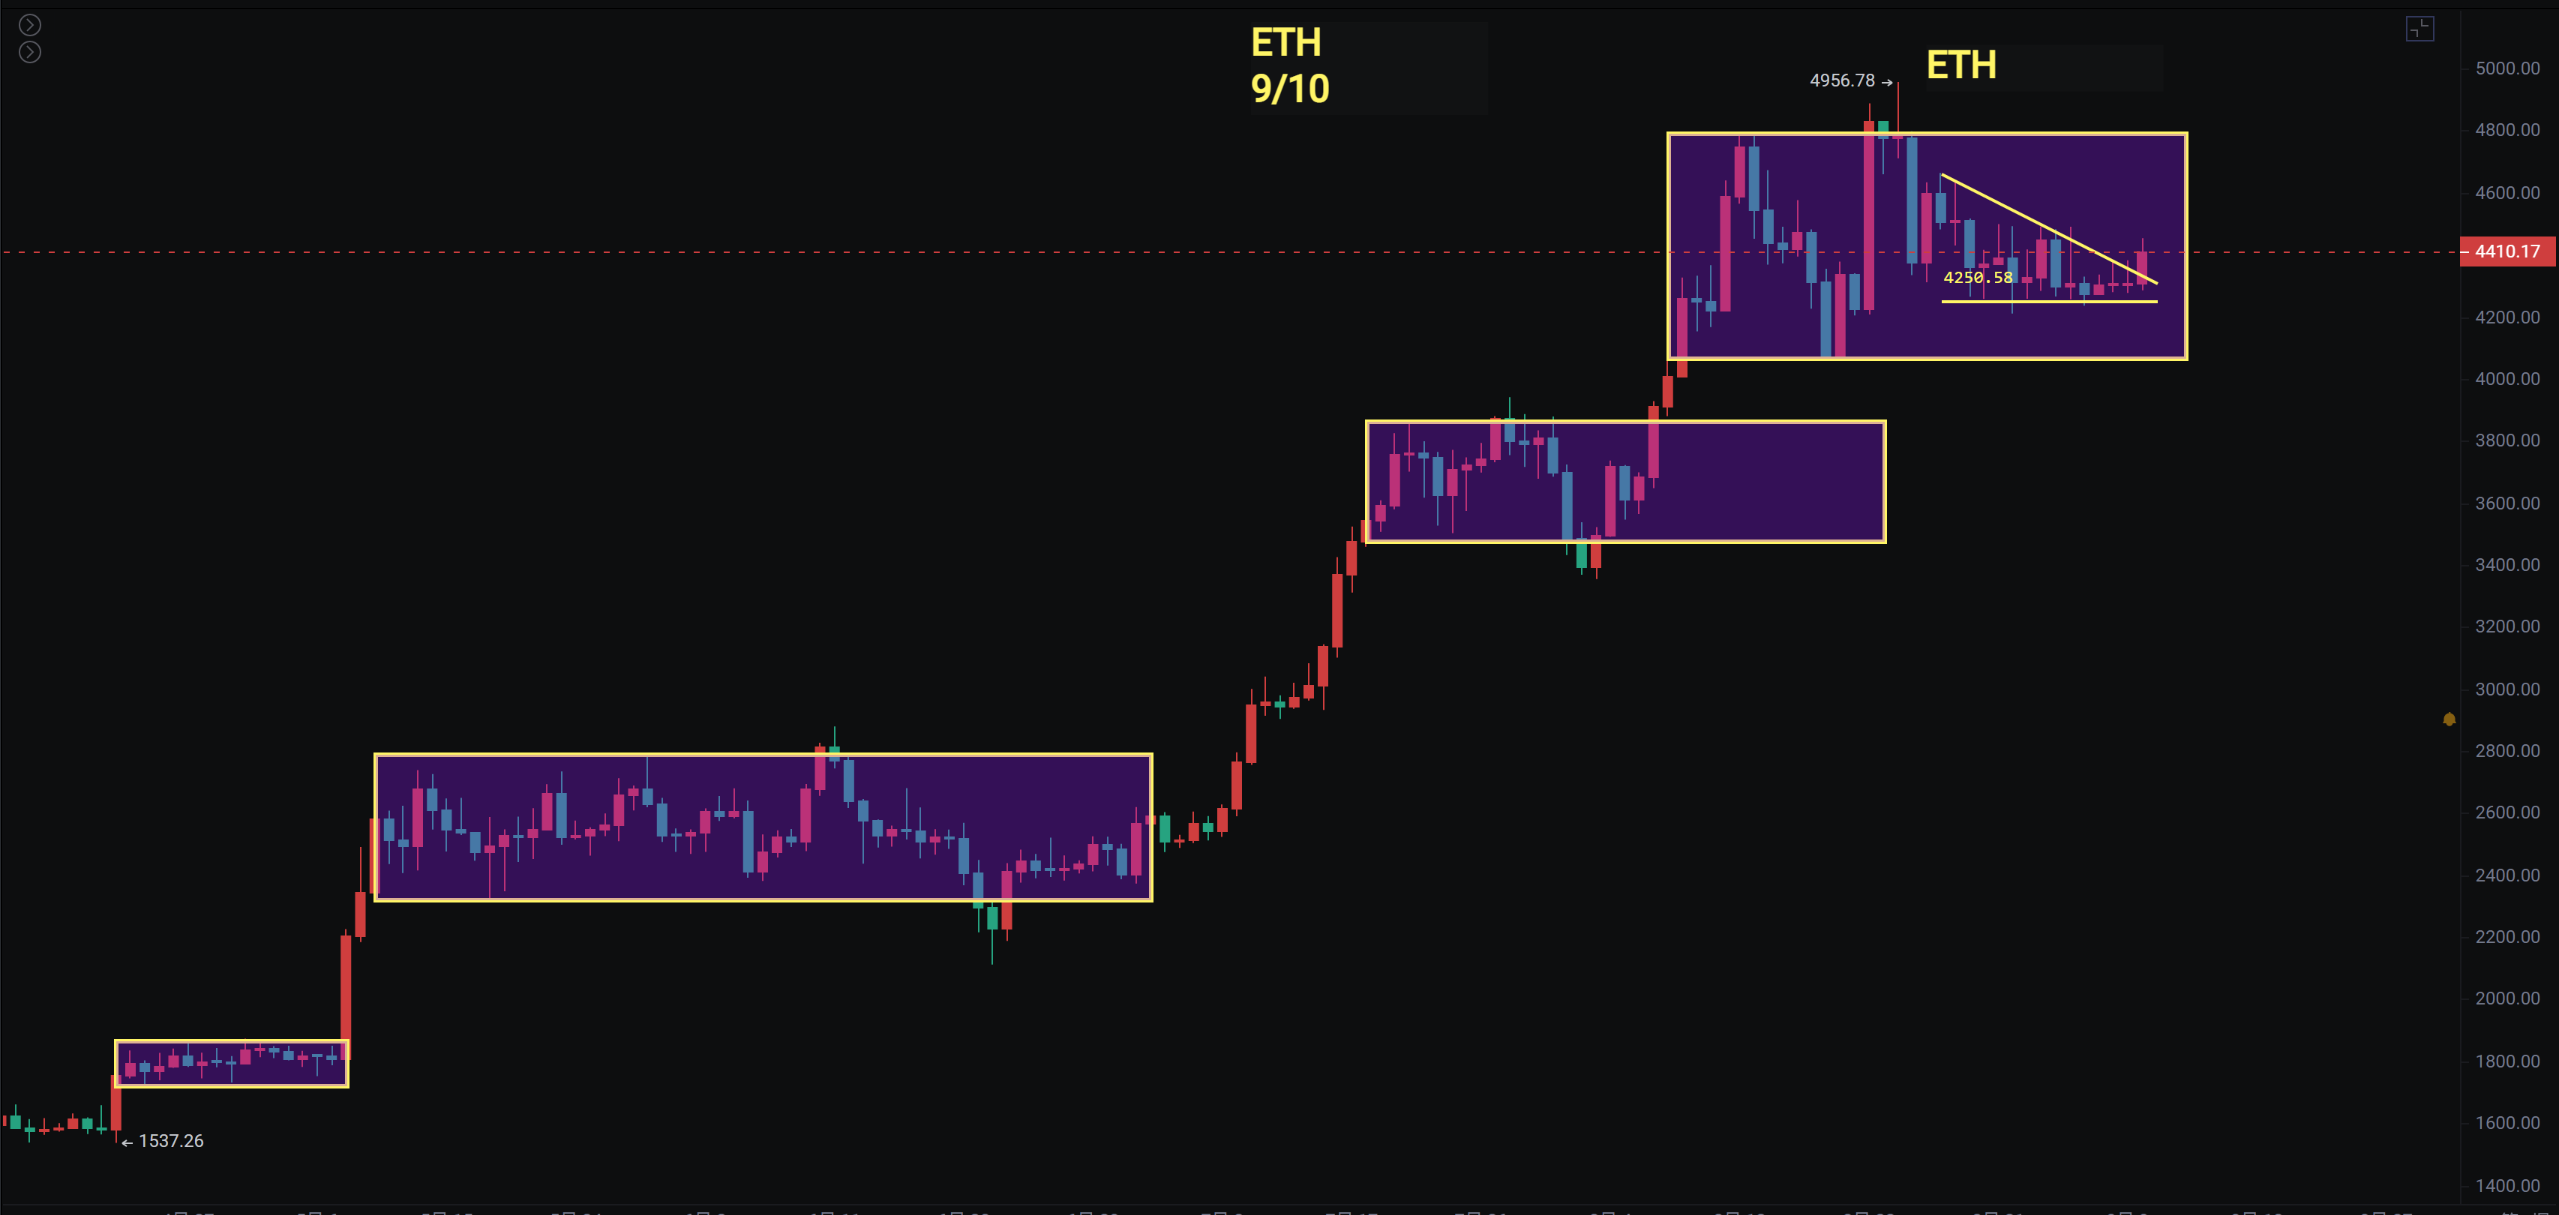
Ethereum
Since the false breakout and pullback on the daily chart, Ethereum has been oscillating in a narrow range of 4200—4500 for over ten days. Ethereum and I have been predicting a box range oscillation since the pullback, so it is basically replicating the previous three waves of movement. After Bitcoin completes this rebound and pullback, we will see if Ethereum will have a false breakdown followed by a rebound opportunity.
The daily chart has been under pressure from the middle Bollinger Band, which is also MA20. Technical indicators are hard to read; if it breaks above 4500, there may be another short-term rebound.
Support: 3850—4200
Resistance: 4500—4788—4956
If you like my views, please like, comment, and share. Let's navigate through the bull and bear markets together!!!
This article is time-sensitive and for reference only; it is updated in real-time.
Focusing on K-line technical research, sharing global investment opportunities. Public account: BTC Trading Master Fusu

免责声明:本文章仅代表作者个人观点,不代表本平台的立场和观点。本文章仅供信息分享,不构成对任何人的任何投资建议。用户与作者之间的任何争议,与本平台无关。如网页中刊载的文章或图片涉及侵权,请提供相关的权利证明和身份证明发送邮件到support@aicoin.com,本平台相关工作人员将会进行核查。


