This is a daily analysis by CoinDesk analyst and Chartered Market Technician Omkar Godbole.
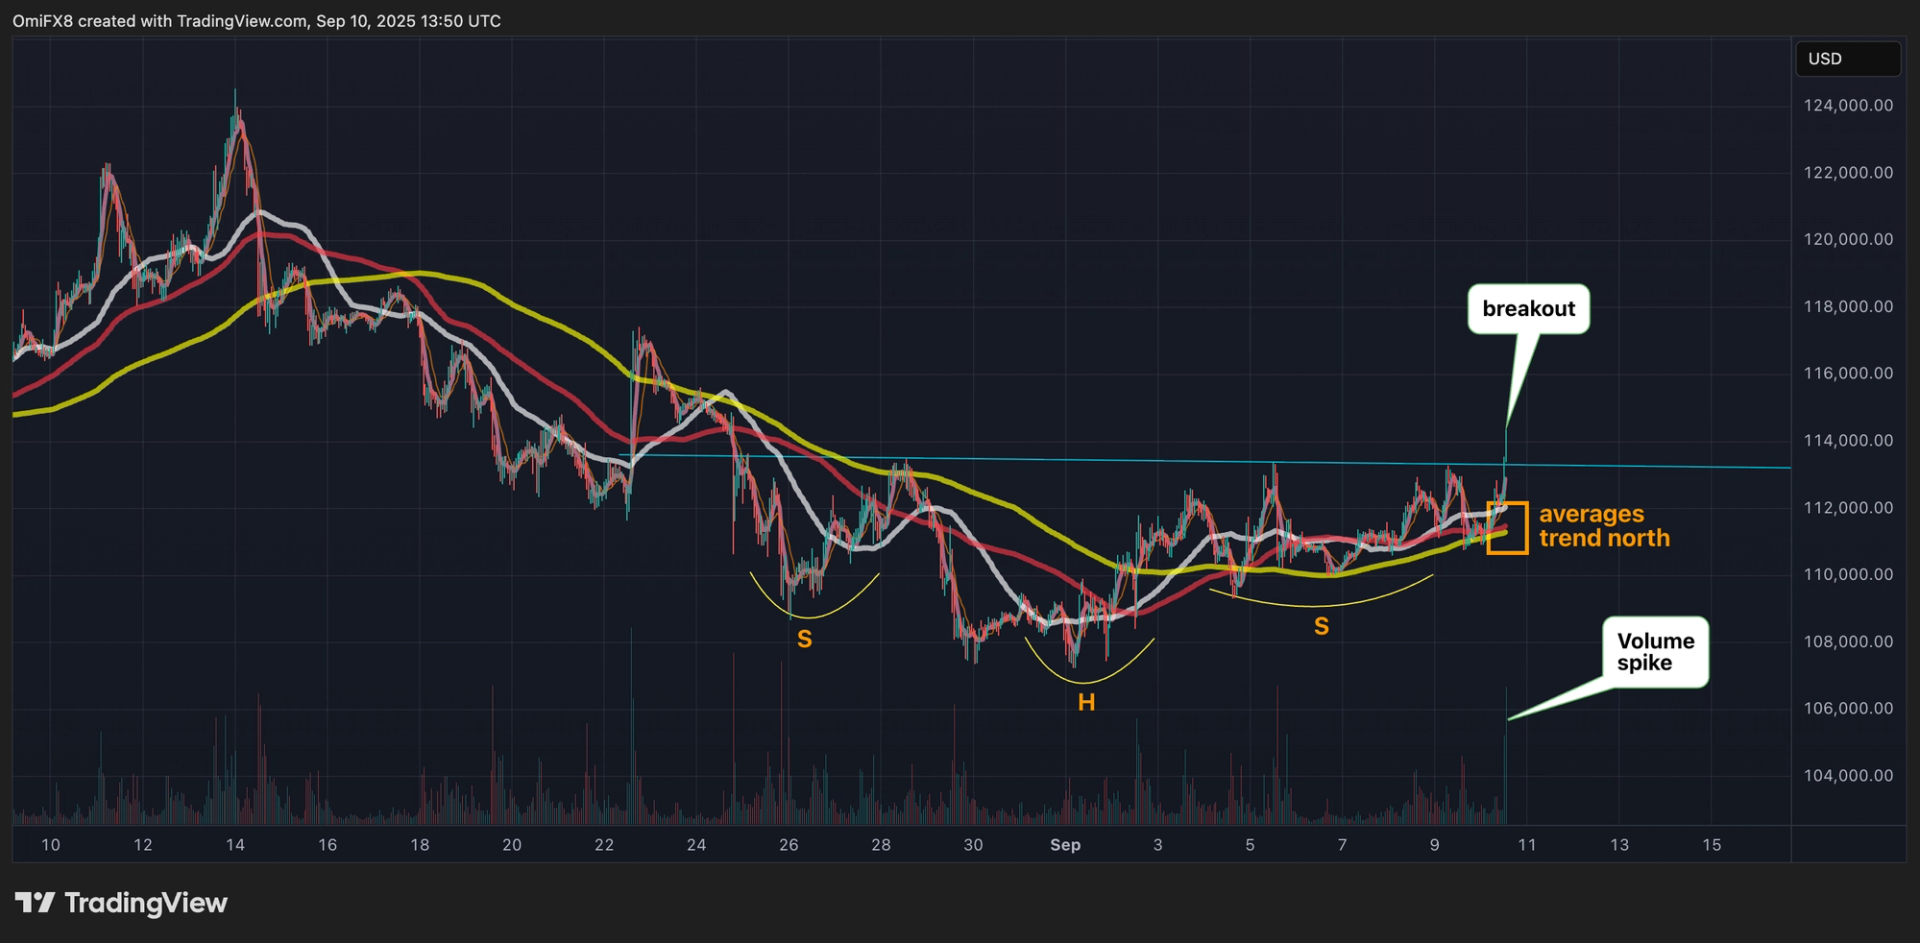
A softer-than-expected U.S. PPI pushed bitcoin (BTC) past $113,600, confirming the bullish inverse head and shoulders pattern highlighted earlier this week.
The breakout signals the end of the recent pullback from record highs above $124,000 and the resumption of the broader rally. Using the measured move technique, which adds the distance between the pattern’s low and the breakout point to the breakout level, suggests bitcoin could reach nearly $120,000.
The ascending 50-, 100-, and 200-hour simple moving averages (SMAs) support the bullish momentum gathering strength. Additionally, the daily chart’s MACD histogram crossing above zero further confirms a positive shift in market sentiment.
On the upside, bulls may encounter resistance near the heavily watched 50-day SMA at $114,700, while on the downside, the recent higher low at around $110,000 serves as a key level for bears to challenge.
")
免责声明:本文章仅代表作者个人观点,不代表本平台的立场和观点。本文章仅供信息分享,不构成对任何人的任何投资建议。用户与作者之间的任何争议,与本平台无关。如网页中刊载的文章或图片涉及侵权,请提供相关的权利证明和身份证明发送邮件到support@aicoin.com,本平台相关工作人员将会进行核查。


