【Price Trend Analysis】
- K-line Pattern:
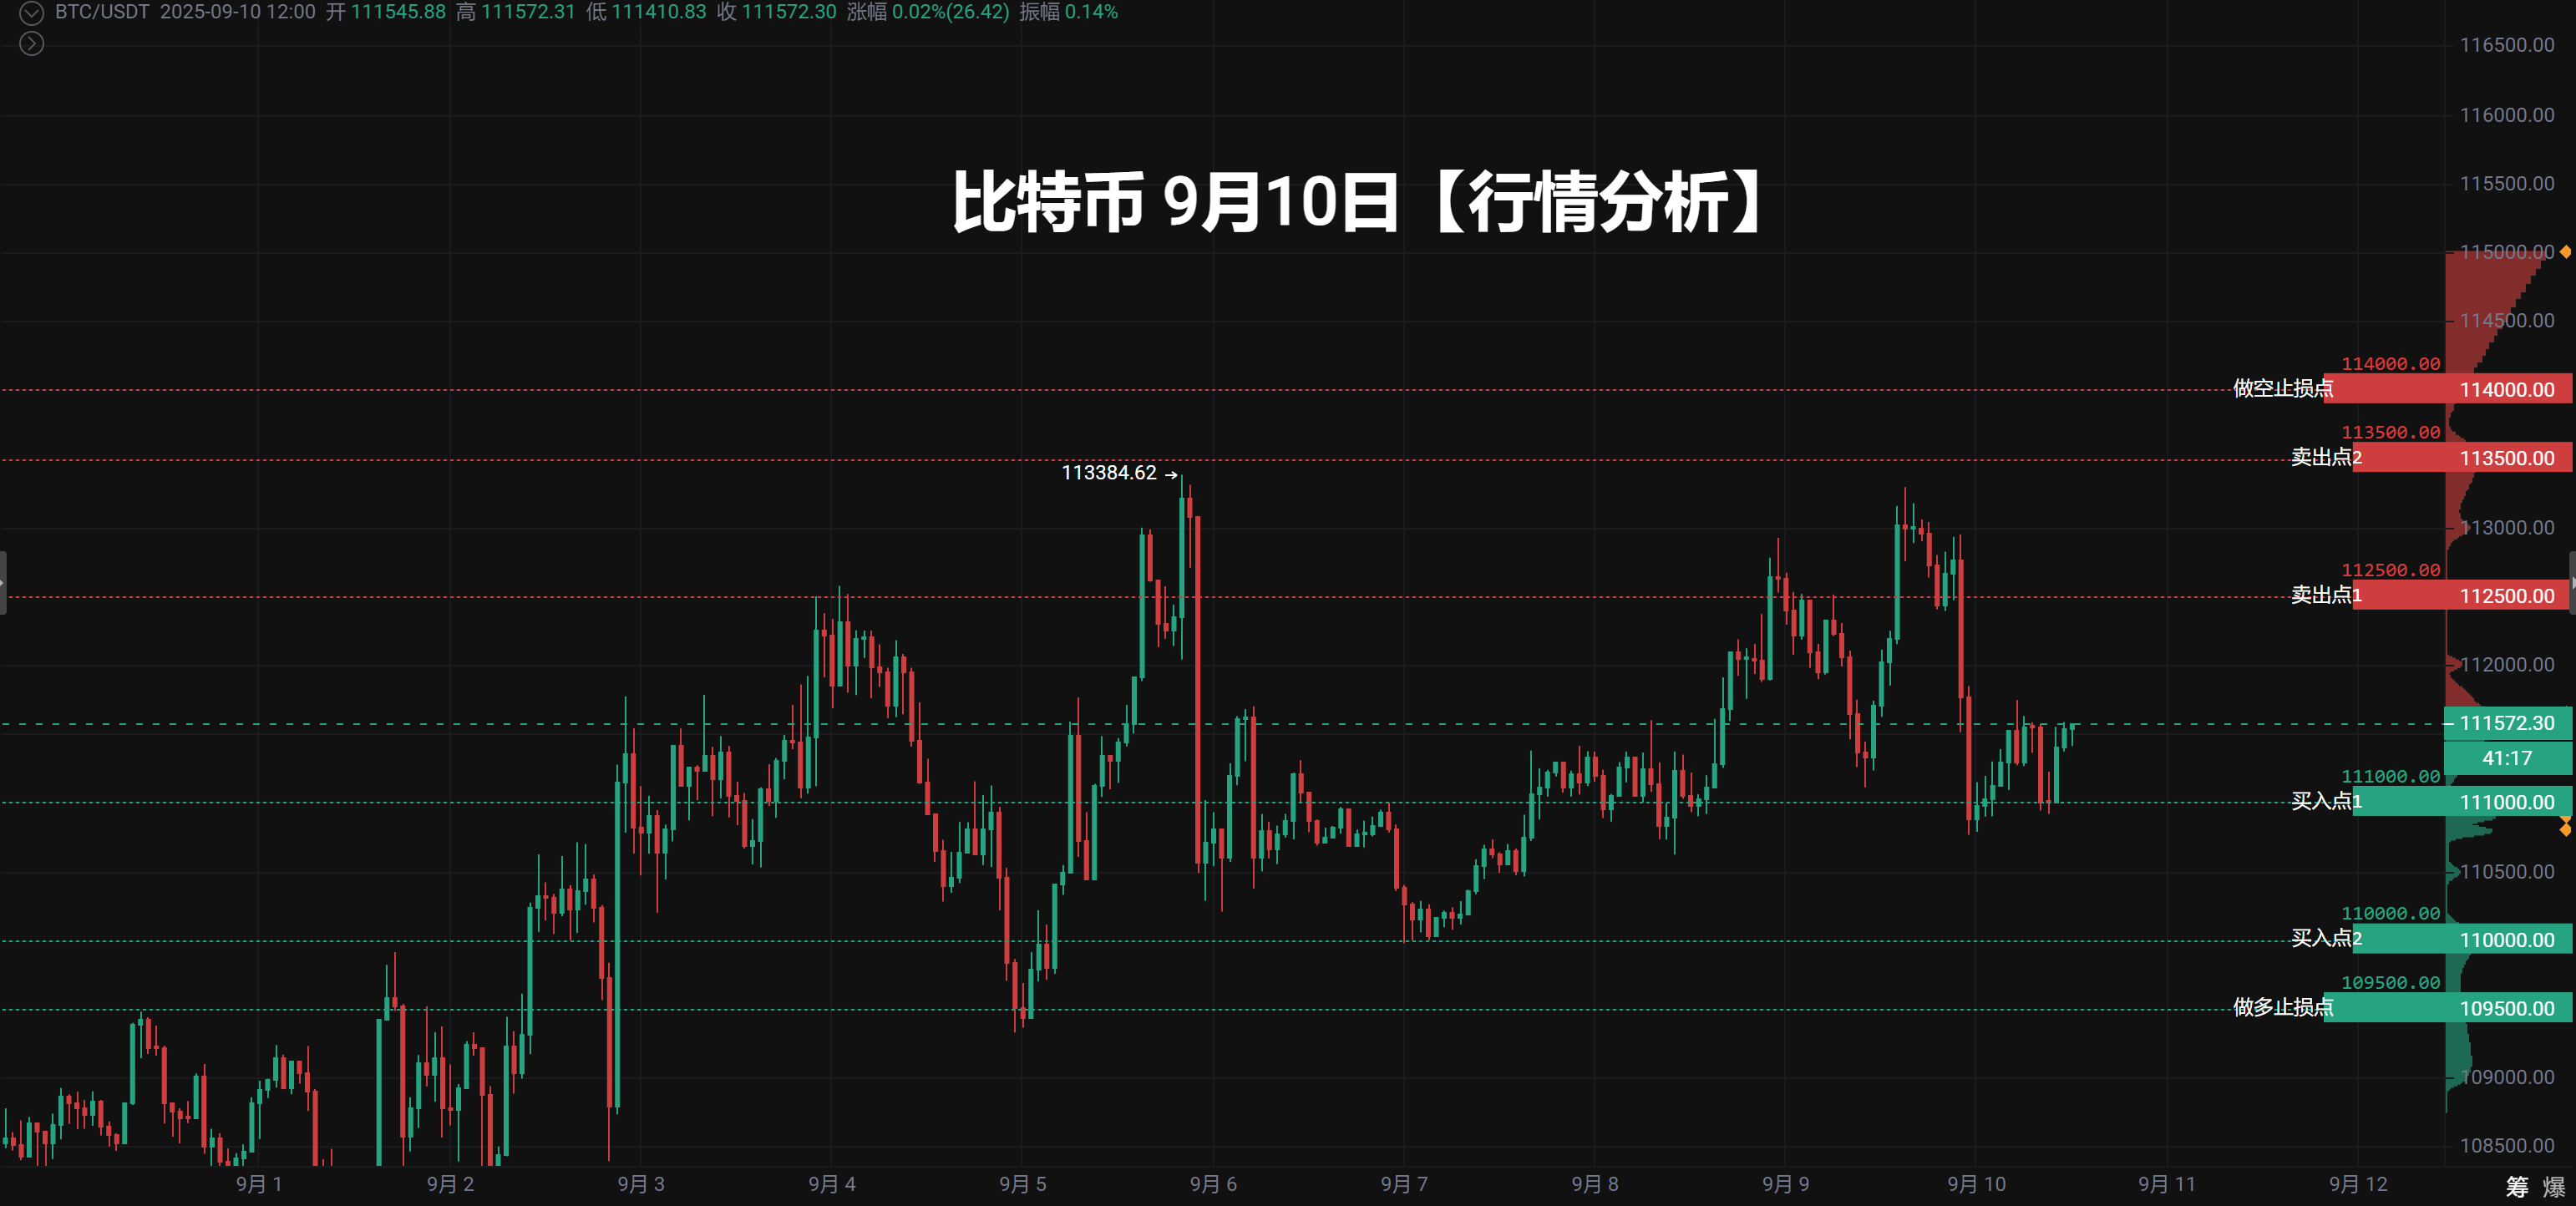
The daily level shows that the recent price has formed a clear high point around 112,000 before retreating, presenting a trend of rising and then falling.
The 4-hour K-line has a long upper shadow (e.g., September 9, 20:00), indicating heavy selling pressure above, while the low support is gradually rising.
Technical Indicators:
MACD: In the 4-hour cycle, both DIF and DEA are below the zero axis, but the gap is narrowing, and the green bar momentum is weakening, indicating short-term rebound signs; the daily level is still in a death cross state, with bears in control.
RSI: The 4-hour cycle is close to the 50 level, showing a temporary balance of bullish and bearish forces; the daily level has fallen from the overbought zone to the neutral area, with a weak trend.
EMA: The current price is hovering between EMA7 and EMA30, with EMA120 providing strong support around 111,875. If it breaks through EMA7 (111,618), it may further test the upper pressure.
Trading Volume:
The daily trading volume expanded on September 8 and then gradually shrank, indicating insufficient upward momentum.
In the 4-hour cycle, the trading volume significantly increased after the sharp drop (e.g., September 9, 20:00), but the subsequent rebound volume did not sustain, showing strong market hesitation.
Based on the trading strategy framework you provided, here are the optimizations and professional interpretations of the buy and sell points:
Long Position Trading Strategy
Buy Point One: 111,000 USDT
Technical Basis:
The previous low support coincides with the EMA120 moving average, forming a double support effect;
The psychological support at the round number is strong, having rebounded multiple times historically;
Confirmation of buying interest is needed with increased trading volume (to avoid false breakouts).
Buy Point Two: 110,000 USDT
Technical Basis:
Deep round number support, with a high probability of bearish exhaustion;
If the price drops to this level and RSI (Relative Strength Index) is below 30, the likelihood of a rebound from oversold conditions is high.
Stop Loss Point: 109,500 USDT
Risk Control Logic:
A quick drop to 109,500 after breaking 110,000 indicates a failure of support;
Control the stop loss space within 1%-2% of total capital to avoid excessive single losses.
Short Position Trading Strategy
Sell Point One: 112,500 USDT
Technical Basis:
The recent high point pressure coincides with the EMA7/EMA30 death cross area;
K-line patterns (such as long upper shadows, bearish engulfing) need to be observed to confirm selling pressure.
Sell Point Two: 113,500 USDT
Technical Basis:
Resistance at the top of the previous high segment, with selling pressure from trapped positions;
If the price reaches this level and trading volume shrinks, the probability of a reversal is high.
Stop Loss Point: 114,000 USDT
Risk Control Logic:
A breakthrough above 113,500 may initiate a new upward trend;
Set the stop loss above the previous high to avoid triggering stop loss on false breakouts.
Comprehensive Suggestions
Position Management:
It is recommended to build positions in batches (e.g., 30% for the first entry, 50% for additional purchases), reserving funds to cope with extreme volatility.Indicator Verification:
Combine MACD divergence and trading volume confirmation signals to validate effectiveness, avoiding reliance solely on price levels.Market Environment:
If the overall trend is a downward fluctuation, be cautious with long positions; if in a pullback phase of an upward channel, the success rate of long positions is higher.
Risk Warning: Digital assets are highly volatile, and the above strategies need to be adjusted according to real-time market dynamics. It is recommended to use risk control tools (such as isolated margin) in conjunction.
Wishing you successful trading!
Live streaming of real-time strategies at irregular hours
#Tencent Meeting: 919-948-0091
DingTalk group number for the "Web3 Crypto Masters Community Group 9": 152480000730
【The above analysis and strategies are for reference only. Risks are to be borne by the user. The article review and publication may have delays, and specific operations should follow the real-time strategies of Crypto Masters】
Join the group chat to discuss and learn professional knowledge in the crypto space, avoiding being a victim under the scythe (you can receive position allocation strategies, teaching you how to make money in a bull market and earn coins in a bear market)
——Crypto Masters Community, a community focused on technical analysis. Anyone with questions about operations or trends can communicate and learn with me! Let's share and profit together! Remember Crypto Masters, available 24/7, follow Crypto Masters to avoid getting lost!

- Scan the QR code with WeChat to follow my public account
免责声明:本文章仅代表作者个人观点,不代表本平台的立场和观点。本文章仅供信息分享,不构成对任何人的任何投资建议。用户与作者之间的任何争议,与本平台无关。如网页中刊载的文章或图片涉及侵权,请提供相关的权利证明和身份证明发送邮件到support@aicoin.com,本平台相关工作人员将会进行核查。


