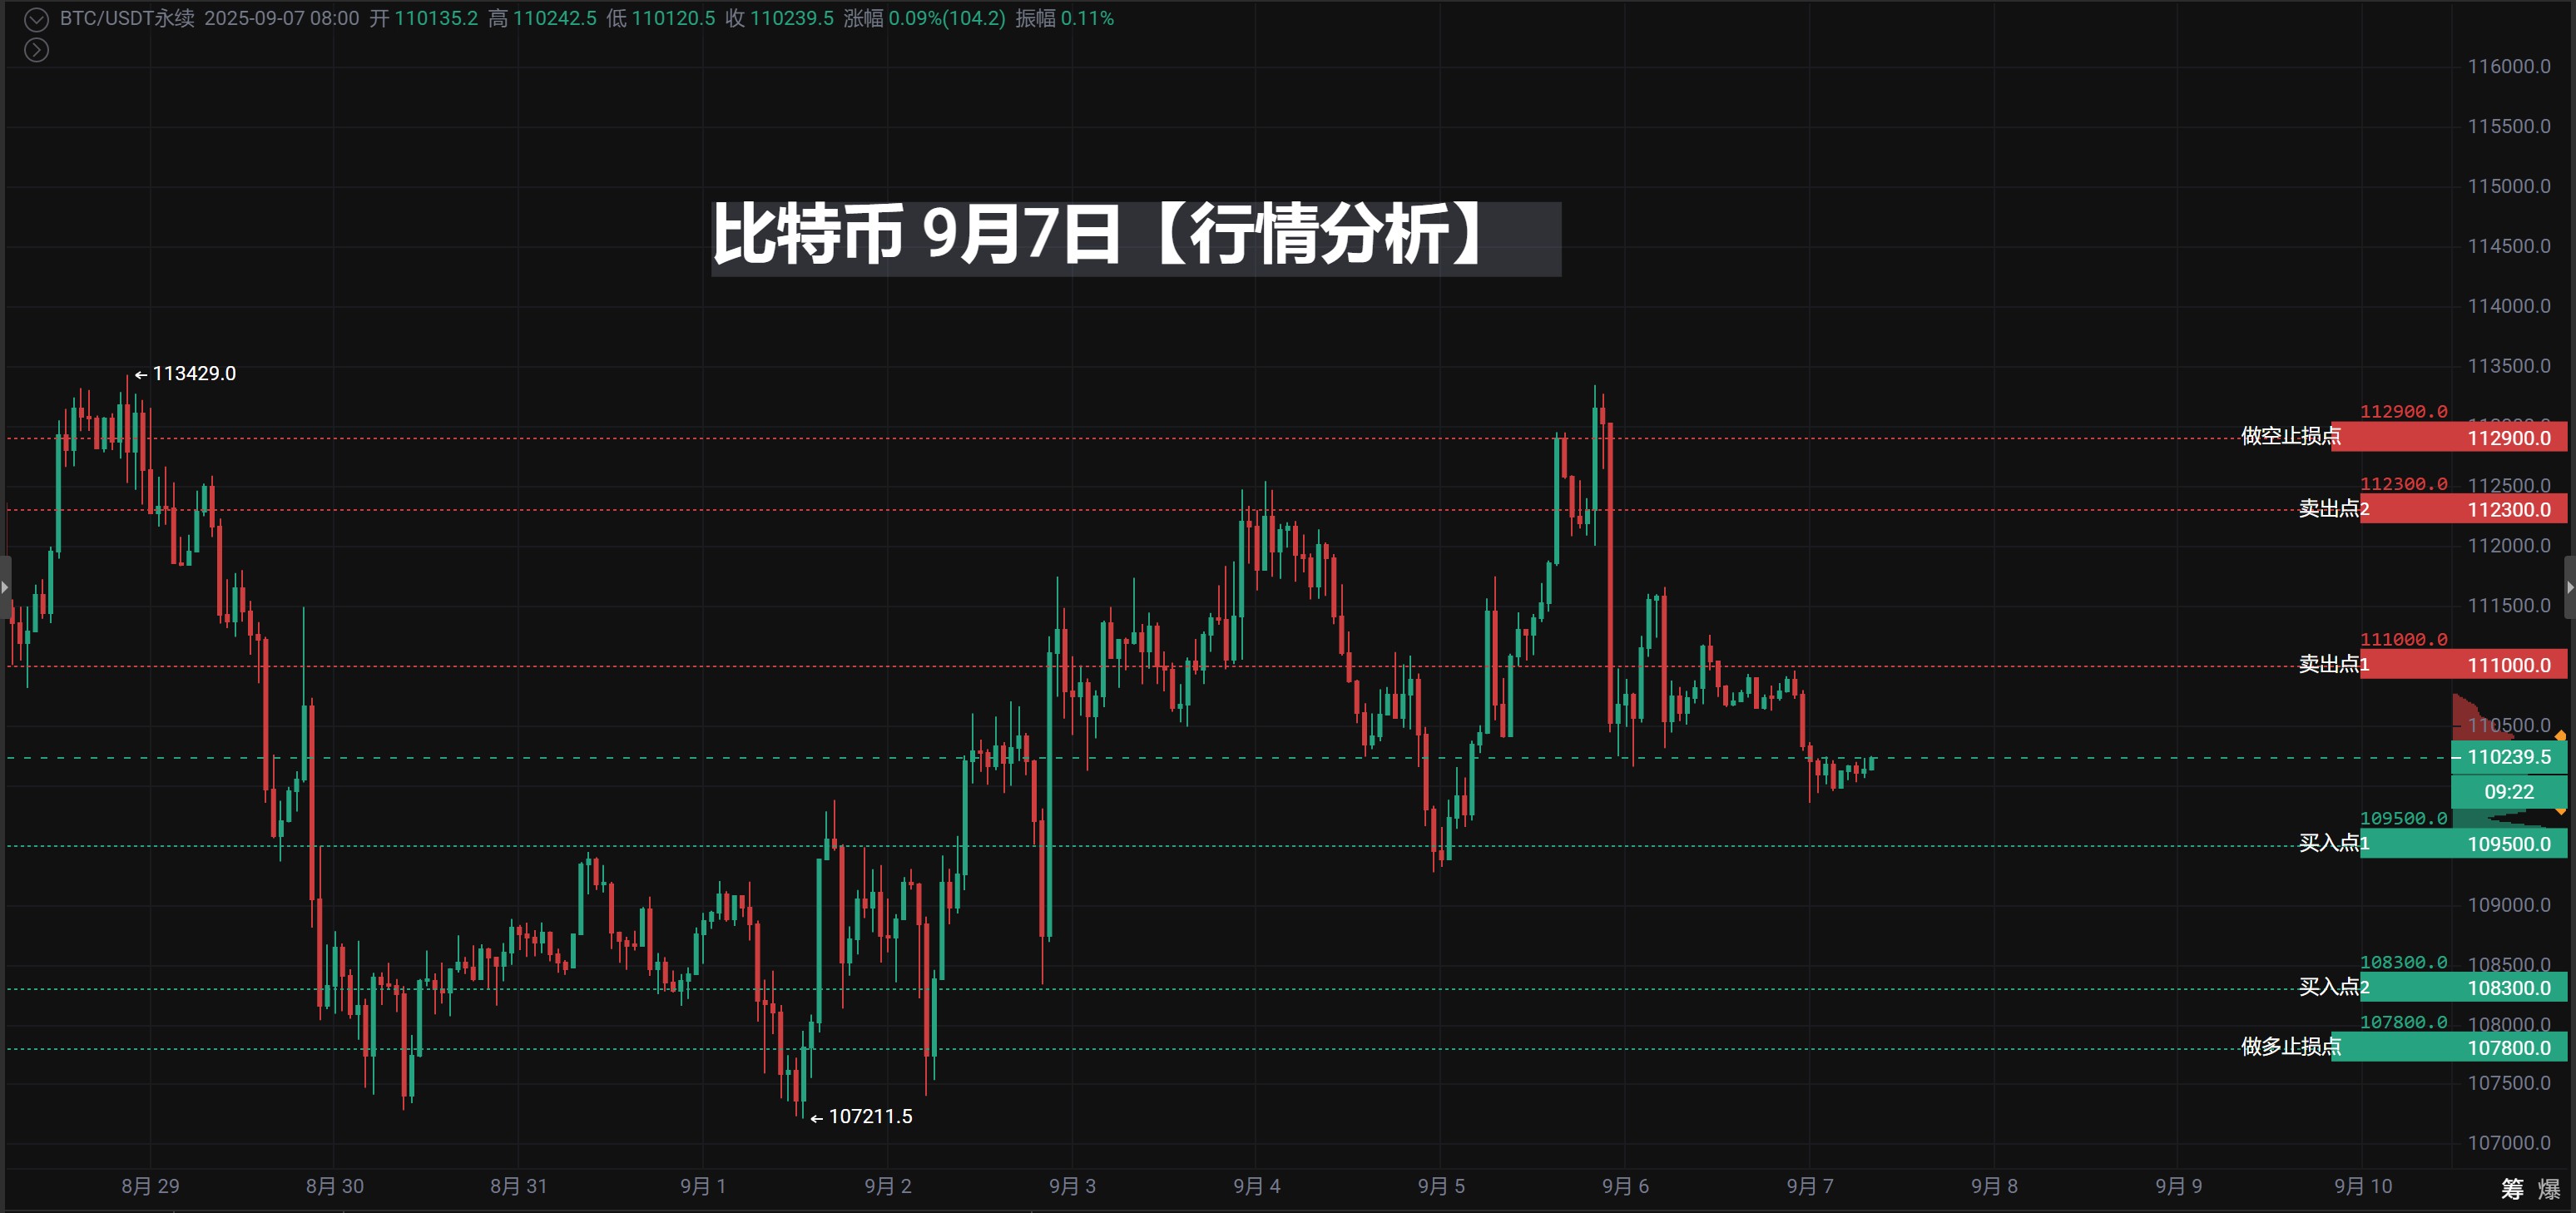
Crypto Master Community: Bitcoin September 7th [Market Analysis]

CN
5 hours ago

【Price Trend Analysis】

  1. K-Line Pattern:

    • Recently, the price has been oscillating at a high level, with a long upper shadow appearing on September 5 (113344.3 being the highest point), indicating heavy selling pressure above.

    • In the past two days (September 6 and 7), small real body K-lines have formed, with reduced volatility, and market sentiment is becoming cautious.

  2. Technical Indicators:

    • MACD: In the 4-hour cycle, DIF and DEA are gradually retreating, and the histogram has turned from positive to negative, indicating a decline in bullish strength and a shift towards bearish dominance.

    • RSI: The current value is around 47, in a neutral to weak area, not entering the oversold zone, but the rebound strength is insufficient.

    • EMA: The short-term moving averages EMA7 (110424.4) and EMA30 (110632.7) have formed a death cross, and the price continues to operate below EMA120 (111909.1), indicating an overall bearish trend.

  3. Trading Volume:

    • After the trading volume expanded to 88697 on September 5, it has significantly shrunk in the following days, showing a strong wait-and-see sentiment among investors.

    • The current trading volume is sluggish, making it difficult to push the price to break through key resistance or support.

【Trading Strategy Analysis and Execution Suggestions】

Operation Direction

Price Level (USDT)

Technical Basis

Assessment and Optimization Suggestions

Buy Point One

109,500

Previous low support + round number + near the low point of September 6

Reasonable, in line with the support resonance principle, suitable for light position testing (30%-40% of funds)

Buy Point Two

108,300

Support at the historical low on August 29

Better risk-reward ratio, suitable for main position layout (60%-70% of funds)

Long Stop Loss

107,800

Break below historical support area

Set reasonably, must be strictly executed to prevent the risk of trend reversal to bearish

Sell/Take Profit One

111,000

EMA30 pressure + recent oscillation high point

Reasonable, suitable for reducing half of the long position to lock in profits

Sell/Take Profit Two

112,300

High resistance area before September 5

Ideal take profit point, can close remaining long positions, or lightly short

Short Stop Loss

112,900

Breakthrough of previous high resistance

Necessary setting, to leave room for trend continuation

🔍 Key Technical Level Analysis

  1. Support Validity Analysis

    • 109,500: Combined with round number and previous low support, short-term support is strong

    • 108,300: Historical low on August 29, has strong support characteristics, worth focusing on

  2. Resistance Level Analysis

    • 111,000: EMA30 moving average pressure + recent high point, first resistance level

    • 112,300: Resistance near previous high, strong resistance area

⚠️ Risk Warning and Precautions

  1. Trend Environment Adaptability

    • This strategy is most suitable for oscillating markets or moderate rebound trends

    • Caution is needed in strong one-sided trends

  2. Key Breakthrough Signals

    • If it breaks above 112,900 and stabilizes, it may open a new round of upward movement

    • If it breaks below 107,800, it may open a new round of downward movement

  3. Position Management Suggestions

    • Adopt a batch building strategy

    • Long positions: 109,500 (40%) → 108,300 (60%)

    • Short positions should be less than long positions

💡 Optimization Execution Suggestions

  1. Prioritize Long Strategies

    • Focus on executing batch buying at 109,500 and 108,300

    • Gradually take profit at 111,000 and 112,300

  2. Be Cautious with Short Strategies

    • Only lightly short near 112,300

    • Strictly set stop loss at 112,900

  3. Key Signal Monitoring

    • Volume Confirmation: Need to confirm with increased volume when breaking key levels

    • K-Line Patterns: Pay attention to reversal signals appearing at key levels

📊 Expected Risk-Reward Ratio Analysis

  • Long Strategy: Risk of 1,500 points, potential return of 2,800 points, risk-reward ratio approximately 1:1.87

  • Short Strategy: Risk of 600 points, potential return of 1,300 points, risk-reward ratio approximately 1:2.17

Summary: It is recommended to focus on the main trading range of 108,300-112,300, strictly execute stop loss and take profit discipline.

Please Note: The market is ever-changing, please adjust flexibly based on real-time conditions in actual trading, and always prioritize risk control.

Wishing you successful trading!

  • Live streaming of real-time strategies at all times

    #Tencent Meeting: 919-948-0091

    【The above analysis and strategies are for reference only. Risks are to be borne by the user. The article review and publication may have delays, and specific operations should follow the real-time strategies of crypto experts】

    Join the group chat to discuss and learn professional knowledge in the crypto space, so as not to be the chives under the sickle (you can receive position allocation strategies, teaching you how to make money in a bull market and earn coins in a bear market)

    ——Crypto Expert Community, a community focused on technical analysis. Anyone with questions about operations or trends can communicate and learn with me! Share and profit together! Remember the crypto expert, available 24 hours a day, follow the crypto expert to avoid getting lost!

    Scan the QR code with WeChat to follow my public account

免责声明:本文章仅代表作者个人观点,不代表本平台的立场和观点。本文章仅供信息分享,不构成对任何人的任何投资建议。用户与作者之间的任何争议,与本平台无关。如网页中刊载的文章或图片涉及侵权,请提供相关的权利证明和身份证明发送邮件到support@aicoin.com,本平台相关工作人员将会进行核查。

抢占9月机遇!送$20比特币,立享红包!
Ad
Share To
APP

X

Telegram

Facebook

Reddit

CopyLink