Across all major timeframes—the daily, 4-hour, and 1-hour charts— bitcoin appears to be forming a recovery pattern, albeit under mixed technical signals. The daily chart reflects a bounce from the $107,000 region following a steep 14 percent correction from recent highs near $124,500. Despite this upward movement, price action lacks conviction, with volume waning on green candles, signaling either weak demand or a potential bull trap. Resistance remains firm around the $113,500 to $114,000 zone. A breakout above this level on strong volume would validate bullish momentum, while rejection could usher in renewed downside pressure.
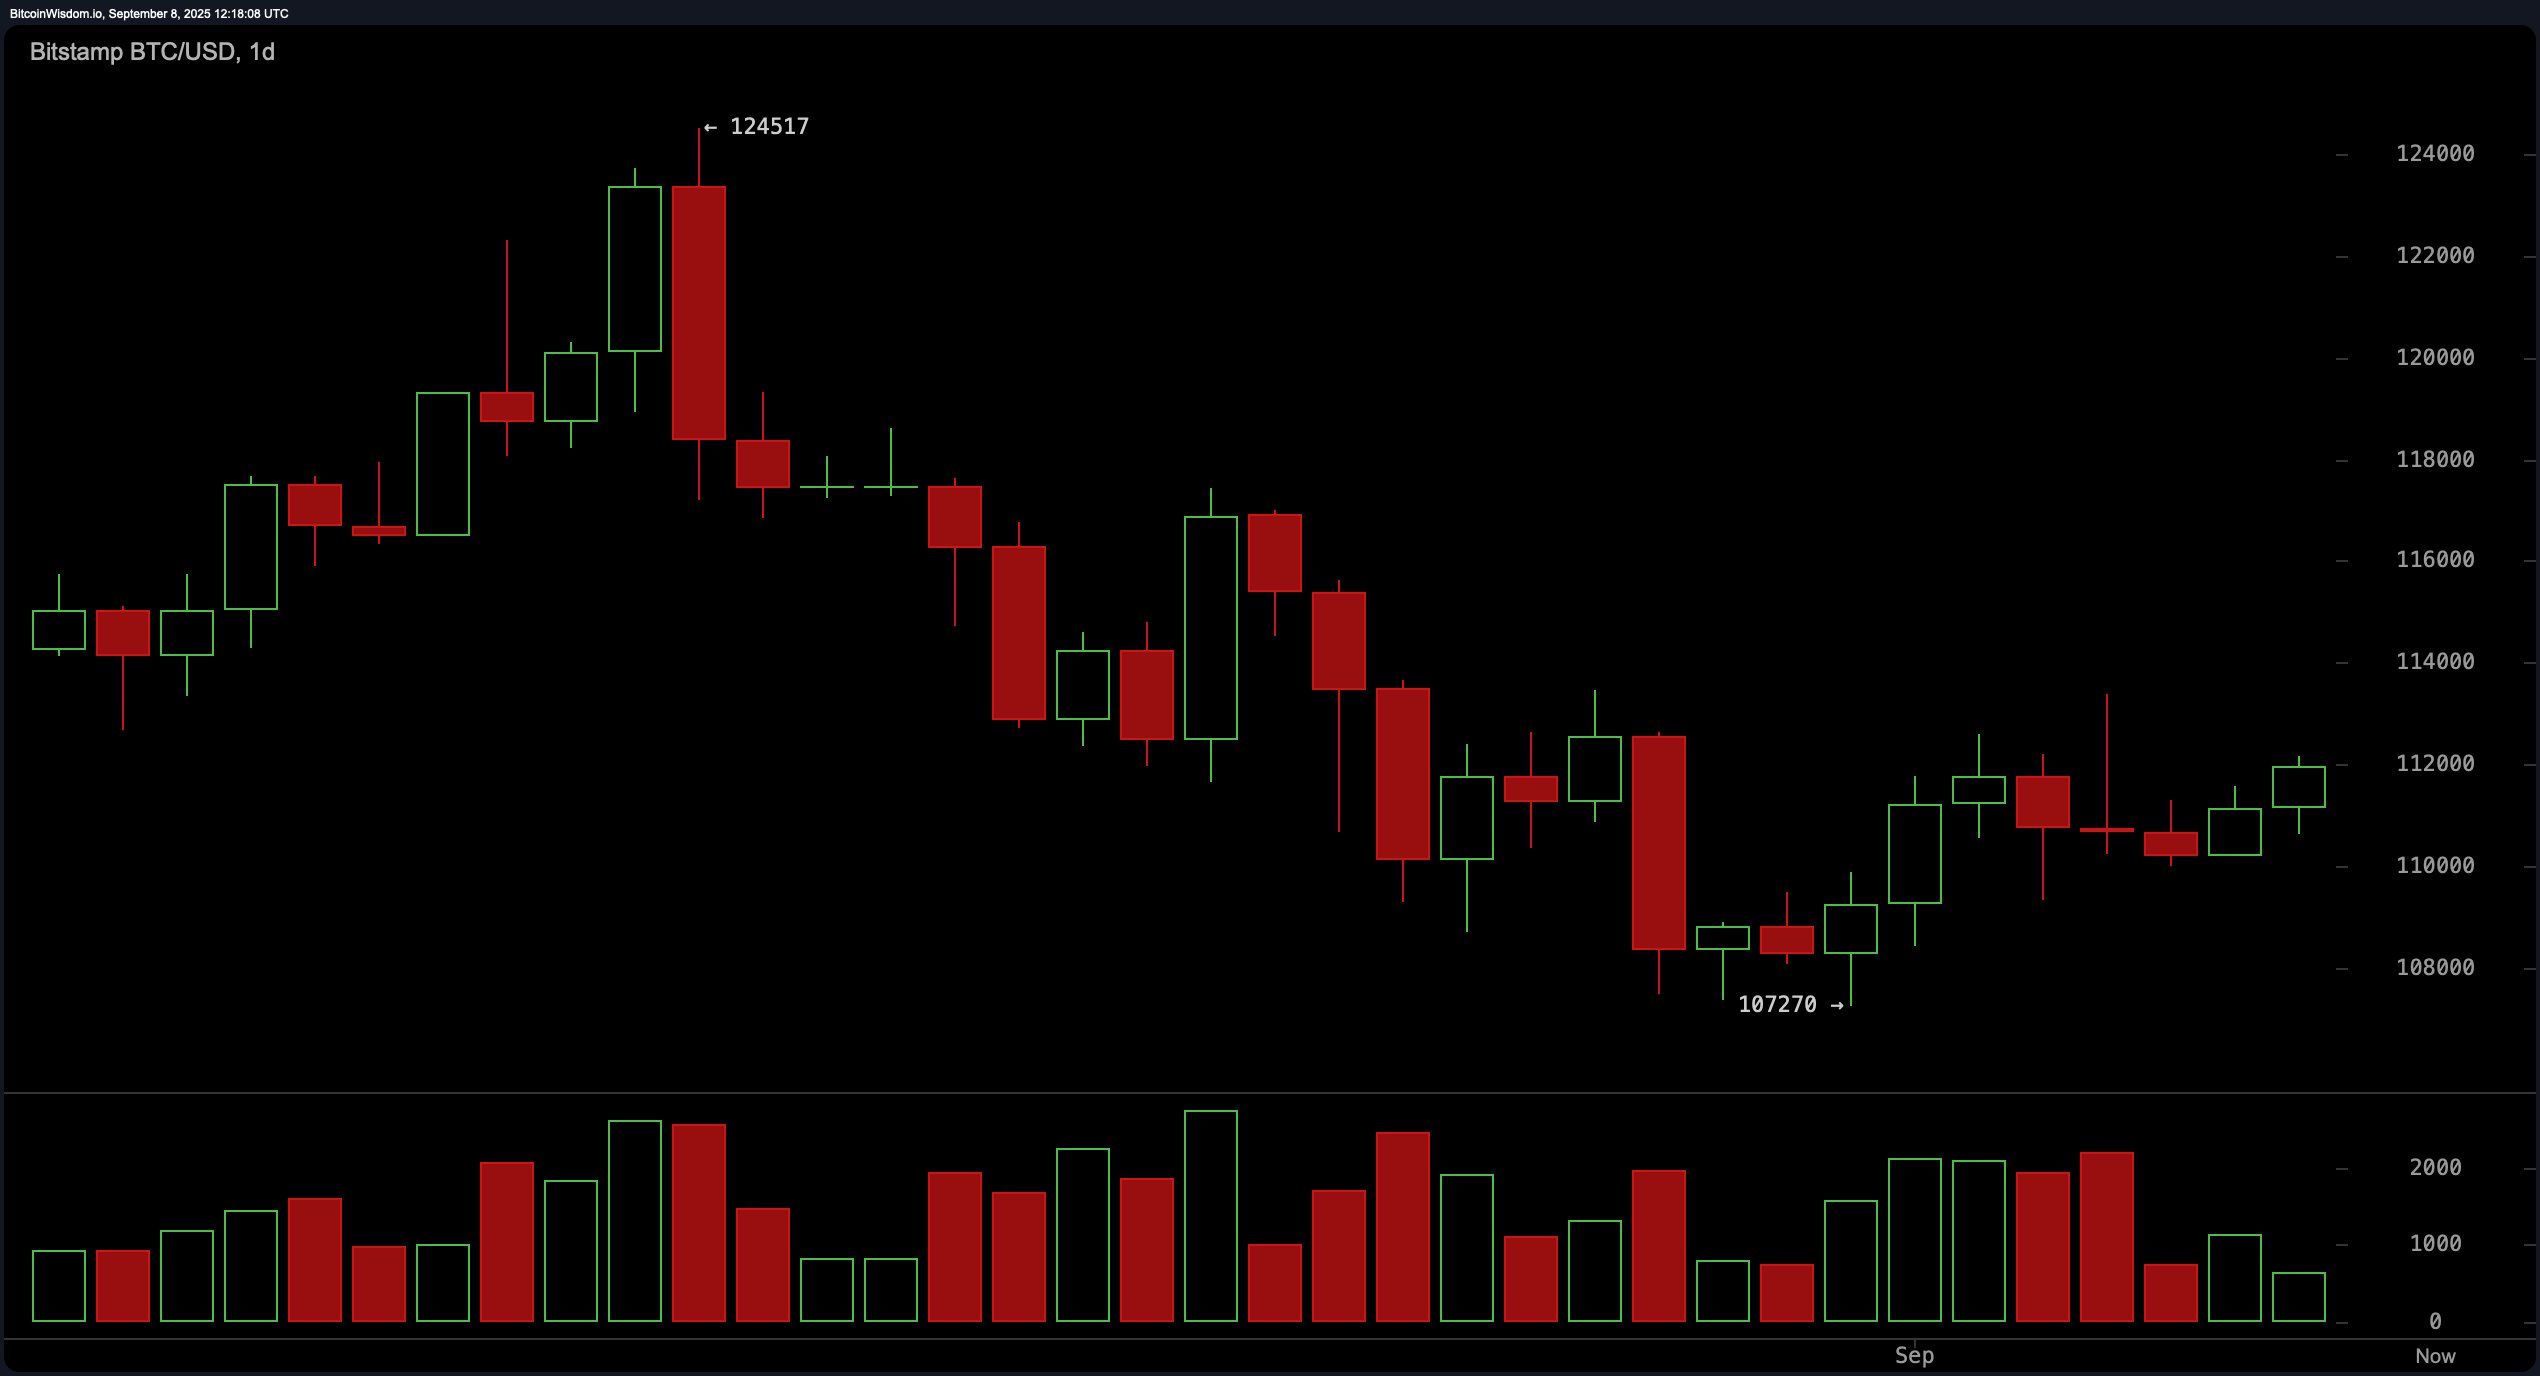
BTC/USD 1-day chart via Bitstamp on Sept. 8, 2025.
The 4-hour chart suggests moderate bullish bias supported by higher lows, despite a failed breakout attempt at $113,402 earlier in the week. The asset has been consolidating tightly between $109,000 and $112,000 since September 6, pointing to an imminent directional move. Declining volume during consolidation further supports the theory of a breakout setup. For bulls, a clean break and retest above $113,400 with increased volume would signal a continuation toward higher resistance zones. Conversely, a breakdown below $109,300 would invalidate this structure and reinforce bearish sentiment.
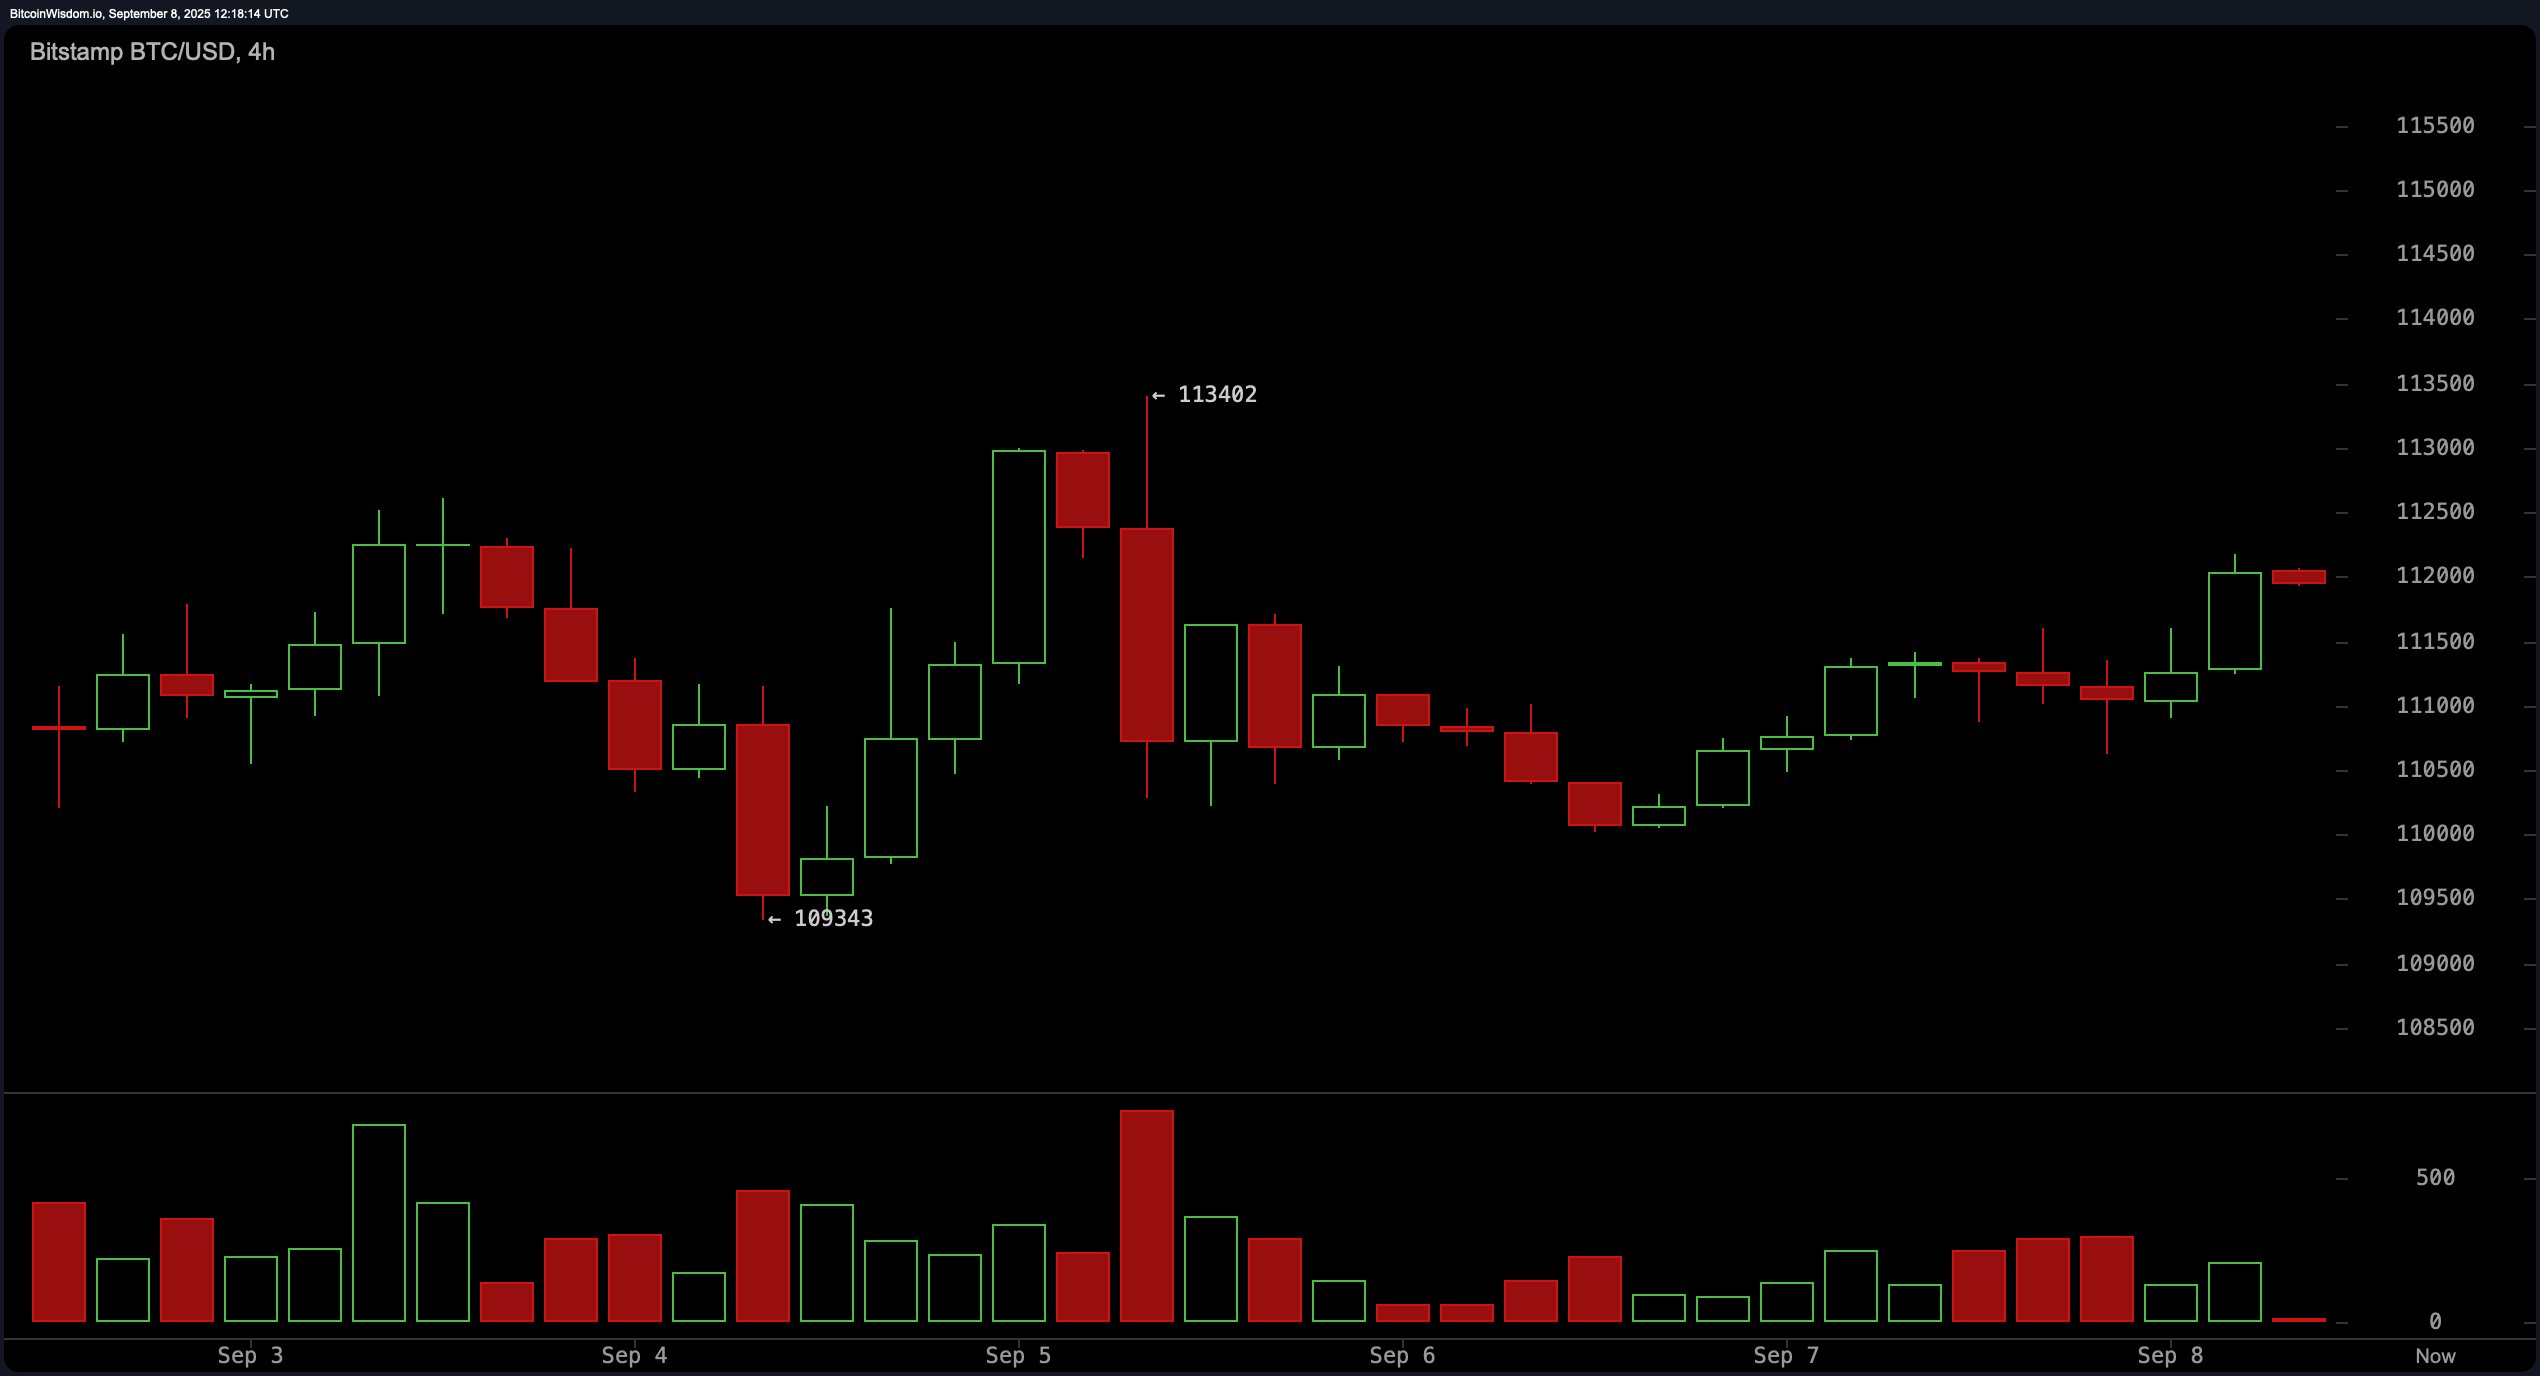
BTC/USD 4-hour chart via Bitstamp on Sept. 8, 2025.
Short-term momentum on the 1-hour chart remains bullish, as bitcoin forms higher highs and higher lows. The price is hovering near $112,000, potentially forming either a bullish flag or a double top pattern. Volume drop-off in this zone suggests buyer exhaustion or hesitation, reinforcing the need for confirmation before entering trades. A breakout above $112,200 on strong volume could open a quick path to $113,400, while a drop below $111,000 would mark a short-term trend reversal, signaling caution for intraday traders.
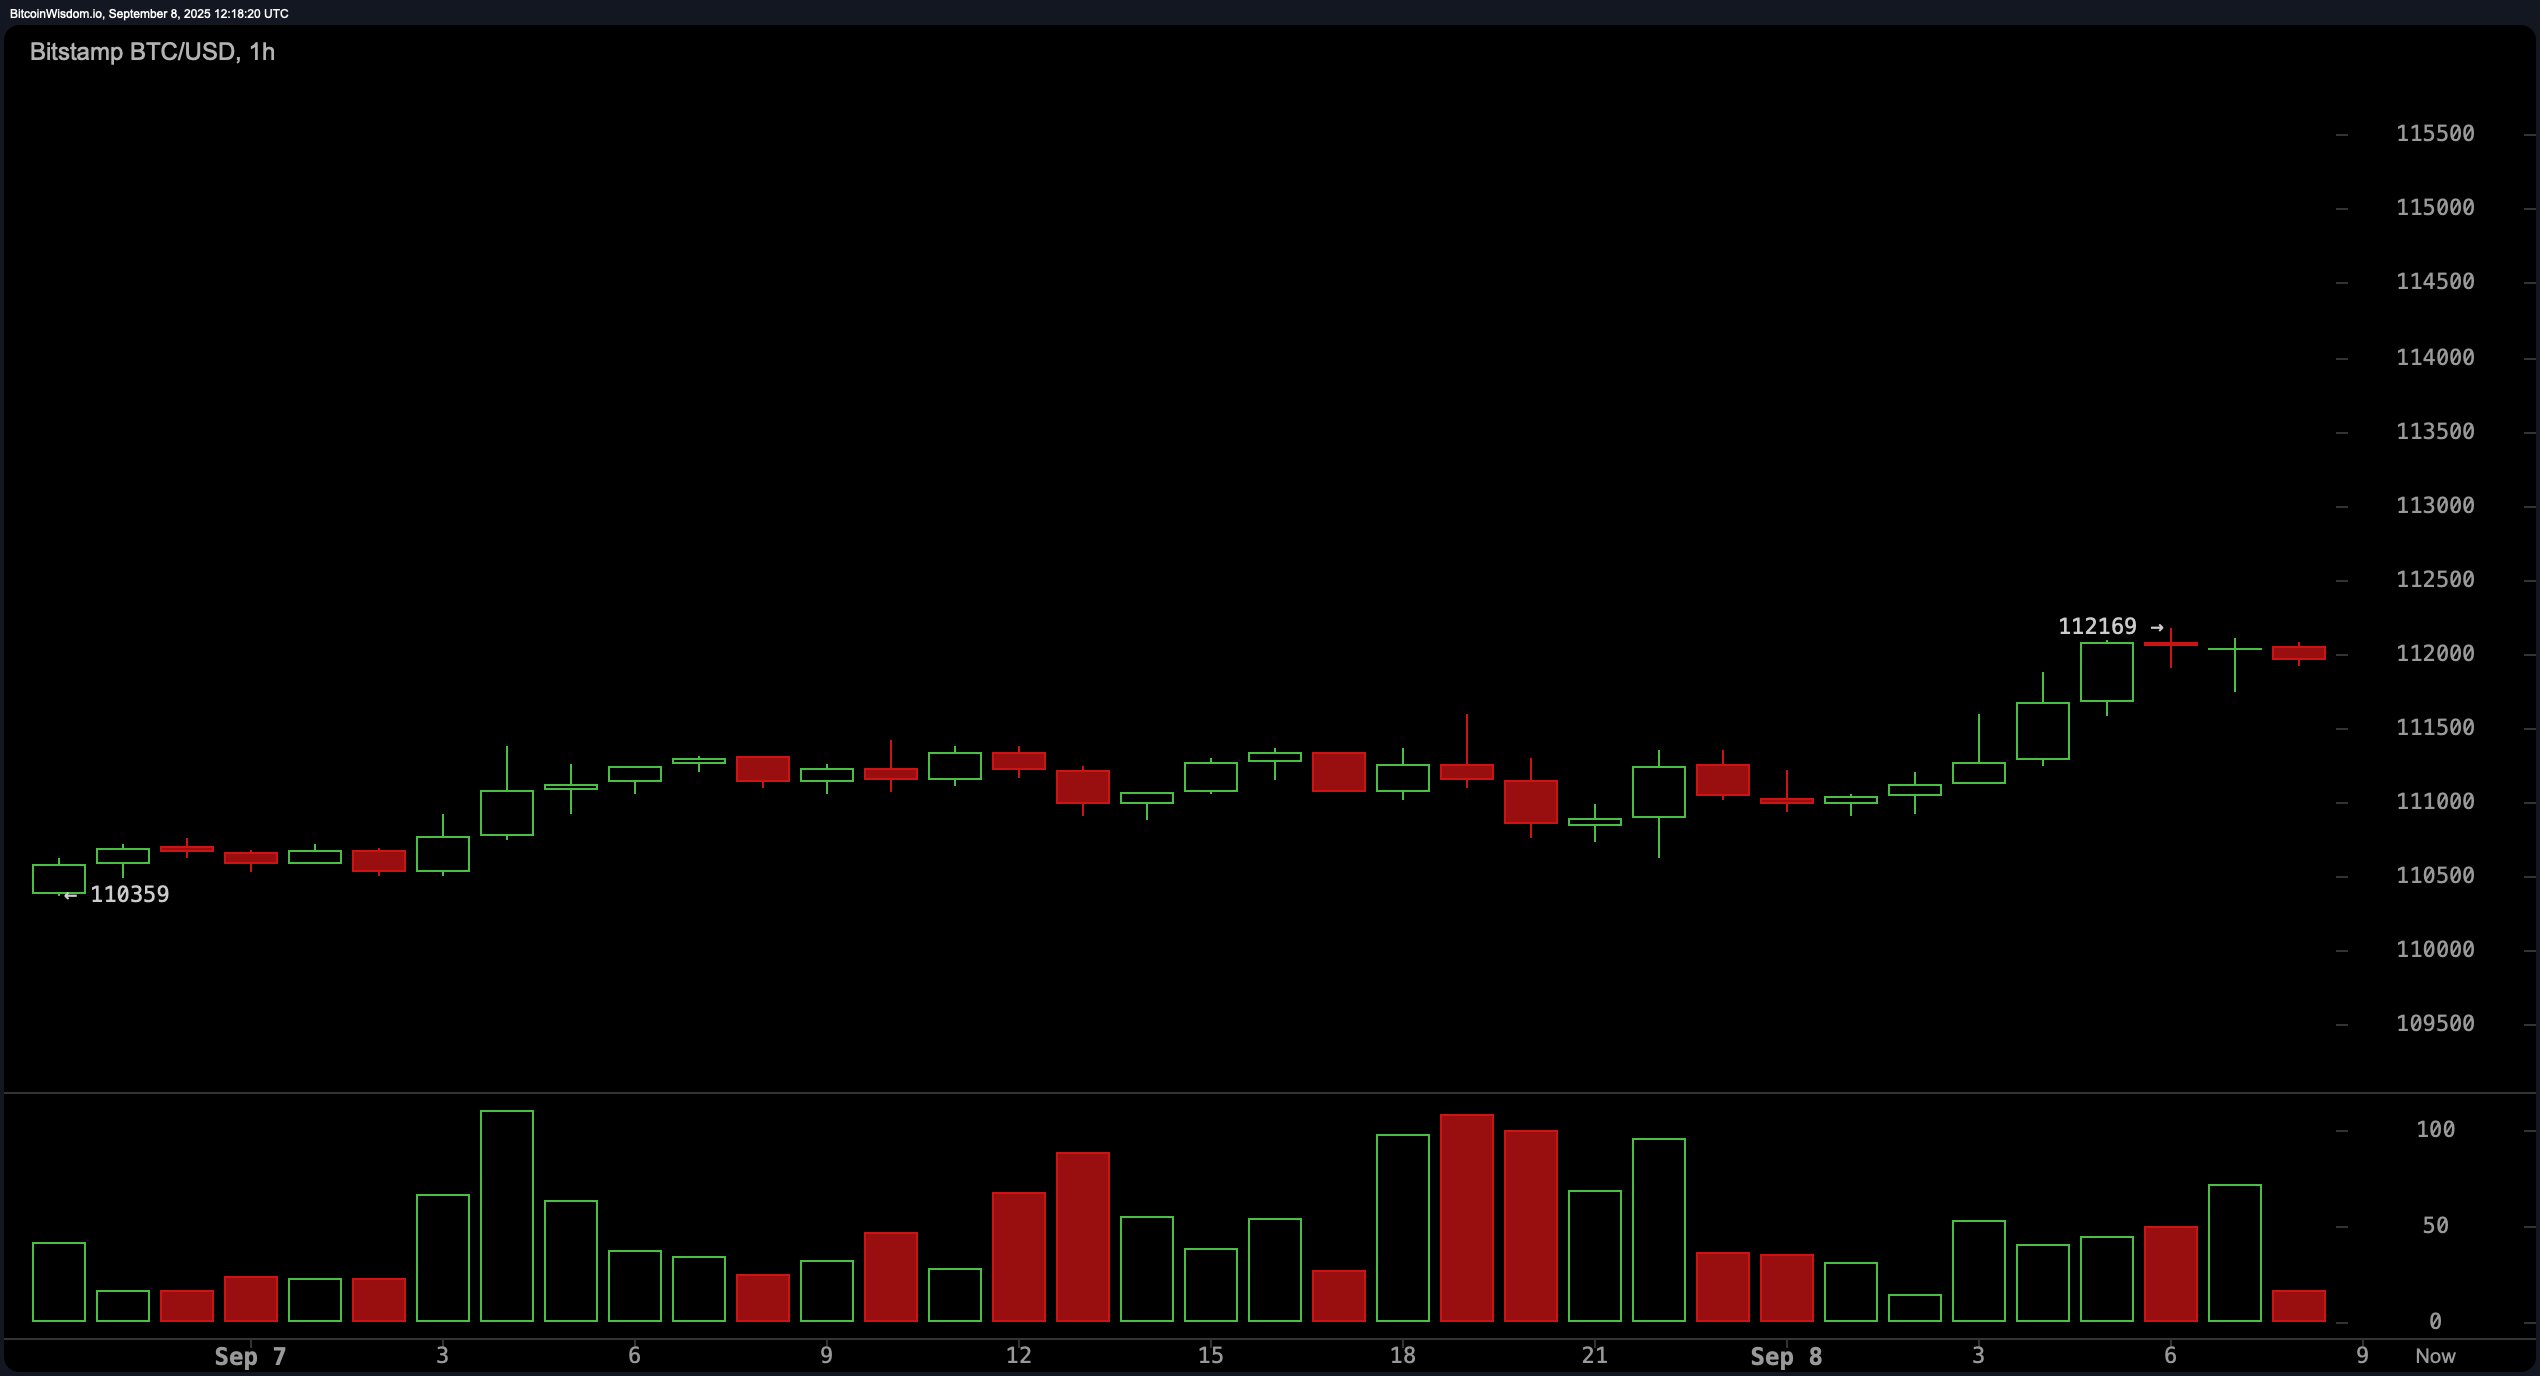
BTC/USD 1-hour chart via Bitstamp on Sept. 8, 2025.
Oscillator readings across the board reflect market indecision. The relative strength index (RSI) at 49, stochastic oscillator at 57, commodity channel index (CCI) at 5, average directional index (ADX) at 16, and awesome oscillator at −2,930 are all neutral, providing no definitive direction. However, the momentum indicator at 3,615 and the moving average convergence divergence (MACD) level at −1,170 both flash buy signals, hinting at latent upward energy in the price action that could manifest if volume picks up.
Moving average data delivers a nuanced picture. Short-term signals are skewing bullish, with both the 10-day and 20-day exponential and simple moving averages showing buy indications. In contrast, the 30-day and 50-day moving averages suggest selling pressure persists on broader horizons. The 100-day exponential moving average supports the bulls, while the 100-day simple moving average tilts bearish. Interestingly, both the 200-day exponential and simple moving averages point to sustained long-term bullishness, reflecting the underlying strength in bitcoin’s macro structure.
In summary, the technical landscape for bitcoin on September 8 remains cautiously optimistic with key resistance looming just above current price levels. Swing traders should await a confirmed close above $114,000 on high volume before entering new positions. Intraday participants can monitor breakout levels at $112,200 and $113,400 for potential scalping opportunities. Tight stop-loss placement remains essential, particularly below $111,000 and $109,300, to manage risk in this volatile environment.
Bull Verdict:
If bitcoin breaks decisively above the $113,400–$114,000 resistance zone on strong volume, the technicals support a bullish continuation toward the $117,000 level. Short-term moving averages and upward momentum indicators suggest latent strength, positioning bitcoin for a potential trend reversal and renewed upside.
Bear Verdict:
Failure to break above the $113,400–$114,000 resistance, coupled with declining volume and neutral oscillator signals, could reinforce a bearish scenario. A drop below key support at $111,000 or $109,300 would confirm bearish momentum, potentially driving bitcoin back toward the $107,000 support or lower.
免责声明:本文章仅代表作者个人观点,不代表本平台的立场和观点。本文章仅供信息分享,不构成对任何人的任何投资建议。用户与作者之间的任何争议,与本平台无关。如网页中刊载的文章或图片涉及侵权,请提供相关的权利证明和身份证明发送邮件到support@aicoin.com,本平台相关工作人员将会进行核查。


