The fluctuations in the cryptocurrency market are like the waves in a turbulent sea, making people feel anxious. However, its charm lies in the fact that it never looks at your past report card. Stop saying "I'll enter the market when it stabilizes"; opportunities in the crypto world never lie in "stability." The real dividends always belong to those who dare to position themselves amid uncertainty. Market volatility is not a risk; failing to understand the trend is the biggest risk.
After encountering resistance around $112,000, Bitcoin has retreated and failed to maintain its gains. The price is oscillating between $110,000 and $111,700, trading below the 100-hour moving average. Currently, the market for Bitcoin is in a sideways consolidation pattern, and as the market leader, its movement fully reflects the current market's struggle between macro uncertainty, institutional capital flow, and technical factors.
From a technical perspective, the support levels are at $110,500 (trendline support) and $110,000, which are key supports recently. If these levels are lost, it may drop to $109,350. The upper resistance levels are currently at $111,250 (immediate resistance) and $112,580. If the daily close can stabilize above $112,580, it may open up upward space. The indicators still show that the hourly MACD momentum is weakening, and KDJ is below 50, indicating a short-term bearish advantage. The daily MACD being below the zero line also confirms the current weak pattern.
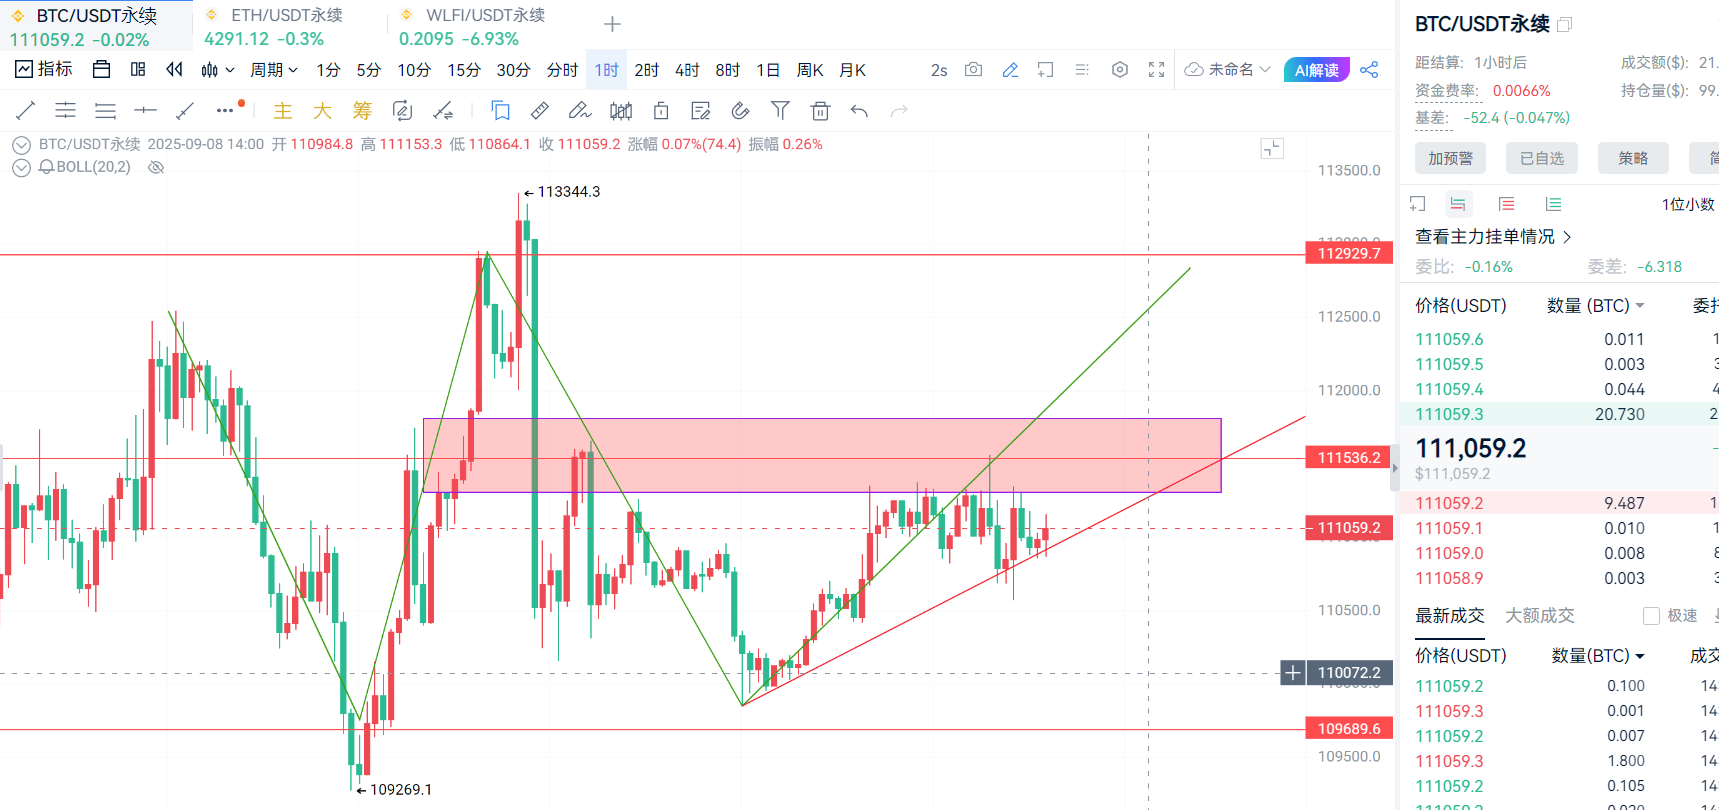
Suggested trading range for Bitcoin: If the price drops to the $109,200-$110,000 range and finds support, consider taking a small position for a rebound, with a stop loss set below $108,200, targeting $110,800 - $111,600.
Ethereum's short-term performance is weaker than Bitcoin's, mainly affected by ETF fund outflows and light trading in September. The price is oscillating within the range of $4,200 to $4,400.
From a technical perspective, the support levels at $4,250 - $4,215 (trendline support) are crucial. If it breaks below, it may retrace to the $4,050 - $4,000 range, or even test the mid-term key demand area at $3,800. The main resistance levels above are at $4,350 (100-hour moving average), $4,400 (maximum pain point for options), and $4,500. Only a breakthrough above $4,500 would challenge the historical high of $4,956. Currently, the short-term trend is in a low-level oscillation seeking direction, with the daily trend still leaning bearish but momentum weakening, showing a bullish engulfing pattern that suggests a possible reversal.
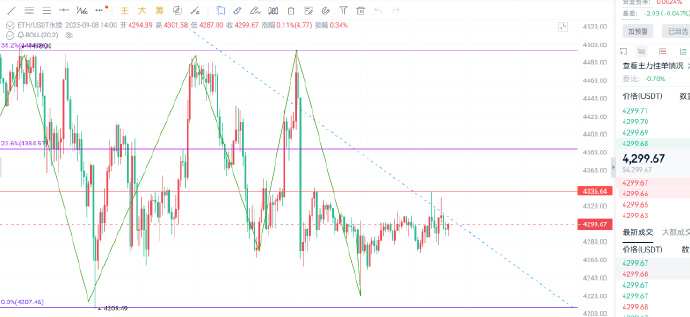
Suggested trading range for Ethereum: After stabilizing between $4,200-$4,250, consider positioning for a long, with a stop loss at $4,150 and a target of $4,350-$4,450.
Due to the time-sensitive nature of price points, there may be delays in post reviews; specific operations should be based on real-time market conditions. The above trading range analysis is for reference only; the cryptocurrency market is highly risky, so please make cautious decisions when investing. If you are interested in specific indicator analysis or the impact of new market dynamics on prices, feel free to scan the QR code for the public account in the article below. You are welcome to visit.

Warm reminder: The content of the above article is original by the author, and the advertisements at the end of the article and in the comments section are unrelated to the author; please be cautious in discerning!
免责声明:本文章仅代表作者个人观点,不代表本平台的立场和观点。本文章仅供信息分享,不构成对任何人的任何投资建议。用户与作者之间的任何争议,与本平台无关。如网页中刊载的文章或图片涉及侵权,请提供相关的权利证明和身份证明发送邮件到support@aicoin.com,本平台相关工作人员将会进行核查。