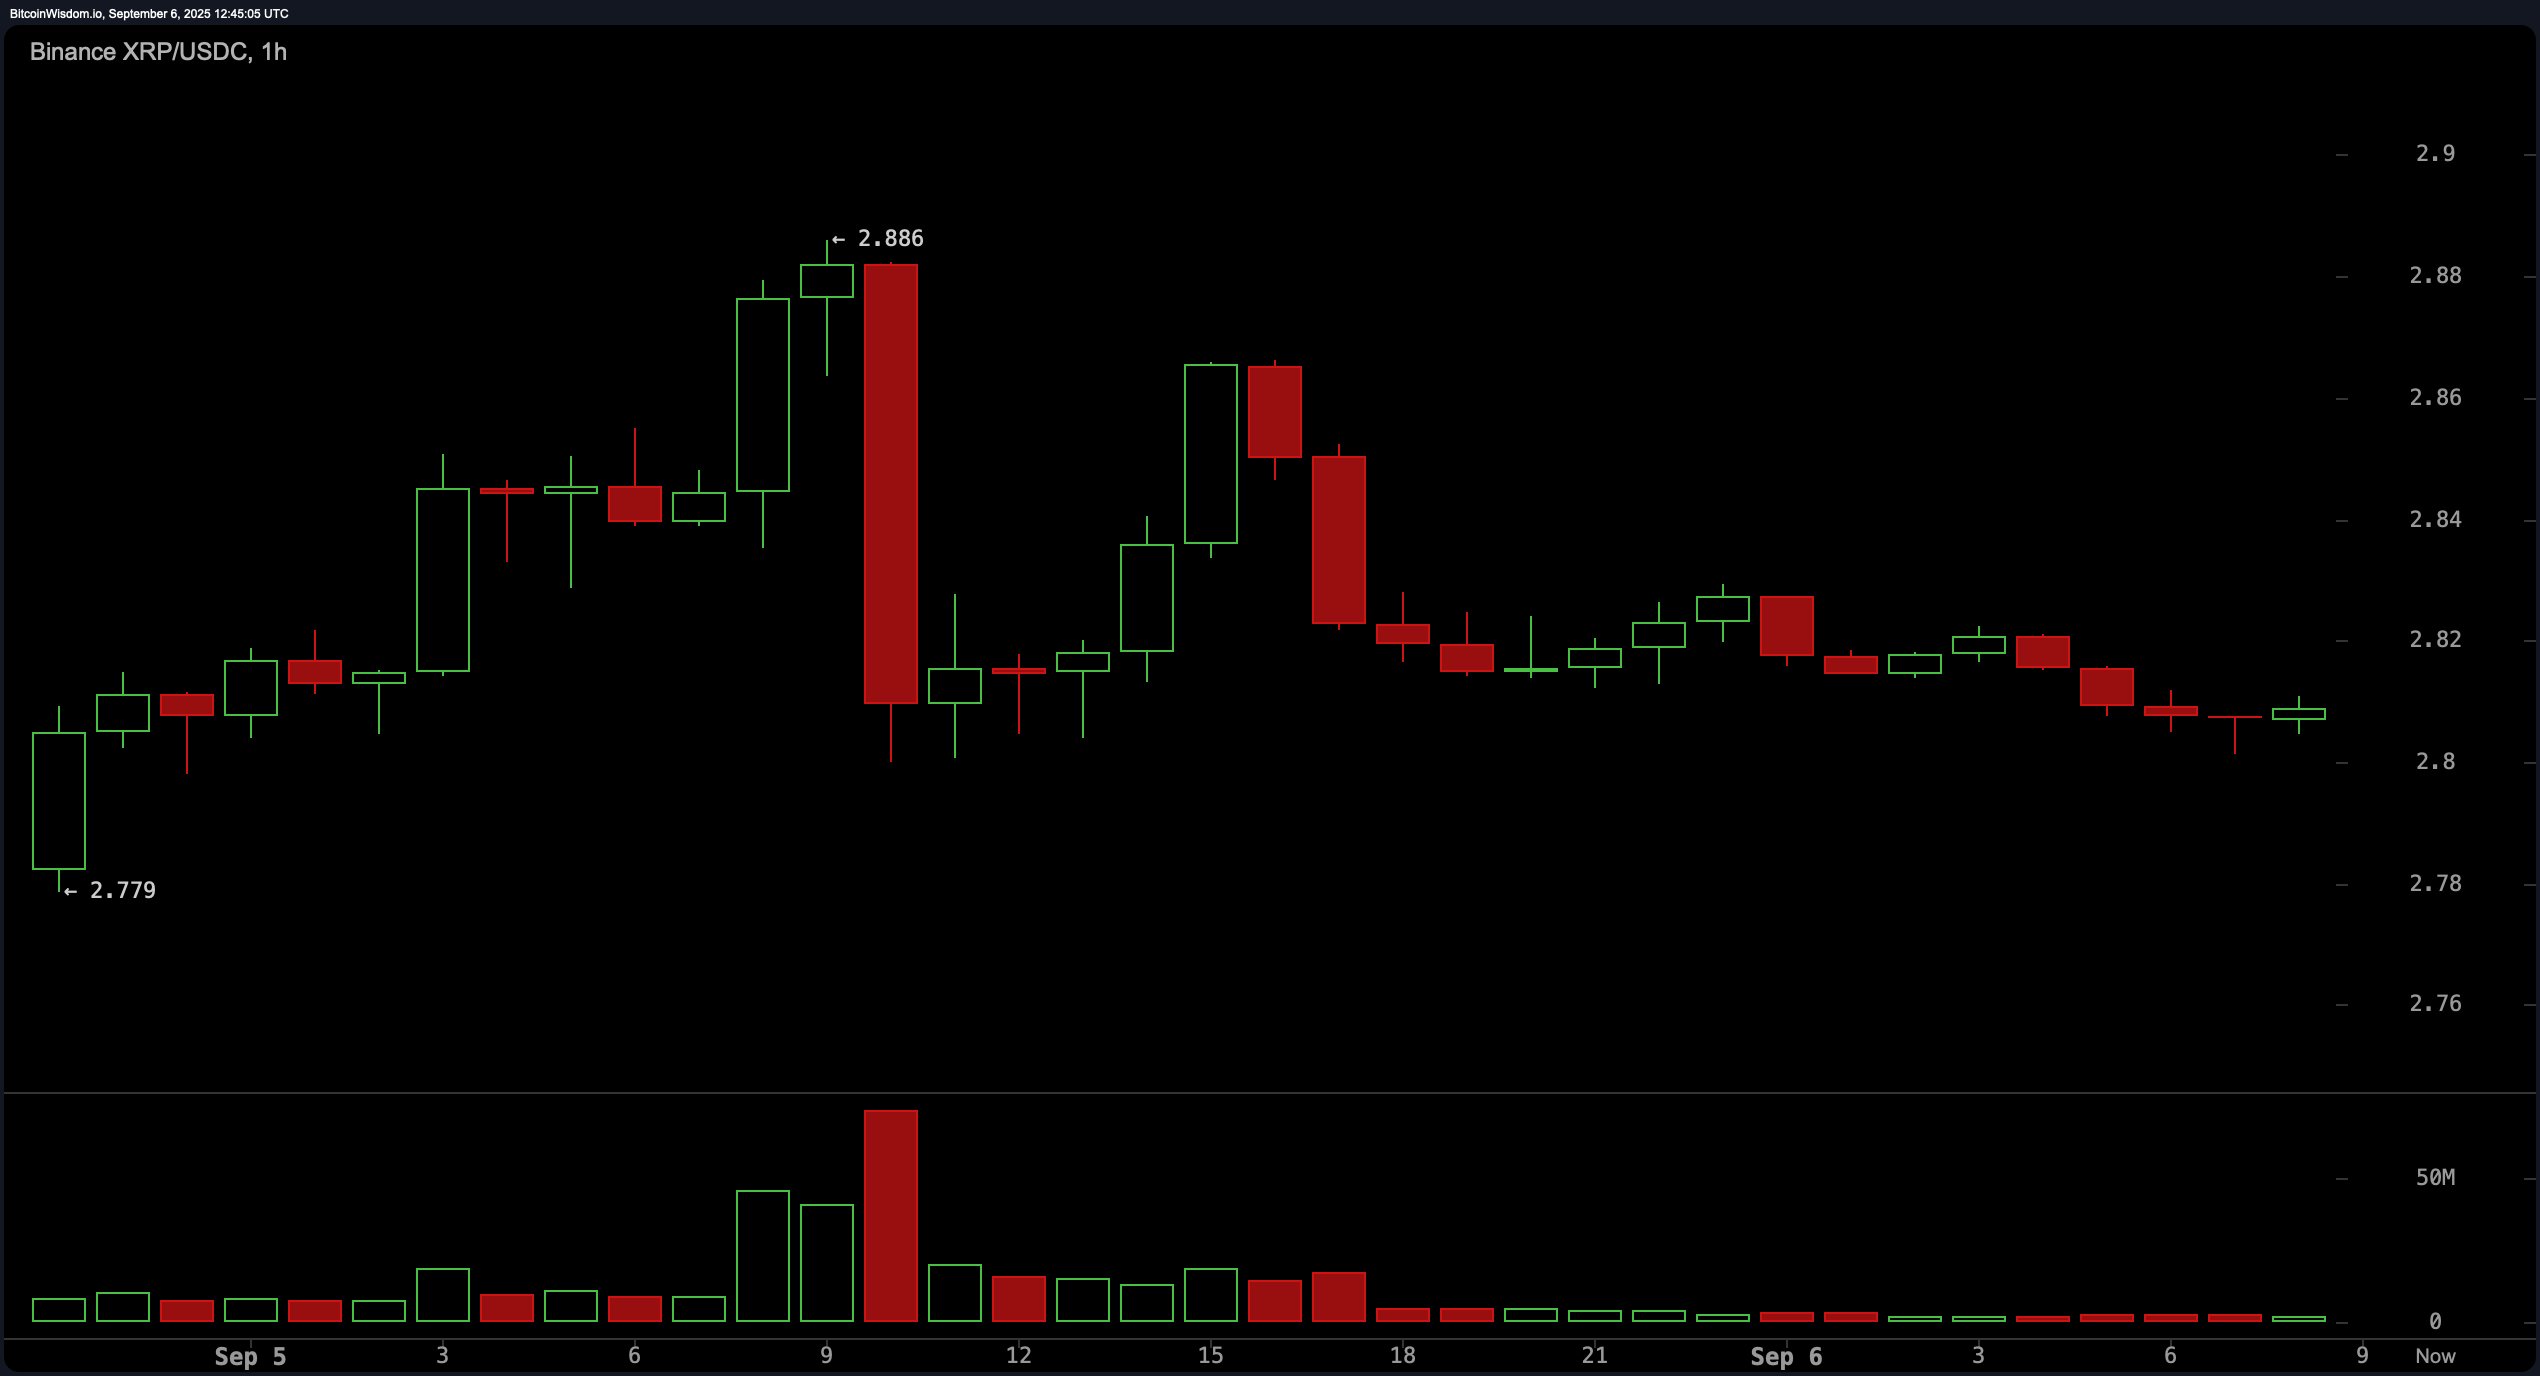
On the 1-hour chart, XRP shows a recent bearish engulfing pattern near the $2.886 level, signaling a short-term rejection of higher prices. The price has since drifted sideways, stabilizing around $2.80 with low volume, which suggests indecision and a lack of directional momentum. The overall lack of conviction calls for caution, especially without institutional volume support.

XRP/USDC via Binance 1-hour chart on Sept. 6, 2025.
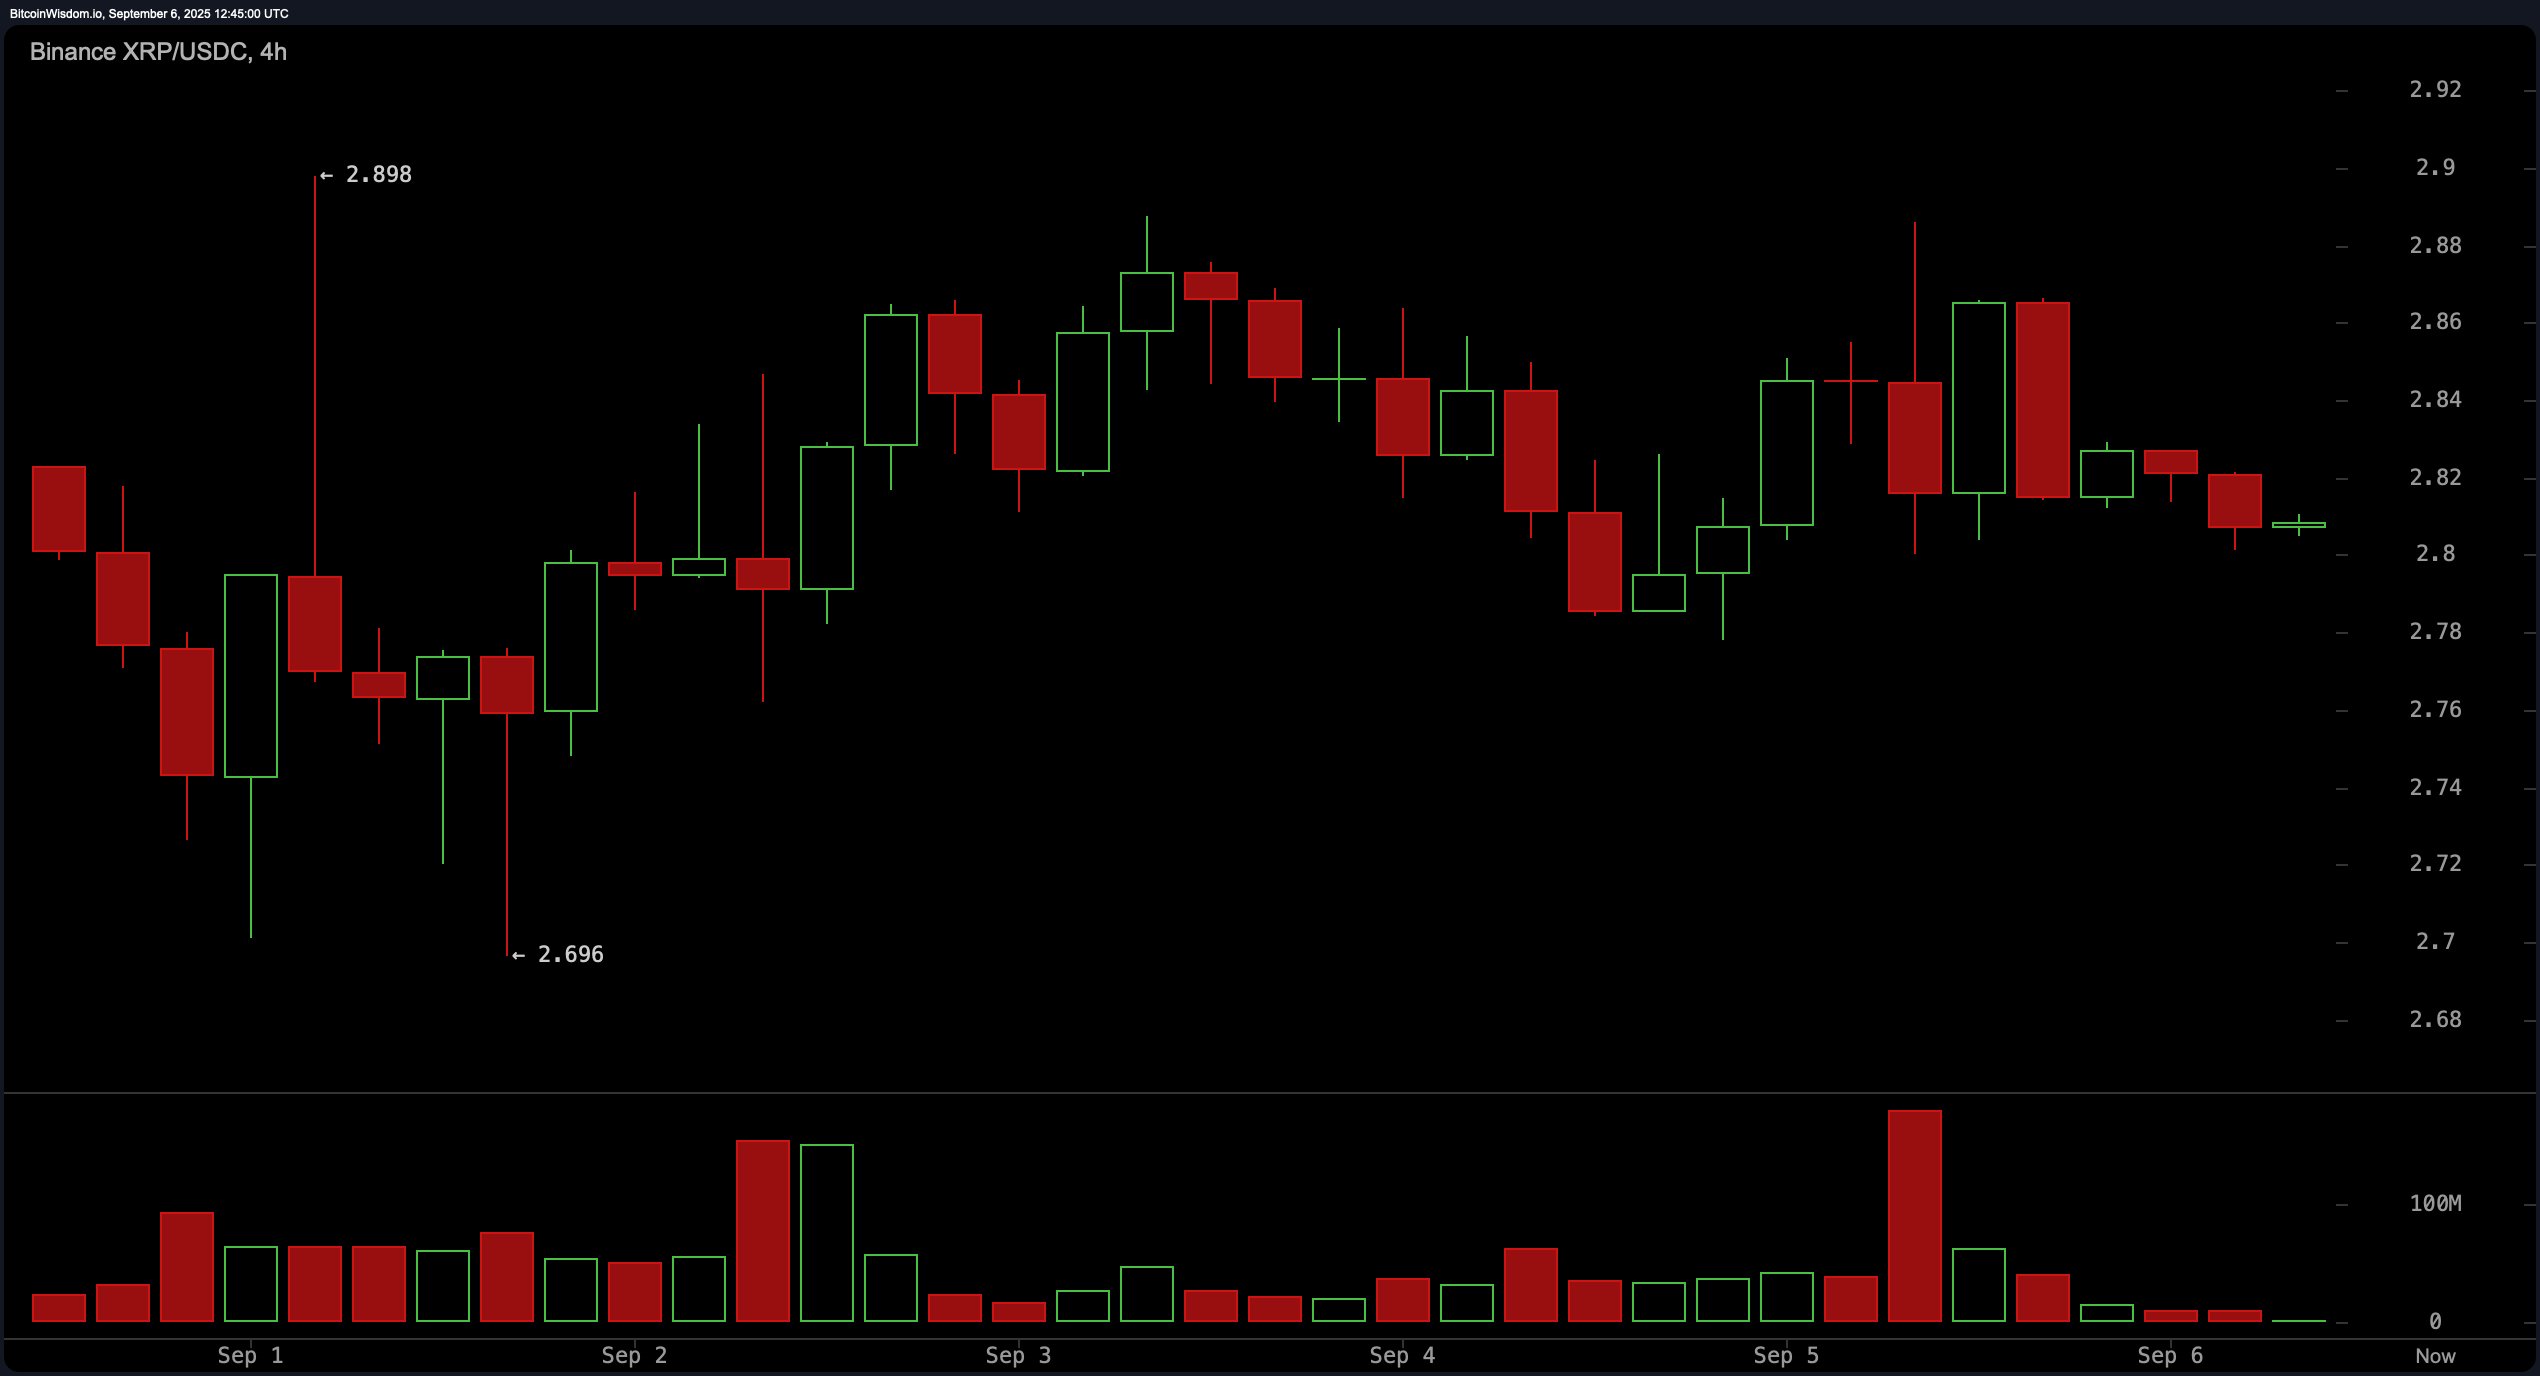
The 4-hour chart indicates a neutral-to-bearish stance with XRP capped at a swing high of $2.898. A series of small-bodied candles reflects market indecision, while a volume spike around Sept. 5 may represent a distribution phase or a stop-hunt. Resistance remains at $2.85 to $2.88, where traders should watch for potential rejection signals, such as doji formations or bearish divergence. This timeframe currently favors range trading strategies, as momentum remains subdued.

XRP/USDC via Binance 4-hour chart on Sept. 6, 2025.
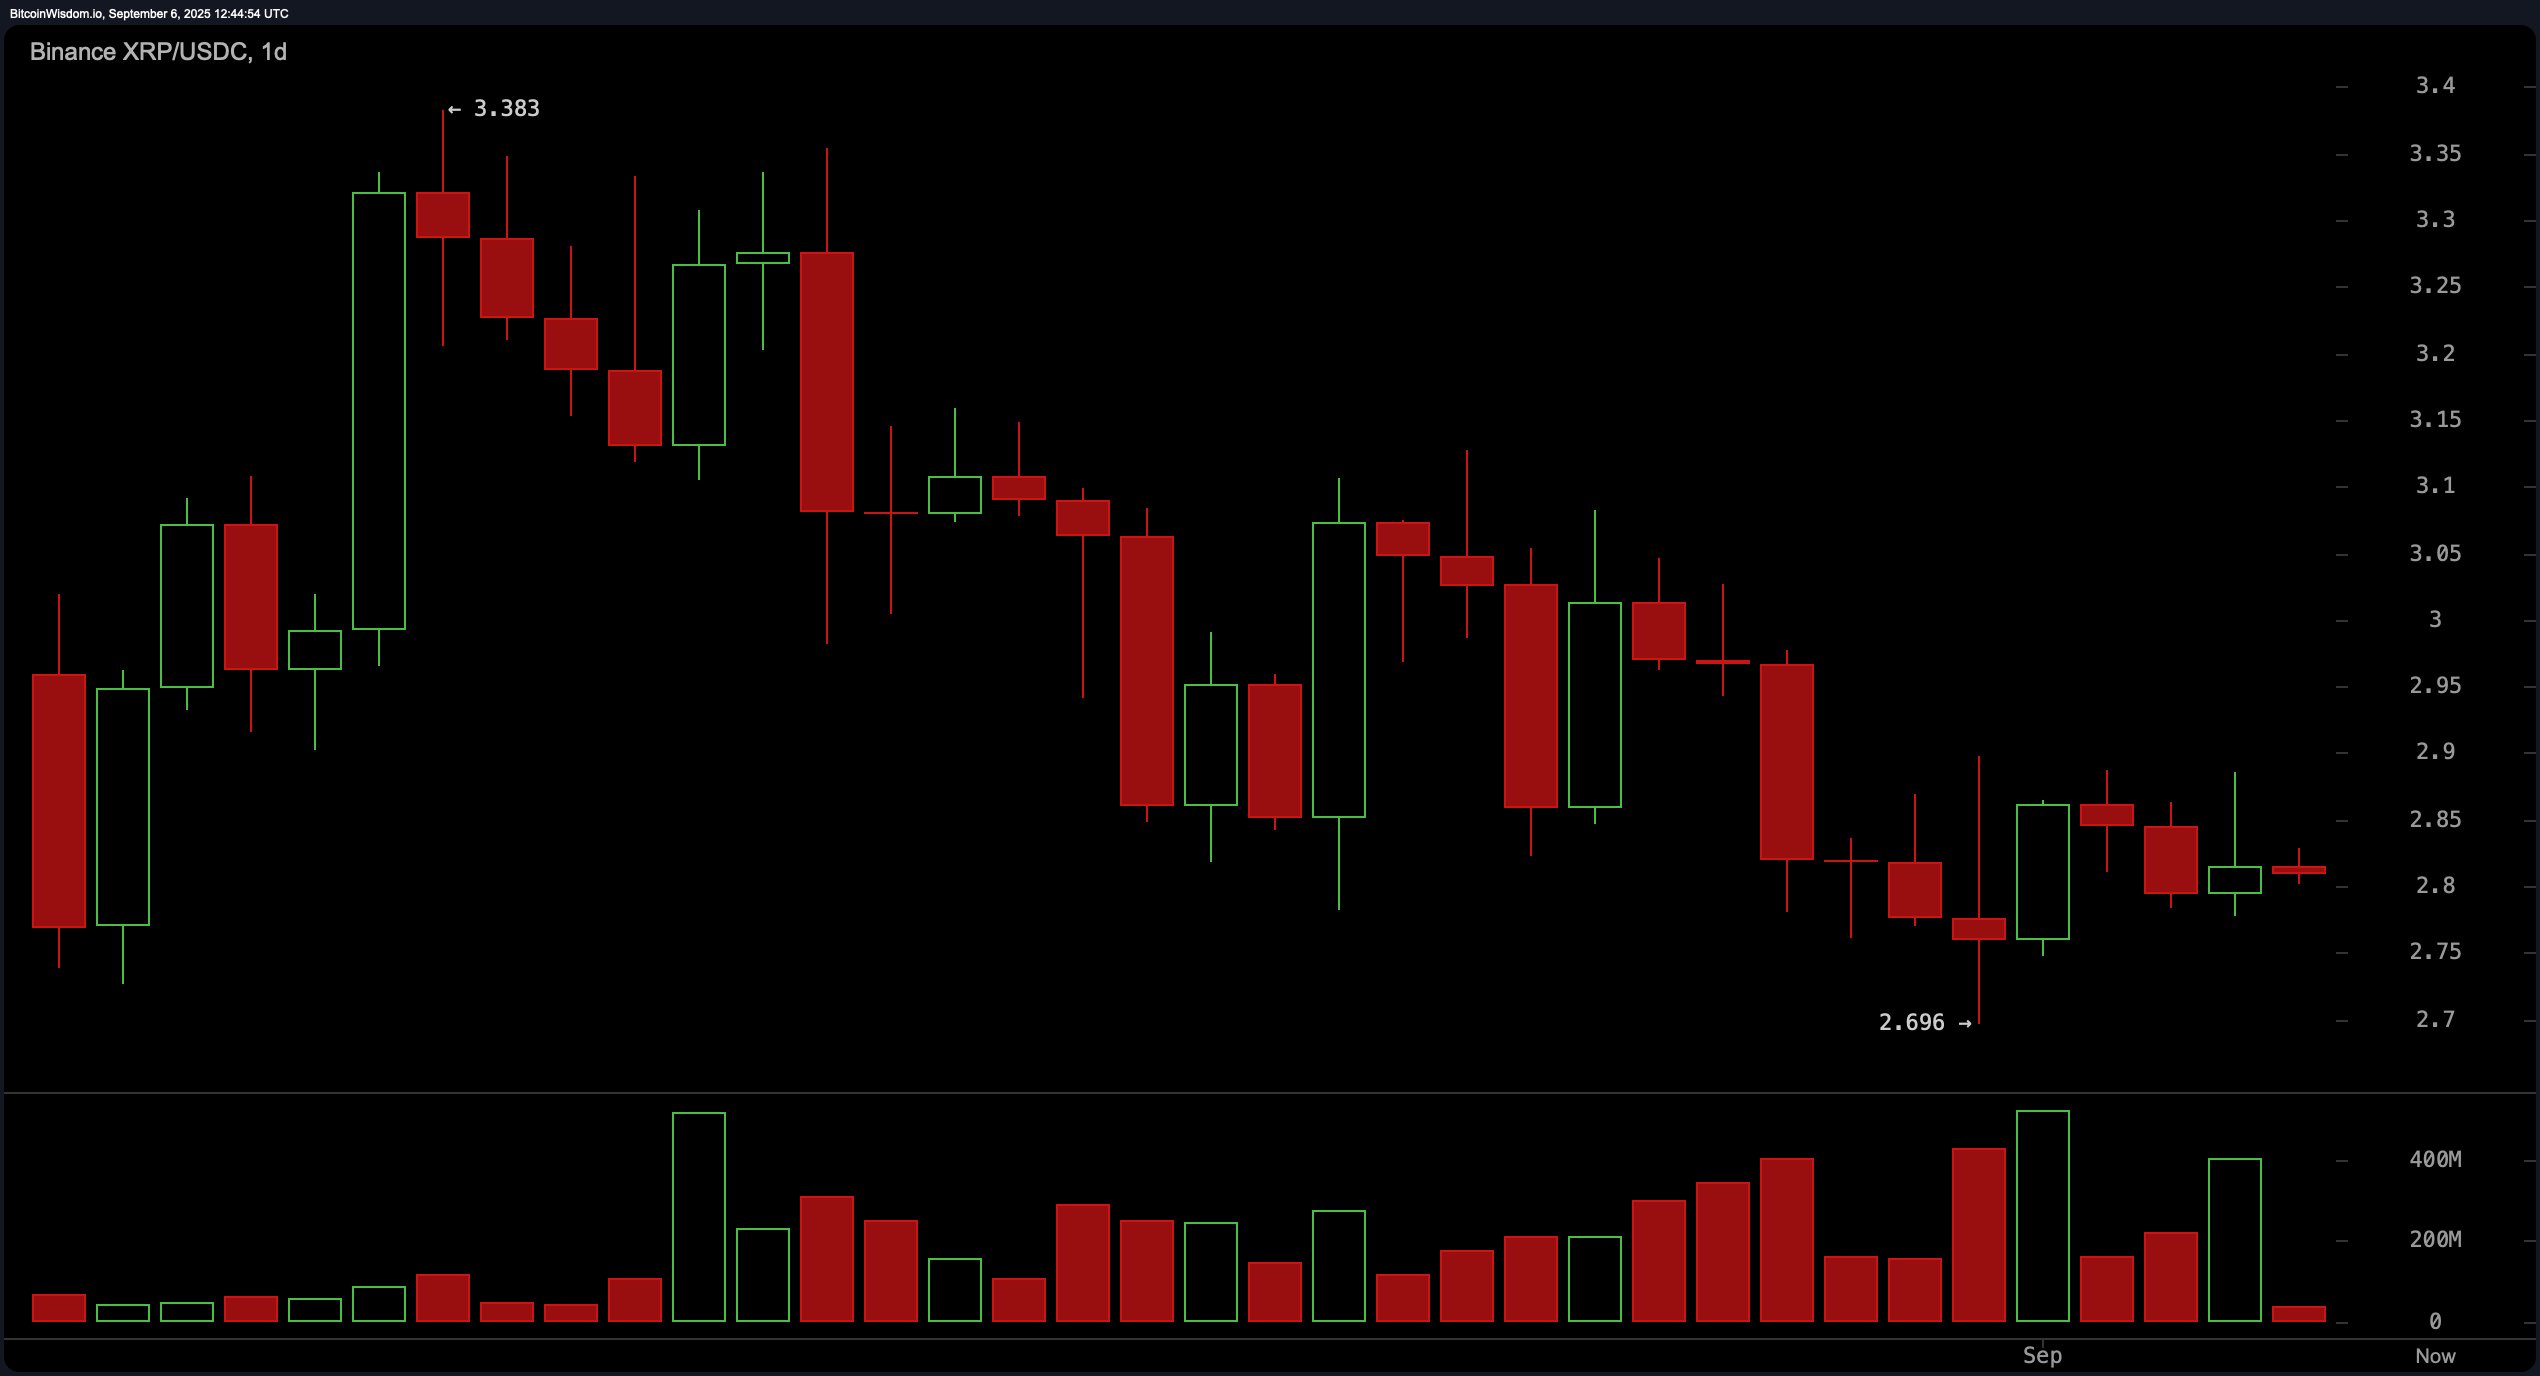
XRP’s daily chart reveals a macro downtrend with consistent lower highs and lower lows, tracing back from a swing high near $3.383 to current levels around $2.80. The price is approaching a key support zone between $2.70 and $2.75, a historically reactive level that could attract buyers if a bullish reversal pattern, such as a hammer or bullish engulfing candle, materializes. Volume has tapered off after previous spikes at swing levels, indicating a potential consolidation phase or exhaustion of selling pressure. Resistance lies in the $2.95 to $3.05 range, aligning with prior failed bounces and a former consolidation zone. Any bullish sentiment should be confirmed by a breakout above $2.90 with rising volume to avoid false breakouts.

XRP/USDC via Binance daily chart on Sept. 6, 2025.
Oscillator readings as of Sept. 6 suggest a predominantly neutral market stance. The relative strength index (RSI) sits at 43.43, while the Stochastic oscillator is at 25.55—both signaling a lack of momentum. The commodity channel index (CCI) at -76.25 and the average directional index (ADX) at 19.52 reinforce the current indecision. The Awesome oscillator prints a mildly negative value of -0.180, further indicating weak momentum. Only the momentum indicator provides a positive signal at -0.161, while the moving average convergence divergence (MACD) level at -0.063 gives a bearish signal, pointing to conflicting momentum data and highlighting the need for traders to seek confirmation through volume and price action before initiating positions.
Moving averages (MAs) across multiple timeframes offer a mixed outlook, with a heavier tilt toward bearish sentiment in the short term. Both the 10-period exponential moving average (EMA) at $2.84 and the 10-period simple moving average (SMA) at $2.83 give bearish readings. Similarly, 20, 30, and 50-period EMAs and SMAs all reflect mounting selling pressure, suggesting downward bias over short to mid-term trends. However, the 100-period EMA and SMA at $2.77 and $2.69, respectively, alongside the 200-period EMA and SMA at $2.52 and $2.48, signal a longer-term bullish support base. This divergence between short-term bearishness and long-term support may set the stage for significant price action should volume return to the market.
Bull Verdict:
If XRP maintains support above $2.75 and buyers step in with confirmation from volume and bullish candlestick patterns, the asset could rebound toward the $2.95–$3.05 resistance zone. A decisive breakout above $2.90, supported by strengthening momentum and trend confirmation from longer-term moving averages, would reinforce a bullish continuation scenario.
Bear Verdict:
If XRP fails to hold the $2.75 support zone and breaks below $2.69 with increasing volume, it may trigger a broader sell-off. The prevailing bearish short-term trend, combined with dominant sell signals from most short- and mid-term moving averages, suggests further downside risk unless significant buying interest reemerges.
免责声明:本文章仅代表作者个人观点,不代表本平台的立场和观点。本文章仅供信息分享,不构成对任何人的任何投资建议。用户与作者之间的任何争议,与本平台无关。如网页中刊载的文章或图片涉及侵权,请提供相关的权利证明和身份证明发送邮件到support@aicoin.com,本平台相关工作人员将会进行核查。


