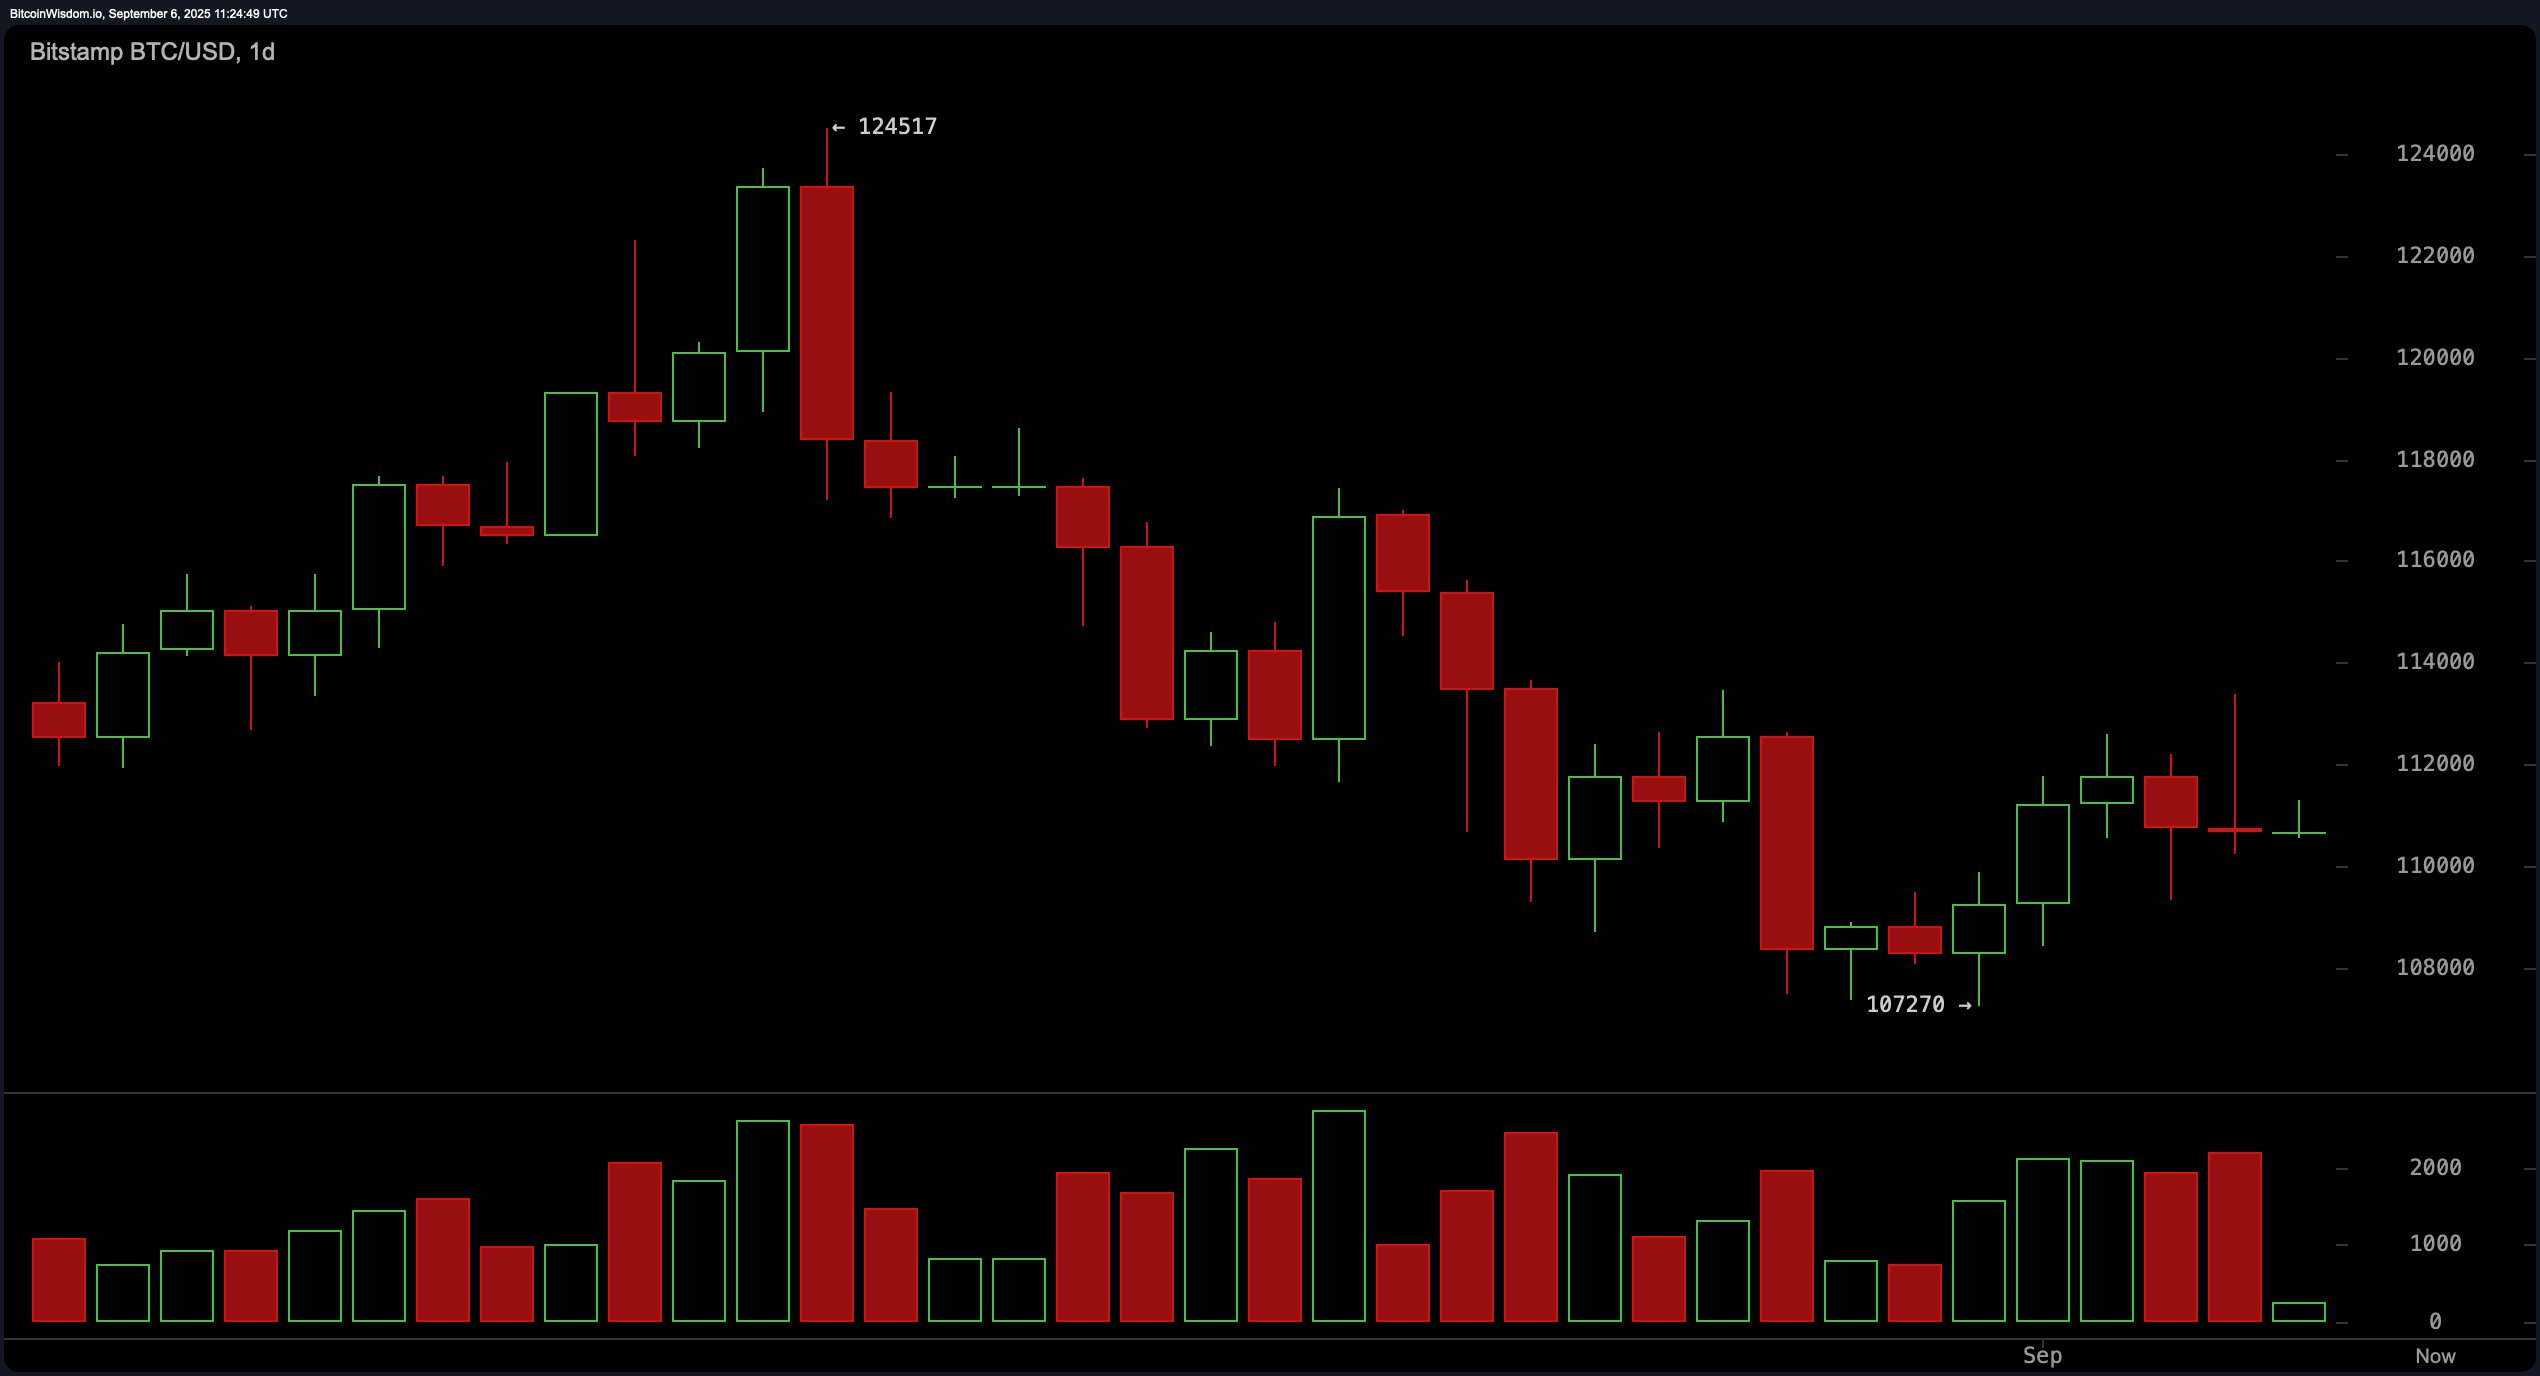
On the daily chart, structure remains defined by a sequence of lower highs and lower lows, with a swing high at 124,517 and a swing low at 107,270. The recent bounce from around 107,270 stalled near the $112,000 area, and a prior volume spike into the peak suggests distribution. The directional bias is bearish unless price can break convincingly above $112,500–$113,000 on strong volume, a region that caps rallies for now.

BTC/USD 1-day chart via Bitstamp on Sept. 6, 2025.
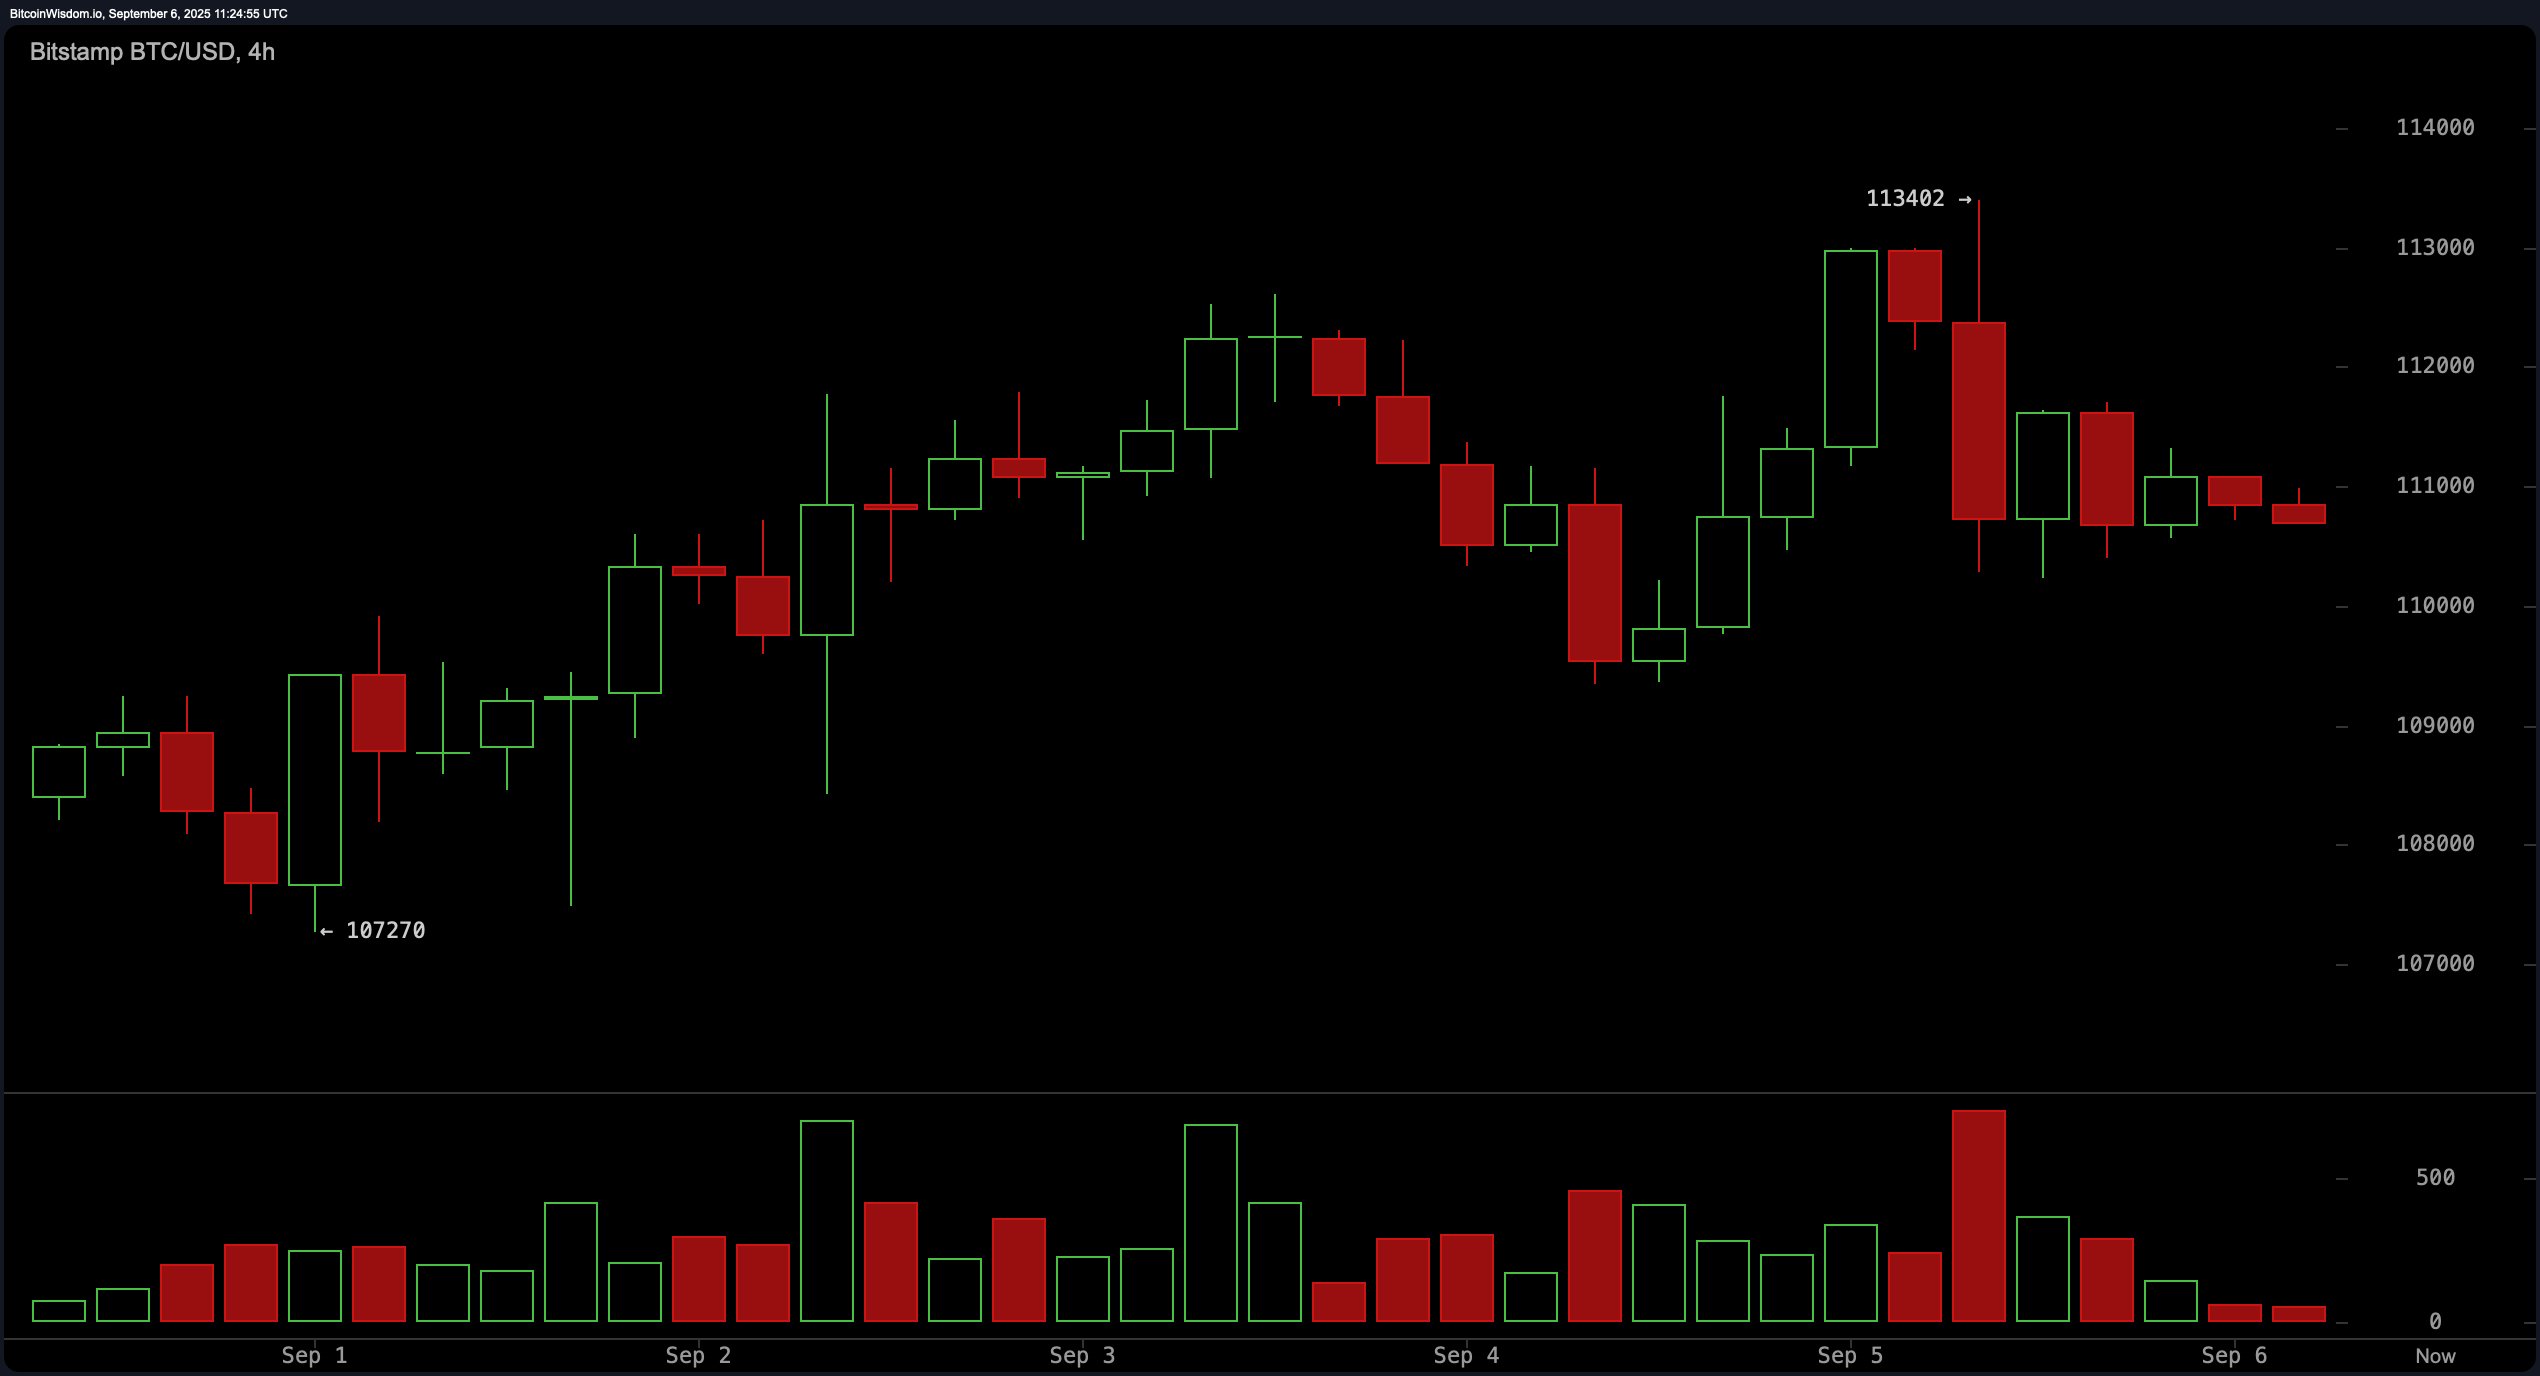
The 4-hour chart highlights 107,270 as durable support and 113,402 as a short-term peak repeatedly rejected, reflecting persistent supply. Price is consolidating just below 111,000 in a tight range after a large red candle on high volume from that 113,402 rejection, which constitutes a strong sell signal in this timeframe. The analysis flags 112,000–113,400 as a key resistance band to monitor for failure.

BTC/USD 4-hour chart via Bitstamp on Sept. 6, 2025.
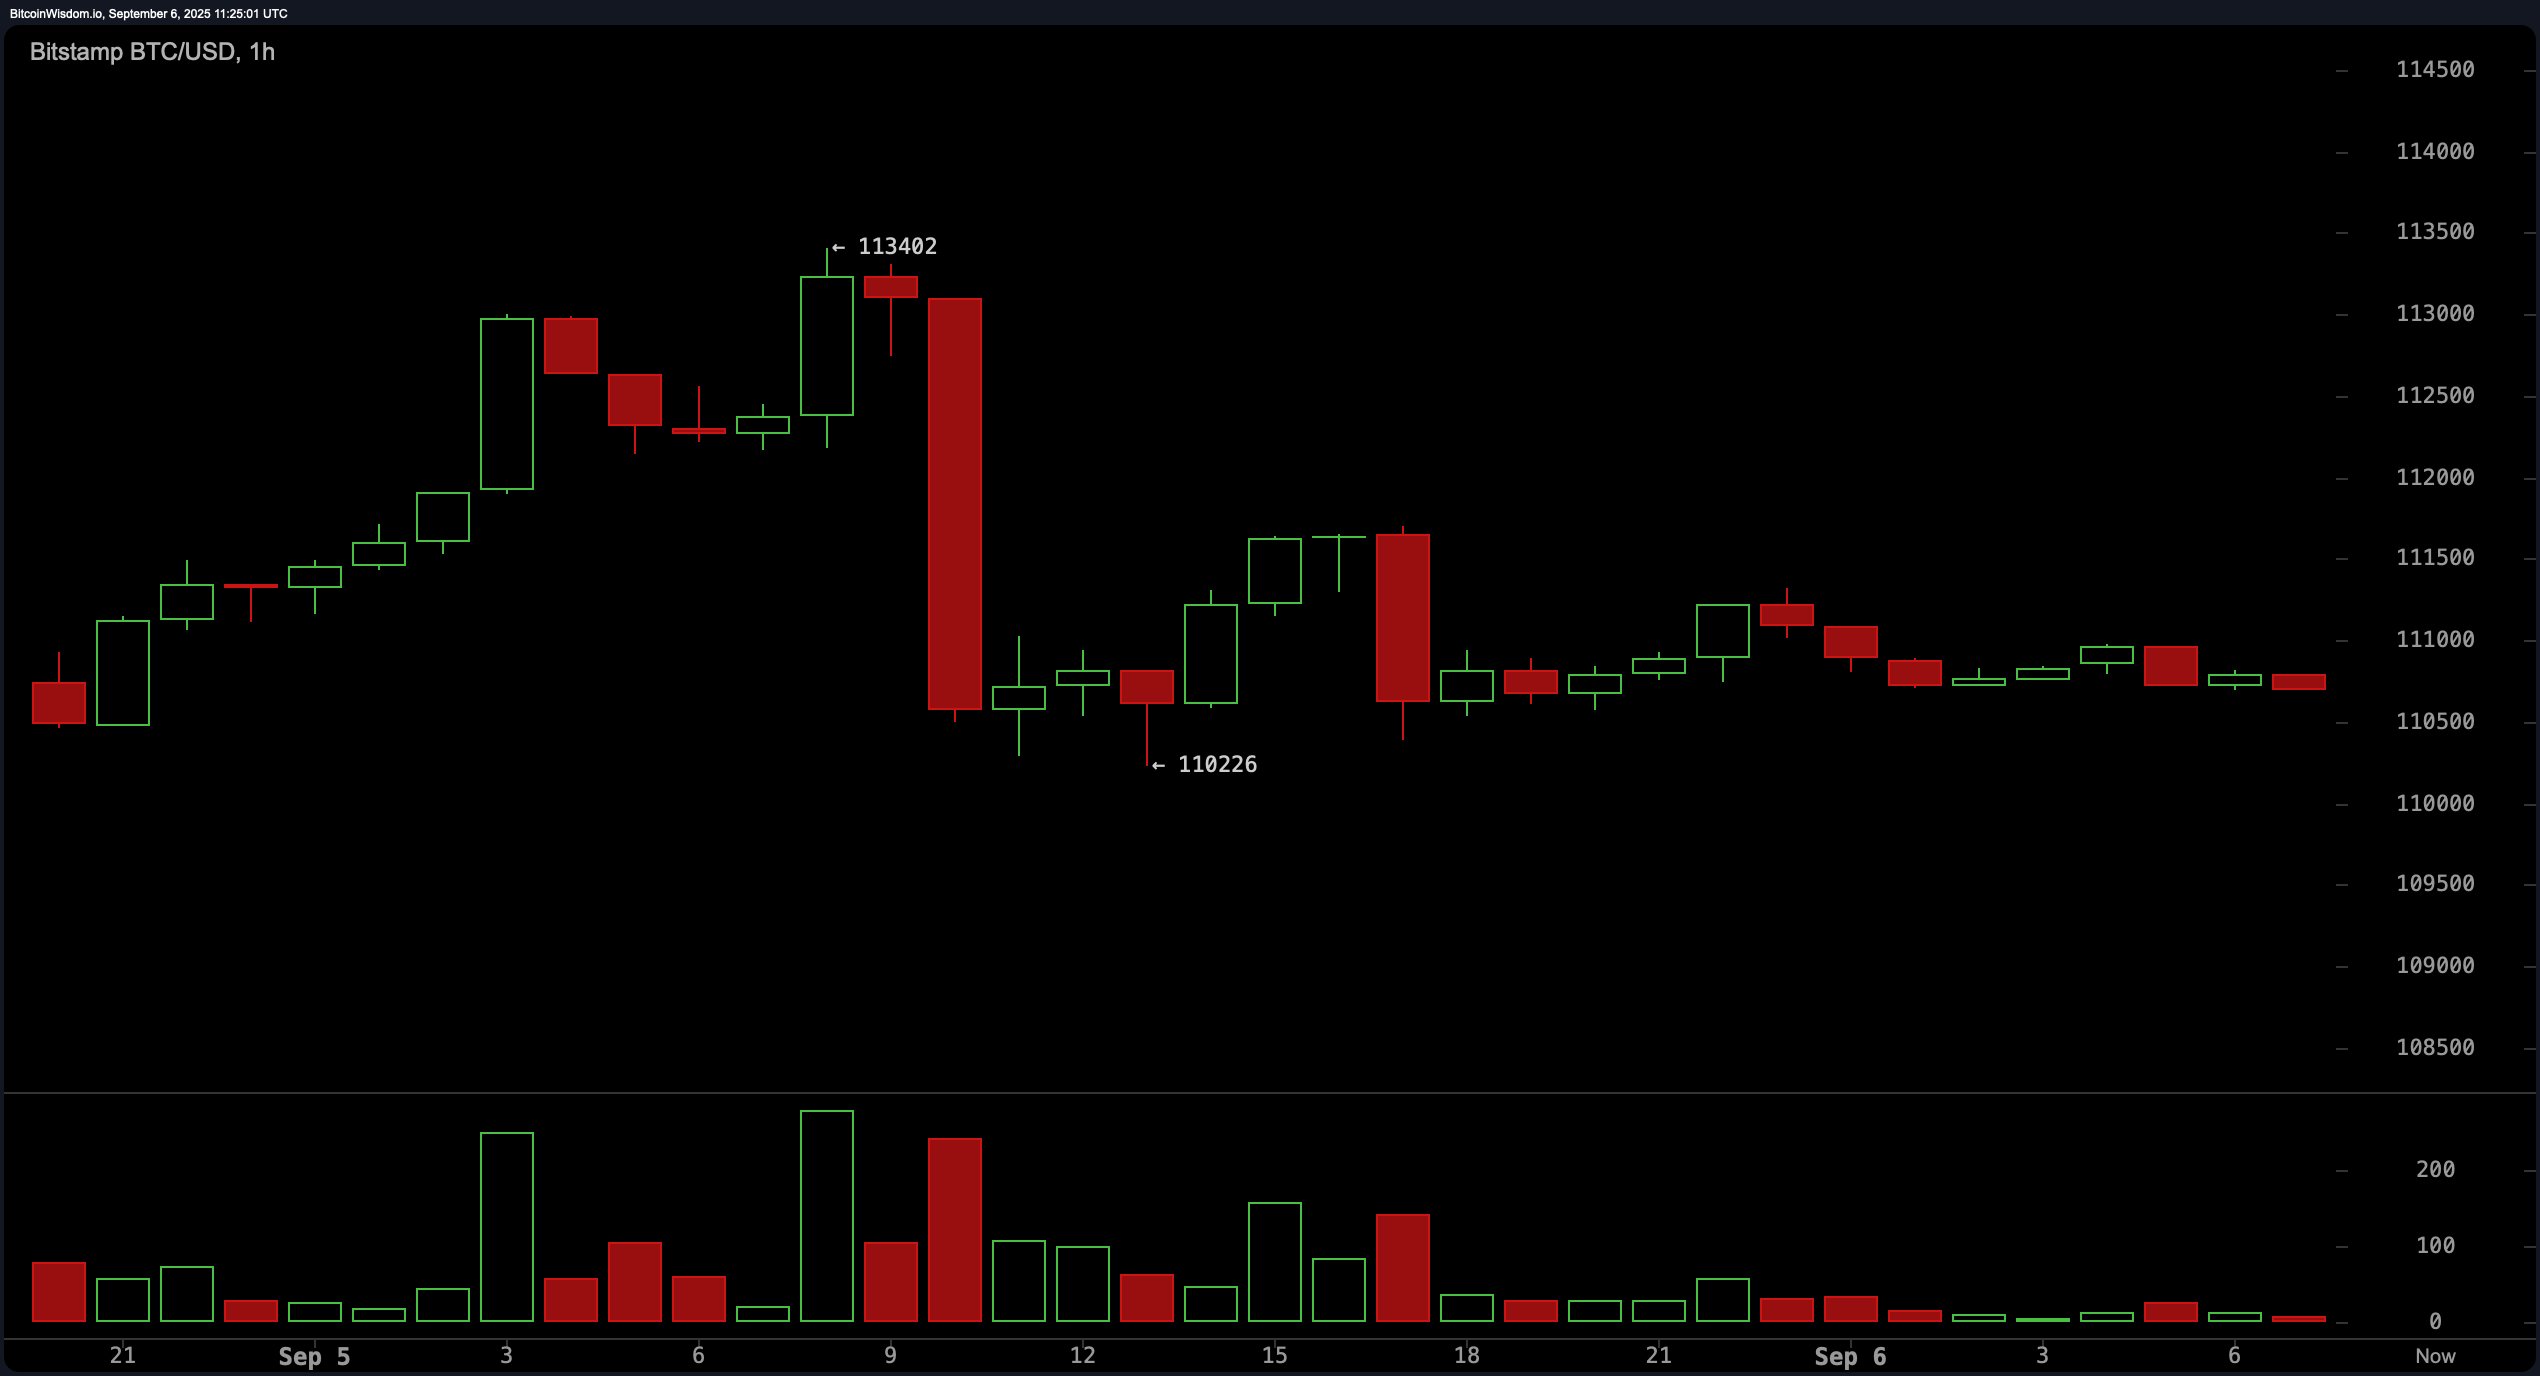
On the 1-hour chart, price slumped from 113,402 to roughly 110,226 and has since chopped sideways without clear bullish volume. The intraday structure shows lower highs with a relatively flat support zone near 110,500, shaping a bearish descending triangle that typically resolves lower. A breakdown through 110,200–110,000 would raise odds of a return to the 107,270 daily support level if sellers press the advantage.

BTC/USD 1-hour chart via Bitstamp on Sept. 6, 2025.
Oscillators are mixed to neutral overall. The relative strength index (RSI) prints 44.6 (Neutral), Stochastic oscillator 36.7 (Neutral), commodity channel index (CCI) −36.5 (Neutral), average directional index (ADX) 17.4 (Neutral), and awesome oscillator (AO) −3,197.9 (Neutral). Momentum (MOM) is −578.0 (Bullish), and the moving average convergence divergence (MACD) level is −1,427.9 (Bullish). This configuration indicates subdued trend strength with two upside signals emerging against otherwise neutral readings.
Moving averages skew bearish from short to intermediate horizons. The exponential moving average (EMA) (10) is $110,877.5 (Bearish) while the simple moving average (SMA) (10) is $110,238.6 (Bullish). EMA (20) at $111,966.6 (Bearish) and SMA (20) at $111,860.7 (Bearish) align with EMA (30) at $112,763.3 (Bearish) and SMA (30) at $114,088.8 (Bearish). EMA (50) $113,094.4 (Bearish), SMA (50) $115,177.8 (Bearish), EMA (100) $110,755.1 (Bearish), and SMA (100) $111,846.1 (Bearish) extend the bearish tilt, while EMA (200) $104,458.4 (Bullish) and SMA (200) $101,689.8 (Bullish) point to long-term support.
Bull Verdict:
If bitcoin can reclaim and hold above the $113,000 resistance with rising volume, oscillators such as the momentum (MOM) and moving average convergence divergence (MACD) suggest upside continuation is possible. A breakout could open the path toward retesting the all-time high set in mid-August, with strong support from the 200-day moving averages providing a favorable long-term backdrop.
Bear Verdict:
Failure to clear $113,000–$113,400 would keep the bearish structure intact, with the descending patterns on lower timeframes pointing toward renewed downside. A breakdown below $110,000 could accelerate losses back to $107,270, exposing bitcoin to further selling pressure as the daily trend and the majority of moving averages lean decisively bearish.
免责声明:本文章仅代表作者个人观点,不代表本平台的立场和观点。本文章仅供信息分享,不构成对任何人的任何投资建议。用户与作者之间的任何争议,与本平台无关。如网页中刊载的文章或图片涉及侵权,请提供相关的权利证明和身份证明发送邮件到support@aicoin.com,本平台相关工作人员将会进行核查。


