【Price Trend Analysis】
- Candlestick Pattern:
Recently, in the 4-hour cycle, the price quickly fell back to around 110716 after reaching a high of 112354, forming a significant long upper shadow bearish candlestick, indicating heavy selling pressure above.
The daily level shows a trend of oscillating downward, with high points gradually decreasing and low points also moving down, indicating a short-term weak consolidation.
Technical Indicators:
MACD: In the 4-hour cycle, both DIF and DEA are near the zero axis, but DIF is turning downwards, and the green bars are expanding, indicating that short-term bearish strength is dominant.
RSI: Current value is 50.04, close to the neutral zone, with no obvious overbought or oversold signals, but overall it has retreated from a high position, indicating weakened momentum.
EMA: The price is currently running below EMA7 (111210), and EMA30 (110766) provides some support for the price. If it breaks below EMA30, it may further test EMA120 (112148).
Trading Volume:
The 4-hour trading volume significantly increased at 20:00 on September 5, reaching 9806, accompanied by a rapid price drop, indicating a clear sign of bullish funds exiting.
Subsequently, trading volume gradually shrank, and market sentiment became more cautious, with the short-term direction yet to be clearly defined.
【Trading Strategy Analysis and Optimization Suggestions】
Operation Direction
Price Level (USDT)
Technical Basis
Assessment and Optimization Suggestions
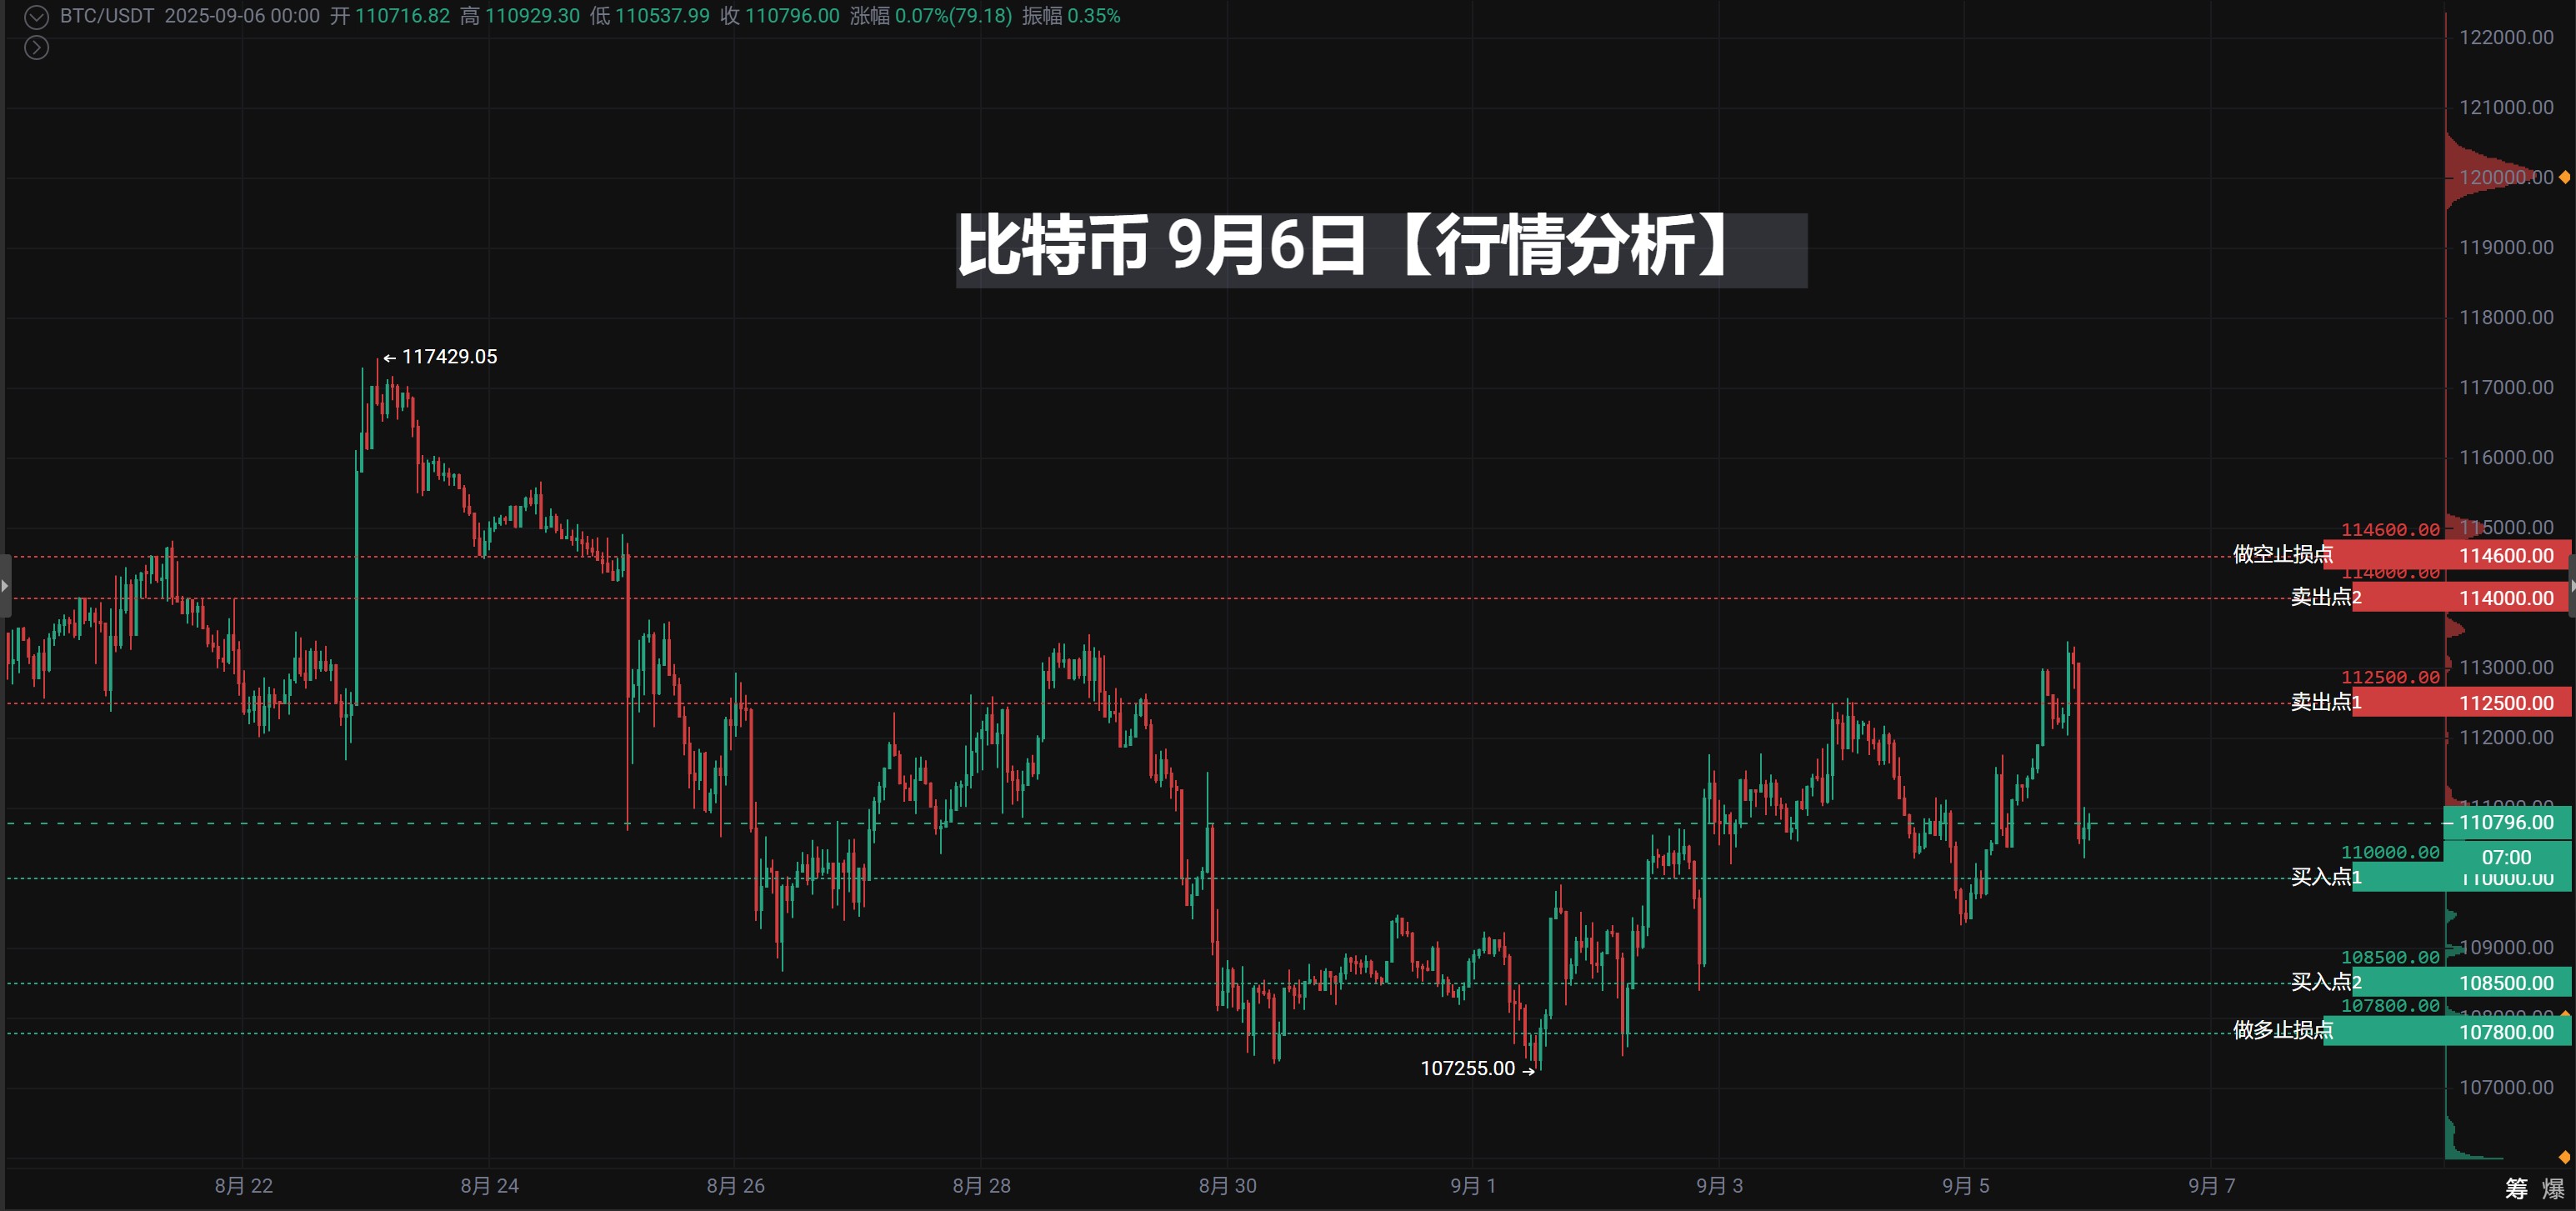
Buy Point One
110,000
Integer level + previous low support + EMA30 moving average
Reasonable, in line with the support resonance principle, suitable for light position testing (30%-40% of funds)
Buy Point Two
108,500
Stronger support range + daily platform bottom
Better risk-reward ratio, suitable for main position layout (60%-70% of funds)
Long Stop Loss
107,800
Break below key support zone
Set reasonably, must be strictly executed to prevent deep pullback risk
Sell/Take Profit One
112,500
Integer pressure + recent high point selling pressure
Reasonable, suitable for reducing half of the long position to lock in profits
Sell/Take Profit Two
114,000
Higher resistance zone + daily rebound high point
Ideal take profit point, can close remaining long positions, or lightly short
Short Stop Loss
114,600
Breakthrough of key resistance
Necessary setting, to leave room for trend continuation
🔍 Key Execution Details
Position Management
It is recommended to adopt a batch building strategy: invest 30%-40% of funds at 110,000, and invest the remaining funds at 108,500
Short positions should be less than long positions (recommended not exceeding 50%)
Risk Control
Total position risk should be controlled within 2%-5% of funds
Do not move stop loss levels, even if short-term fluctuations hit the stop loss, it must be strictly executed
Market Environment Adaptability
This strategy is most suitable for oscillating markets or mild rebound trends
In a strong one-sided upward market, short positions need to be approached with extra caution
⚠️ Risk Warning
Trend Risk: If the market is in a strong one-sided trend, counter-trend operations (shorting) may face significant risks
Breakthrough Risk: After key levels are effectively broken, timely assessment of whether the trend has changed is necessary
Liquidity Risk: Major news events may lead to a sudden drop in liquidity, widening spreads and slippage
💡 Summary Suggestions
Recommendations:
Prioritize executing long strategies, building long positions in batches at support levels
Be cautious with short positions, only as a counter-trend small position attempt
Focus on the performance at 112,500: If it can break out with volume, it may look towards 114,000; if it encounters resistance and falls back, take profit in time
Please note: The market is ever-changing, please adjust flexibly based on real-time market conditions in actual trading, and always prioritize risk control.
Wishing you successful trading!
Live streaming of real-time strategies at all times
#Tencent Meeting: 919-948-0091
【The above analysis and strategies are for reference only. Risks are to be borne by the reader. The article review and publication may have delays, and specific operations should follow the real-time strategies of crypto experts】
Join the group chat to discuss and learn professional knowledge in the crypto space, so as not to be the chives under the sickle (you can receive position allocation strategies, teaching you how to make money in a bull market and earn coins in a bear market)
——Crypto Expert Community, a community focused on technical analysis. Anyone with questions about operations or trends can communicate and learn with me! Share and profit together! Remember the crypto expert, available 24/7, follow the crypto expert to avoid getting lost!

Scan the QR code with WeChat to follow my public account
免责声明:本文章仅代表作者个人观点,不代表本平台的立场和观点。本文章仅供信息分享,不构成对任何人的任何投资建议。用户与作者之间的任何争议,与本平台无关。如网页中刊载的文章或图片涉及侵权,请提供相关的权利证明和身份证明发送邮件到support@aicoin.com,本平台相关工作人员将会进行核查。