【Price Trend Analysis】
K-Line Pattern:
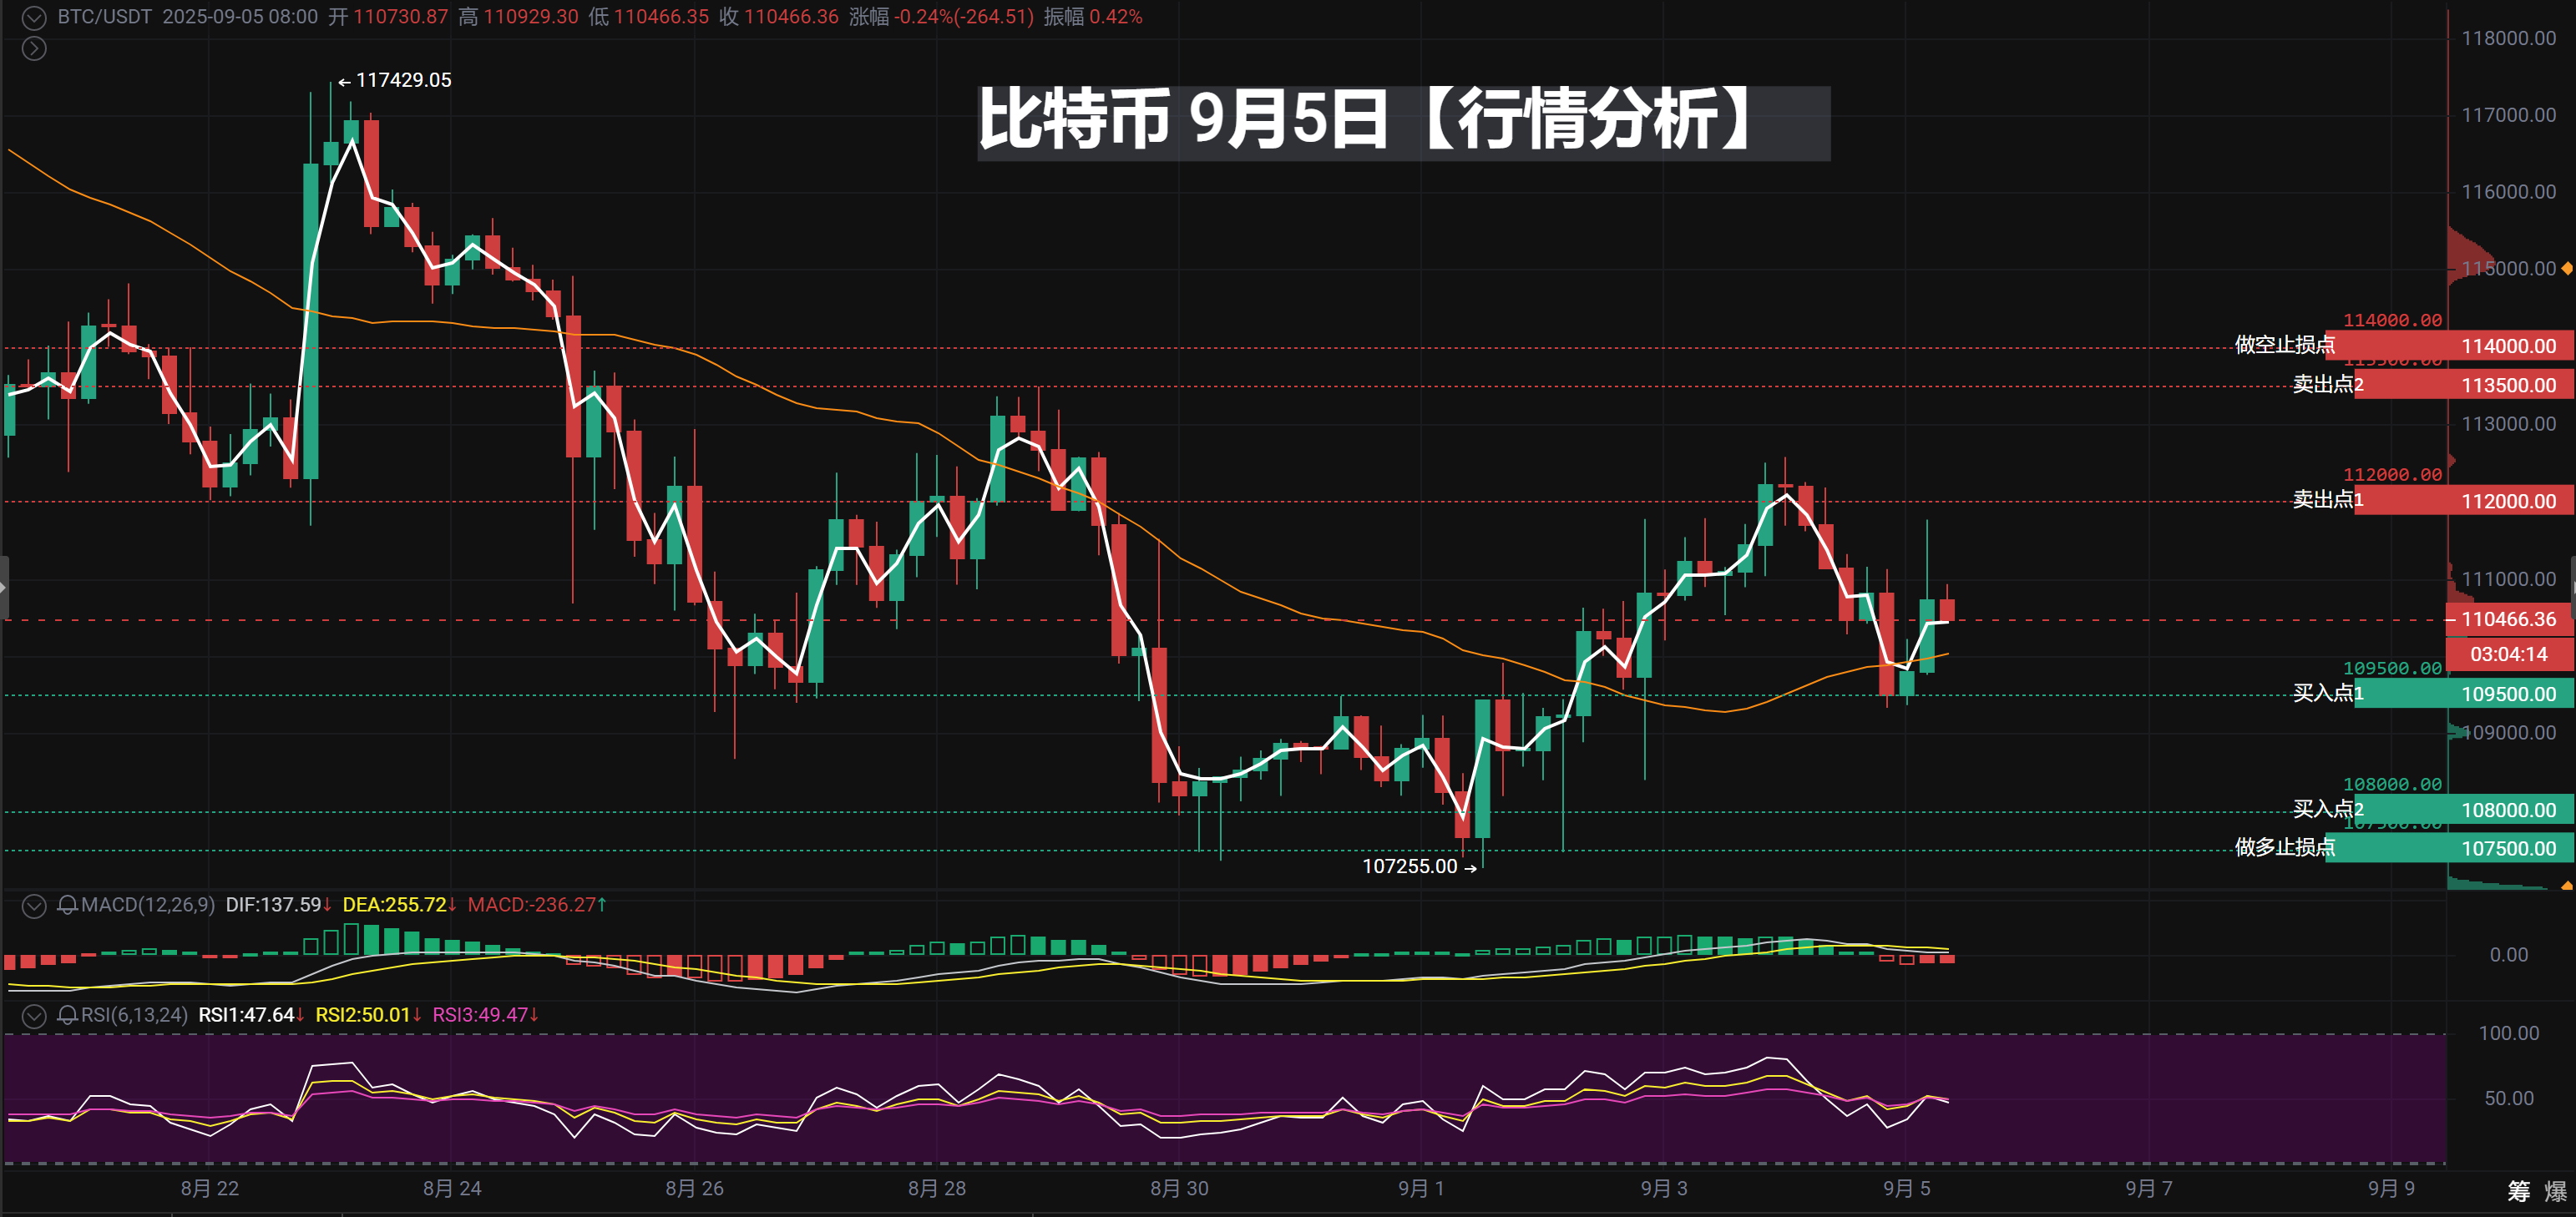
The daily level shows that recent prices are oscillating at a high level. After a long lower shadow on September 2, there was a rebound, but overall it is still in a downward trend.
In the 4-hour cycle, a small "head and shoulders" structure has recently formed, with the current price close to the neckline (around 110,500).
Technical Indicators:
MACD:
The daily level DIF and DEA are both running below the zero axis, with green bars shortening but lacking momentum, indicating a bearish dominance.
In the 4-hour level, DIF and DEA are gradually converging, showing signs of a golden cross, but it has not yet been confirmed.
RSI:
The daily RSI is around 50, indicating a neutral market sentiment with no obvious overbought or oversold signals.
The 4-hour RSI hovers around 50, with an unclear short-term direction.
EMA:
EMA7, EMA30, and EMA120 are in a bearish arrangement at the daily level, with EMA7 exerting strong pressure.
The 4-hour EMA7 slightly crosses above EMA30, but overall it is still under pressure from EMA120, indicating a weak trend.
Trading Volume:
The daily trading volume has gradually shrunk since the increase on September 2, indicating that both bulls and bears are in a wait-and-see mood.
The 4-hour trading volume fluctuations have weakened, with recent K-line volumes being sluggish and lacking breakthrough momentum.
【Trading Plan Summary】
Trading Target: Bitcoin (BTC/USDT)
Core Idea: Gradually build long positions in key support areas and take profits or attempt light short positions in key resistance areas. Buy low and sell high in a volatile market, and stop-loss if key levels are broken.
Current Market Assessment: Your point settings indicate that the market is in a range-bound oscillation pattern, and the strategy is suitable for a consolidation phase without a clear upward or downward trend.
【Trading Strategy Execution Details】
1. Long Strategy (Buy on Dips)
📍 Long Entry Point 1: 109,500 USDT
Reason: Utilize the previous swing low and the psychological support effect of the round number for the first entry.
Action: Invest 40% of the planned long funds.
📍 Long Entry Point 2: 108,000 USDT
Reason: This position has both a long lower shadow (indicating strong buying interest) and long-term trend line (EMA120) support, making it a more favorable entry point.
Action: Invest 60% of the planned long funds, gradually building to average down costs.
🛑 Long Stop-Loss Point: 107,500 USDT
- Reason: Placed below all key supports. If it breaks, it indicates that the support logic has failed, and the trend may turn bearish, necessitating a firm stop-loss.
🎯 Long Target Levels:
Target 1: 112,000 USDT (Reduce position or close half to lock in profits)
Target 2: 113,500 USDT (Close all remaining long positions)
2. Short Strategy/Long Take-Profit Strategy (Sell on Rallies)
📍 Short Entry Point / Long Take-Profit Point 1: 112,000 USDT
- Reason: Previous high point and round number pressure, technical selling pressure usually appears at this level, making it the primary take-profit point for longs.
📍 Short Entry Point / Long Take-Profit Point 2: 113,500 USDT
- Reason: The top of the previous oscillation range, a stronger resistance level with more pressure.
🛑 Short Stop-Loss Point: 114,000 USDT
- Reason: Placed above the strong resistance area. If the price strongly breaks this level, it indicates that upward space has opened, and shorts must stop-loss immediately.
🎯 Short Target Levels: 111,000 - 110,000 USDT (Close positions near support areas)
【Risk Control and Position Management】
Total Position Control: It is recommended that the total risk capital for this single trade does not exceed 5% of your total margin.
Gradual Operations: Strictly follow the planned proportions for gradual entry and take-profit, avoiding heavy positions in one go.
Dynamic Adjustments: Closely monitor the price performance at support and resistance levels. If the price quickly rebounds at 109,500 with increased volume, it can be seen as a positive signal; if the rebound is weak, be cautious of the risk of falling towards 108,000.
Divergence Risk: Always pay attention to whether trading volume can accompany price movements. If volume shrinks while rising to target levels (volume-price divergence), it is a stronger take-profit signal.
Please remember: The market is ever-changing, and the above suggestions are merely a strategy outline based on price levels and do not constitute any investment advice. Please make your final decisions based on real-time market conditions and ensure proper risk control.
Wishing you successful trading!
Live streaming of real-time strategies at irregular hours
#Tencent Meeting: 919-948-0091
【The above analysis and strategies are for reference only. Risks are to be borne by yourself. The article review and publication may have delays, and specific operations should follow the real-time strategies of the crypto experts】
Join the group chat to discuss and learn professional knowledge in the crypto space, so as not to be the chives under the scythe (you can receive position allocation strategies, teaching you how to make money in a bull market and earn coins in a bear market)
——Crypto Expert Community, a community focused on technical analysis. Anyone with questions about operations or trends can communicate and learn with me! Let's share and profit together! Remember the crypto expert, available 24/7, follow the crypto expert to avoid getting lost!

Scan the QR code to follow my public account
免责声明:本文章仅代表作者个人观点,不代表本平台的立场和观点。本文章仅供信息分享,不构成对任何人的任何投资建议。用户与作者之间的任何争议,与本平台无关。如网页中刊载的文章或图片涉及侵权,请提供相关的权利证明和身份证明发送邮件到support@aicoin.com,本平台相关工作人员将会进行核查。


