Review the historical performance of these two indicators and provide market insights based on current readings.
Author: 0xYYcn (Bitfox Research)
Introduction
Bitcoin resumed its upward trend on August 13, breaking through historical highs. Ethereum (ETH) subsequently approached $5,000, while Solana recently broke through the key resistance level of $215. However, since then, the market has shown a continuous downward trend. This raises an important question: Will BTC, ETH, and SOL continue to see a new round of increases? When will the peak of this cycle arrive?
Two widely watched indicators used to measure whether Bitcoin is overvalued or has entered a bubble zone are the Mayer Multiple (MM) and the MVRV Z-Score.
These two indicators have a good historical record in technical and on-chain analysis and are often used to identify market overheating before significant pullbacks. This article reviews the historical performance of these two indicators and provides market insights based on current readings.
Core Indicators
Mayer Multiple (MM): The Mayer Multiple is the ratio of Bitcoin's current price to its 200-day moving average price.
● MM > 1 → Bullish (price above long-term trend)
MM < 1 → Bearish (price below long-term trend)
● MM >> 2 → Entering speculative bubble territory
In this analysis, 2.2 is set as the warning line for overheating.
MVRV Z-Score (Z): The MVRV Z-Score compares Bitcoin's market capitalization to its realized value (the total cost basis of all circulating coins) and standardizes it through the historical volatility of the market.
● High Z → Market capitalization far exceeds realized value, with investors generally holding significant unrealized profits (common at cycle tops).
● Low or negative Z → Market trading price is below the overall cost basis (common in undervalued or capitulation phases).
In this analysis, 5 is set as the warning line for overheating.
Backtesting Methodology
We applied these two indicators to 11 recognized major pullback periods of Bitcoin. For each period, we defined a "pullback window" covering the month before the event and the month of the event. Using daily data, the rules are as follows:
● When MM > 2.2 or MVRV Z-Score > 5, that day is considered a signal.
● If at least one signal occurs within a significant pullback window, it is considered that the pullback has been captured.
Subsequently, we calculated the hit rate (number of captured pullbacks ÷ total pullbacks) and analyzed the sensitivity (the frequency of signals appearing in non-pullback windows).
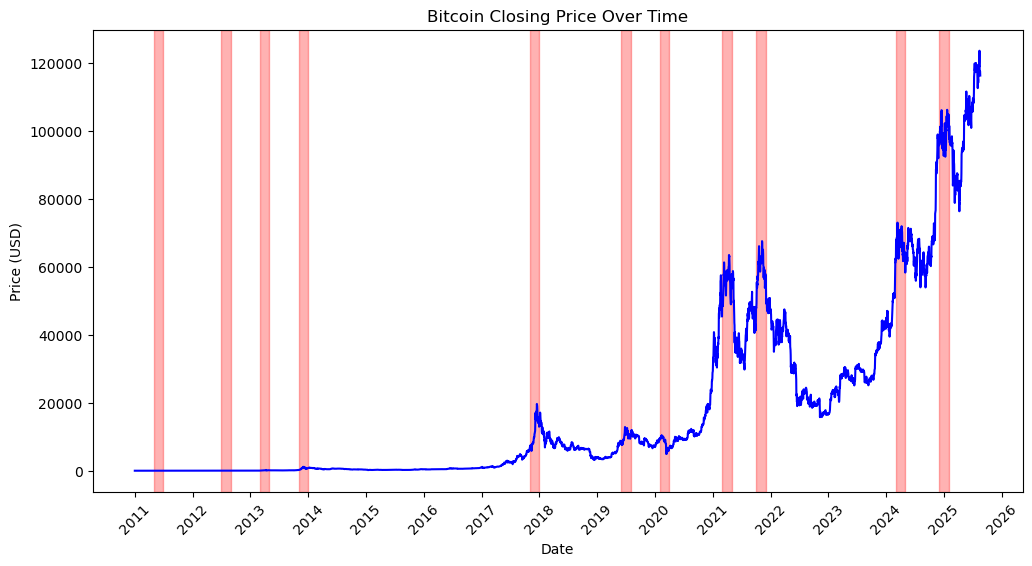
Bitcoin price and significant pullback windows as of August 18, 2025 (data source: Bitfox Research)
Mayer Multiple: Identifying Overheated Markets
The Mayer Multiple reflects the level of price relative to the long-term average. Historically, when the ratio is significantly above 2, it often indicates that Bitcoin is trading at a significant premium, usually driven by speculation.
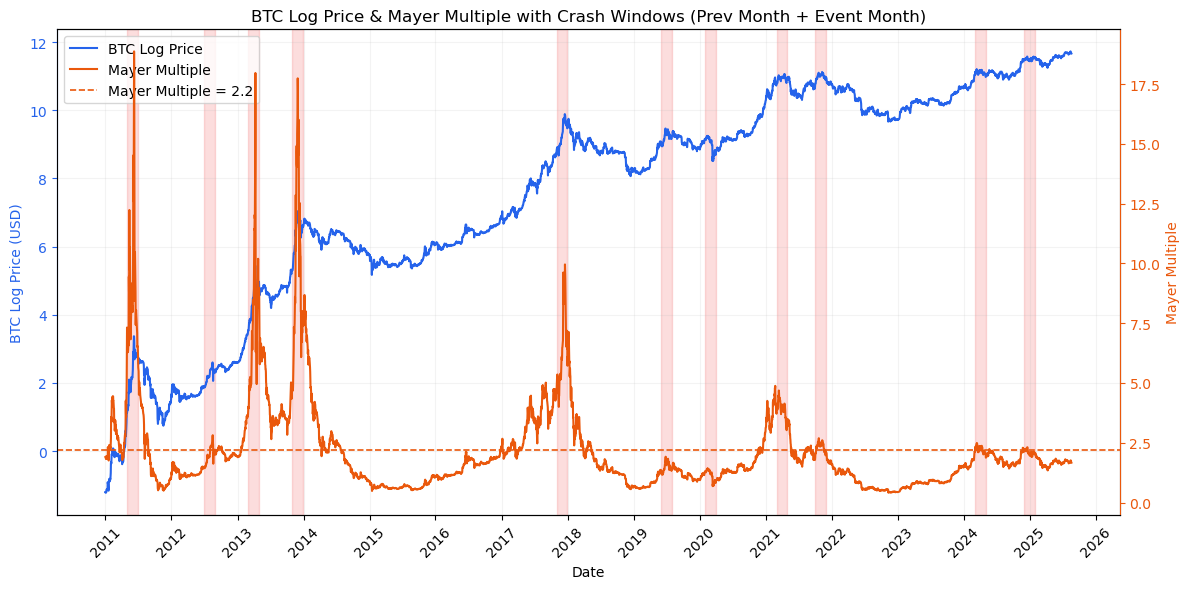
Bitcoin logarithmic price with Mayer Multiple and its 2.2 threshold (as of August 18, 2025, data source: Bitfox Research)
● Performance: At the 2.2 threshold, MM captured 9 out of 11 major pullbacks (hit rate 82%).
● Accuracy: Successfully identified classic cycle tops (2011, twice in 2013, 2017, twice in 2021, and the tops in early 2024 and 2025).
● Misses: July 2019 (mid-cycle pullback) and March 2020 (liquidity shock triggered by the pandemic).
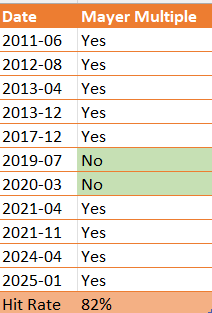
Mayer Multiple: Historical performance in identifying market tops (2011–2025)
Advantages: Very robust in identifying overheated markets.
Disadvantages: Often triggers too early—if investors exit at the first >2.2 signal, they will miss most of the bull markets in 2013 and 2017. MM is more suitable as a bubble warning system rather than an exact exit signal.
MVRV Z-Score: Measuring Market Bubbles with On-Chain Data
The MVRV Z-Score measures investors' unrealized profits, and when the value is extremely high, it often indicates speculative overheating in the market.
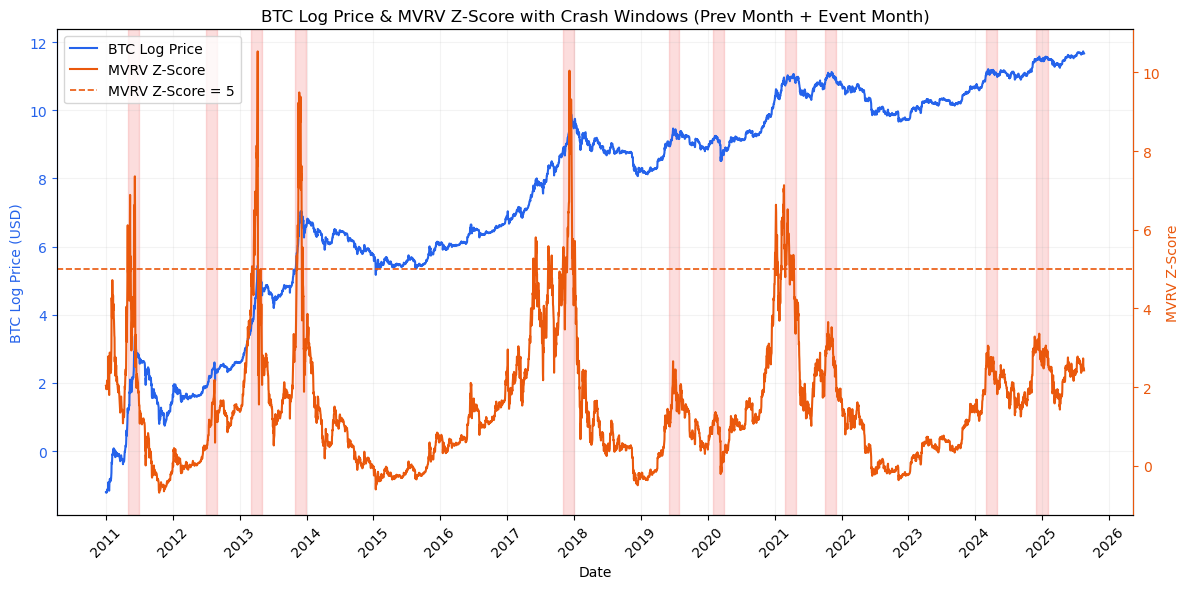
Bitcoin logarithmic price with MVRV Z-Score and its 5 threshold (as of August 18, 2025, data source: Bitfox Research)
● Performance: At the 5 threshold, the Z-Score captured about 45% of significant pullback windows.
● Advantages: Much more precise than MM. Once triggered, it usually only appears in the month before the top, providing timely signals to investors.
● Disadvantages: Missed many pullbacks, especially those driven by external shocks (like the pandemic in March 2020) or mid-cycle adjustments (like July 2019).
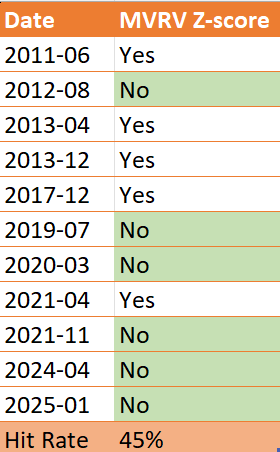
MVRV Z-Score: Historical performance in identifying market tops (2011–2025)
Conclusion: Although not as comprehensive as MM, when the Z-Score signals, its role is sharper. It is less prone to false alarms but must be used in conjunction with other indicators.
Backtesting Conclusion: An Evolving Market
The backtesting results indicate that both the Mayer Multiple and the MVRV Z-Score show a declining trend in peak levels when marking market tops. Historically, the Mayer Multiple has decreased from readings above 17.5 in early cycles to around 2.2 in recent years; the MVRV Z-Score has dropped from peaks above 8 to nearly 3. This suggests that the market dynamics of Bitcoin are evolving, with the indicator levels for peaks becoming increasingly lower.
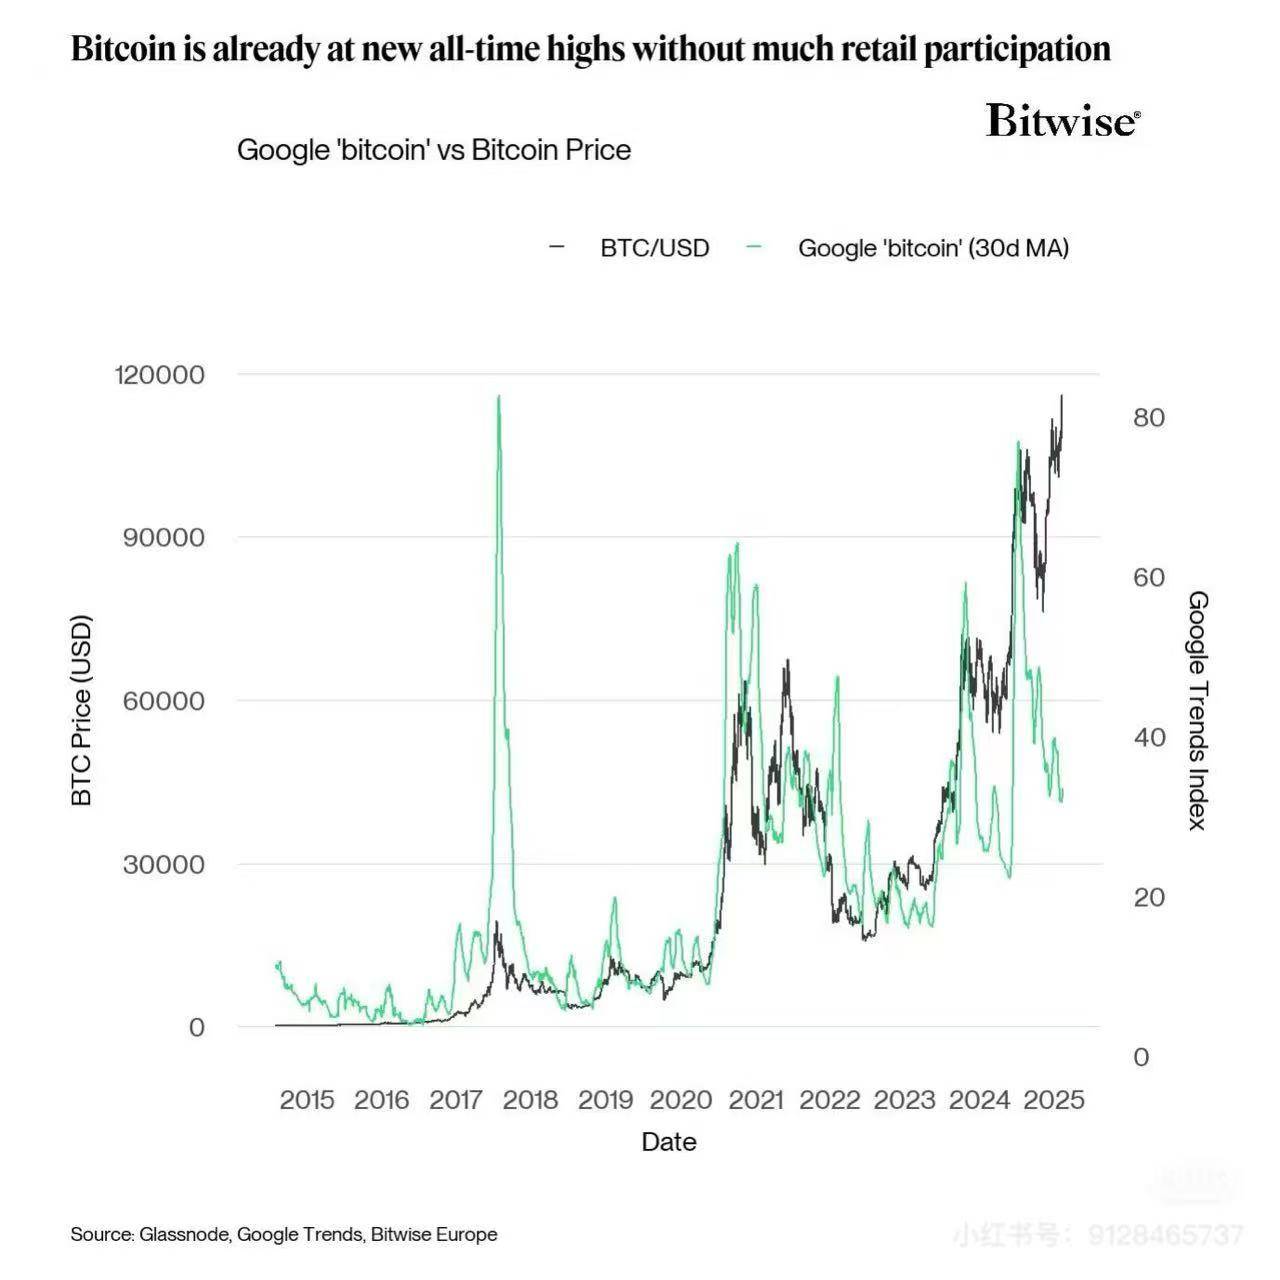
Comparison of Bitcoin price with Google Bitcoin Trends Index
A supplementary perspective comes from comparing Bitcoin price with the Google Trends Index (provided by @0xPianoHands). The price trend of Bitcoin has gradually decoupled from search trends, while search volume is often a proxy indicator of retail participation. With the influx of institutional capital, Bitcoin is gradually transitioning to a more stable, efficient, and mature market. Therefore, the traditional thresholds used for the Mayer Multiple and MVRV Z-Score may need to be adjusted downward to reflect this change in market structure.
Investor Insights
For investors, these indicators should be viewed as warning signals rather than absolute sell triggers. The Mayer Multiple provides broader coverage and often identifies overheating conditions in advance, while the MVRV Z-Score is more selective, typically signaling only when the top is near. A prudent approach is to treat threshold breaches as warnings but seek confirmation of trend reversals before acting. When both indicators heat up simultaneously, the credibility of the signals is higher; if relying on a single indicator's trigger, one should wait for clearer signs of market reversal to avoid exiting too early.
Current Market Conditions
As of September 1, the Mayer Multiple for Bitcoin is 1.07, and the MVRV Z-Score is 2.1. Both values are far below the historical "red zone." This indicates that while there is some heat in the market, it is far from the frenzy levels associated with cycle tops. If the Mayer Multiple breaks above 2.2, or if the MVRV Z-Score rises to around 5 and then falls back, historical patterns suggest that the likelihood of a cycle peak will significantly increase. Until then, evidence still points to the current bull market cycle having the potential for further increases.
免责声明:本文章仅代表作者个人观点,不代表本平台的立场和观点。本文章仅供信息分享,不构成对任何人的任何投资建议。用户与作者之间的任何争议,与本平台无关。如网页中刊载的文章或图片涉及侵权,请提供相关的权利证明和身份证明发送邮件到support@aicoin.com,本平台相关工作人员将会进行核查。


