Will crypto break the ‘Red September’ curse? There is measured optimism today in the market.
The crypto market as a whole climbed 1.2% today to reclaim $3.9 trillion. Traditional markets, meanwhile, stumbled: The S&P 500 fell to 6,370 points, losing 1.39% from the previous session. In other words, crypto is again showing resilience amid tariff uncertainty and seasonal headwinds.
Bitcoin, Solana, and XRP are leading the charge with approximately 2% gains, setting a cautiously bullish tone as traders navigate what's historically been crypto's choppiest month.
The divergence from traditional markets is particularly notable given Treasury yields and volatility spiked while tech stocks slumped to start the short week after a federal appeal court challenged almost all of President Donald Trump's tariffs as illegal.
Yet, it seems like crypto is currently marching to its own drum, potentially detaching itself from any macro-driven FUD.
Bitcoin (BTC) price: A modest rally
Bitcoin today managed a respectable 1.36% gain to its current price of $110,735, climbing from an opening price of $109,255. The flagship cryptocurrency briefly touched $111,775 during the session—a 2.3% intraday spike that shows bulls are testing resistance levels, though selling pressure emerged near the highs.
Still, bulls can breathe and rely on the $110K price point as a battle ground to scare away the bears for now.
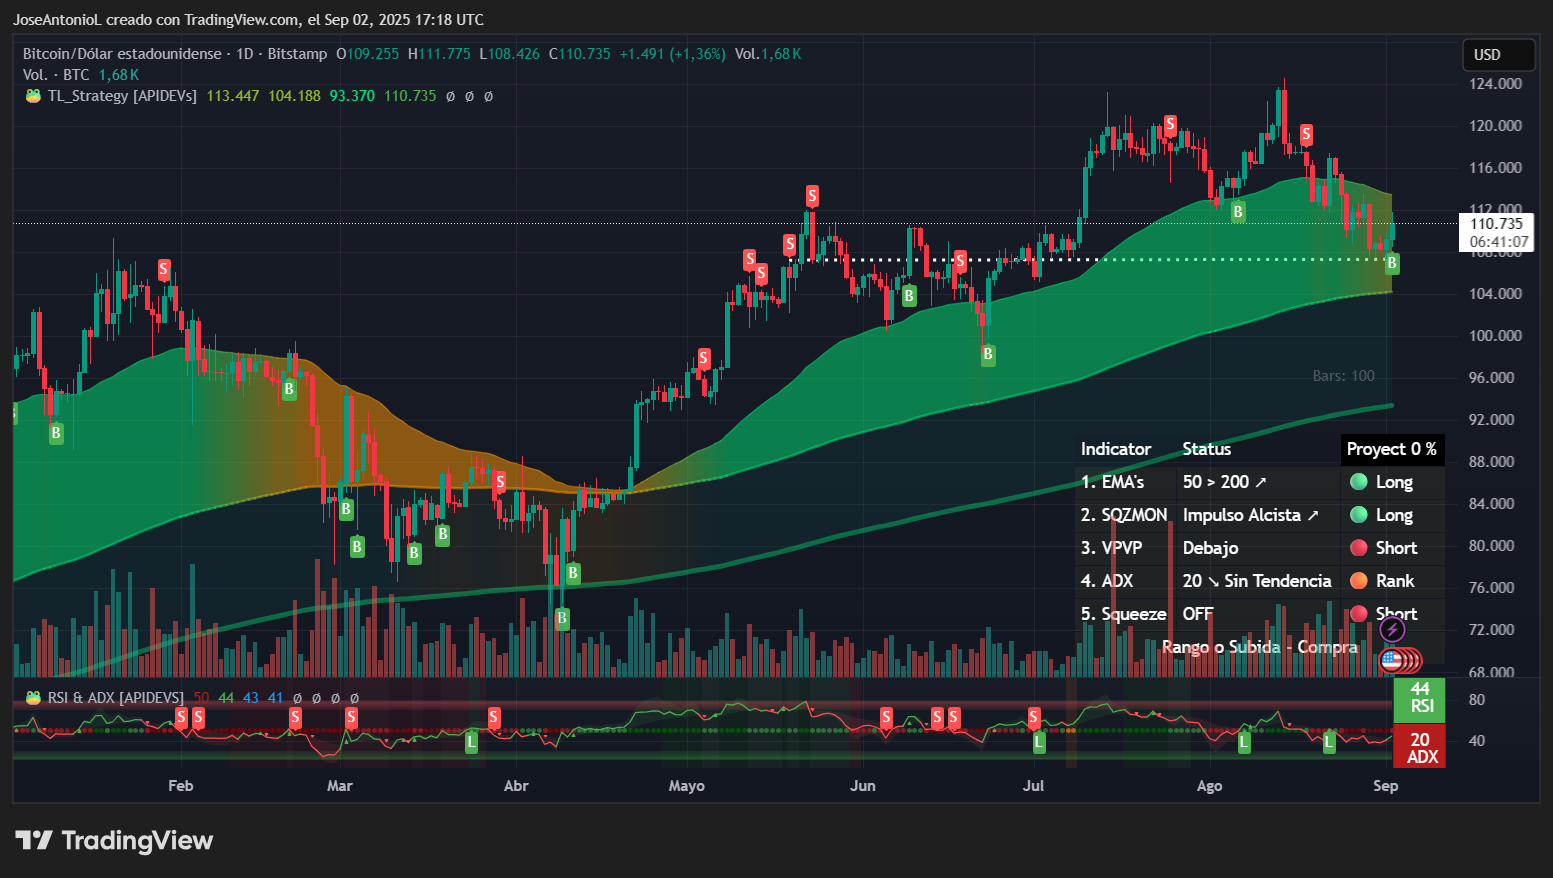
Bitcoin price data. Image: Tradingview
The technical picture for Bitcoin shows a market in transition. The Relative Strength Index, or RSI, for Bitcoin is sitting at 44, which indicates neutral to slightly bearish momentum. RSI measures price velocity on a scale from 0-100, where readings below 30 suggest oversold conditions and above 70 indicate overbought territory.
At 44, Bitcoin is oversold (traders are moving to push Bitcoin lower), but the coin has room to move in either direction without prompting algorithmic selling from traders who rely on RSI as a trigger.
What’s more concerning for traders may be the Average Directional Index, or ADX, which is currently at 20 for BTC. ADX measures trend strength regardless of direction. Readings below 25 indicate a weak or non-existent trend, suggesting Bitcoin is essentially drifting rather than decisively moving. This is where it gets interesting for traders.
Periods of low ADX often precede explosive moves as the market coils like a spring. At just 20 points, this indicator alone shows that the bullish trend is struggling to keep up its pace. The low RSI is yet another confirmation that bears are advancing in the short term.
The Squeeze Momentum Indicator shows "off" status, confirming we're not in a compression phase, with bears trying to flip the scale. Traders inclined to believe there's a trend reversal ahead could be shopping for short positions right around now, expecting a full-blown crypto winter in 2026. Position traders with a HODL mentality, on the other hand, may take these signals to mean it's time to start hunting for dips to build up their stashes.
On the more positive side, Bitcoin’s exponential moving averages, or EMAs, may give bulls some hope. EMAs provide traders with a view of potential price supports and resistances by assessing the average price of an asset over the short, medium, or long term.
At the moment, Bitcoin’s 50-day EMA remains above its 200-day EMA—a bullish configuration traders call the "golden cross." This setup indicates that medium-term buyers are more aggressive than long-term holders, typically a sign of sustained upward pressure. When short-term averages stay above long-term ones, it suggests the broader trend remains intact despite temporary weakness.
But the gap between these averages is starting to narrow. And that’s also a sign that the current trend is weakening.
On Myriad Markets—a predictions platform developed by Decrypt’s parent company, Dastan—predictors currently think it’s much more likely that Bitcoin falls to $105K than climb back up to $125K. Myriad traders place the odds of a dip to $105K at 66%—up from just 44% two weeks ago.
Key Levels remain almost the same as yesterday:
- Immediate support: $105,000 (psychological level)
- Immediate resistance: $113,000 (EMA50)
- Strong resistance: $115,000 (next major psychological barrier)
Ethereum (ETH) price: Volatility ahead?
Ethereum painted a slightly red candle with a marginal 0.25% decline to $4,303.99 testing yesterday’s support. However, the $4,416.45 high today represents a 2.4% intraday move, suggesting underlying volatility despite the flat close. This kind of price action—wide intraday ranges with minimal net movement—often precedes directional breakouts.
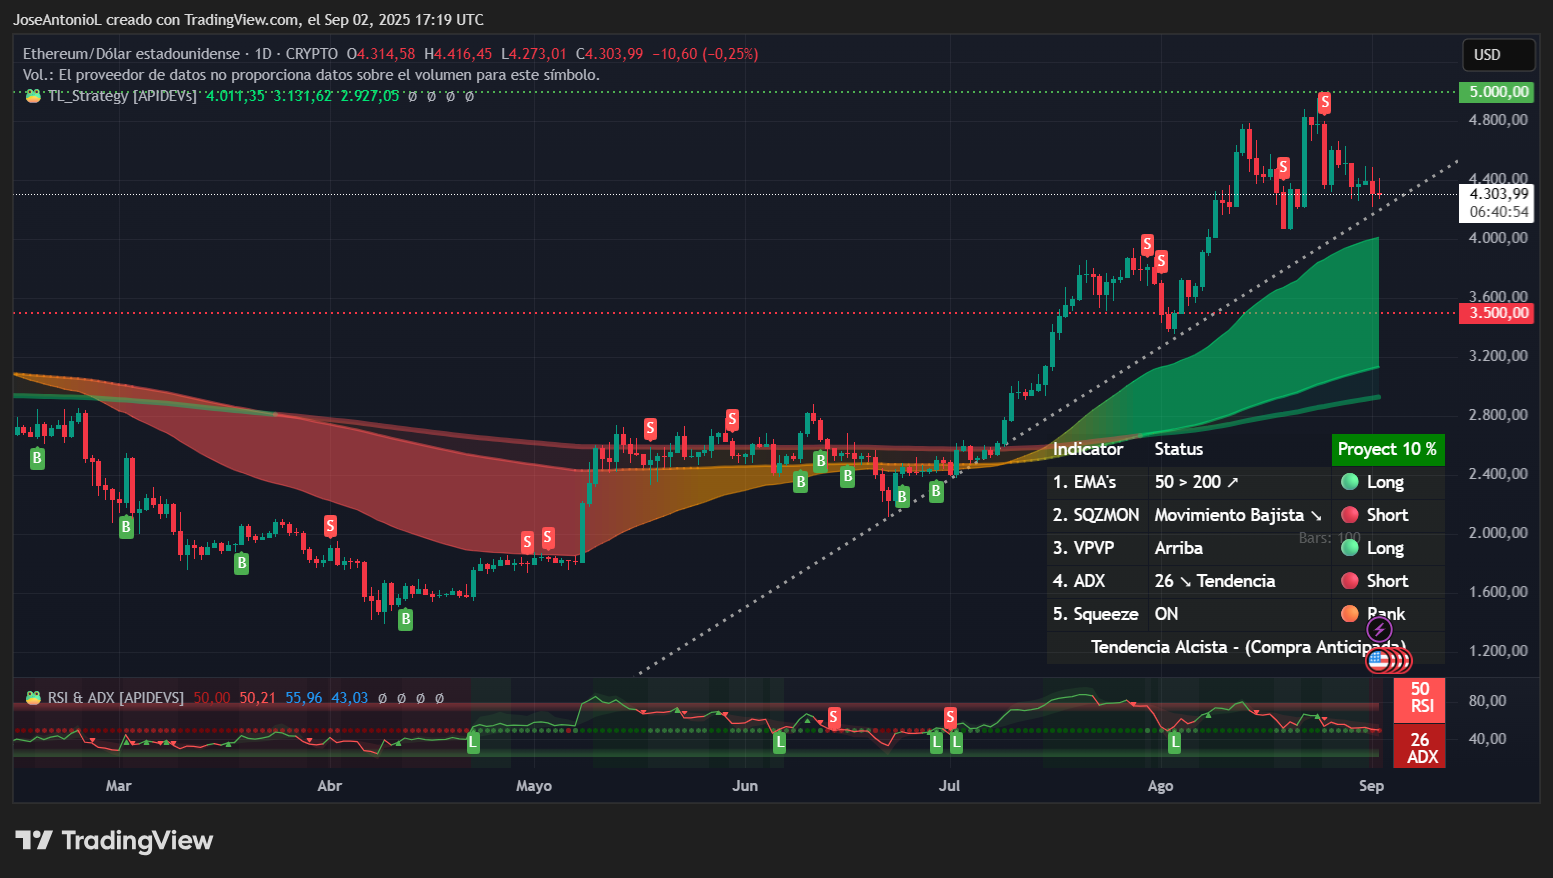
Ethereum price data. Image: Tradingview
The RSI at 50 sits perfectly neutral, like a pendulum at rest. This dead-center reading means neither bulls nor bears have control, creating a tug-of-war scenario. For traders, neutral RSI after recent volatility often signals accumulation phases where smart money quietly positions before the next major move.
The ADX at 26 still tells a bullish story if you only look at today's chart. Unlike Bitcoin's weak trend, Ethereum is still over the crucial 25 threshold that confirms trend establishment. However, the ADX has been going down significantly during the past few days, especially inside the candlesticks that form the current triangle pattern. If traders maintain this behavior the rest of the week, there is some small risk ETH may break to the downside instead of the expected bullish bounce.
The 50-day EMA maintaining its position above the 200-day EMA provides a bullish backbone to the setup. This positive alignment means that despite today's minor decline, the structural uptrend remains intact. Traders often use these moving average configurations as dynamic support and resistance levels, with price bounces off the 50-day EMA considered buying opportunities in uptrends.
Unlike current bets on Bitcoin, predictors on Myriad Markets are still bullish on Ethereum, with users placing odds at 60% that ETH hits $5,000 before falling all the way back down to $3,500. But it’s also worth noting that these odds have dropped 13% in the last week.
Key Levels:
- Strong support: $4,000 (major psychological level)
- Immediate resistance: $4,416 (today's high)
- Strong resistance: $4,500 (round number resistance)
September's historical weakness for both stocks and crypto adds a wildcard element. However, with institutional adoption continuing through ETF flows and major banks like JP Morgan turning bullish, there is some hope that seasonal dips might prove to be buying opportunities rather than trend reversals.
The views and opinions expressed by the author are for informational purposes only and do not constitute financial, investment, or other advice.
免责声明:本文章仅代表作者个人观点,不代表本平台的立场和观点。本文章仅供信息分享,不构成对任何人的任何投资建议。用户与作者之间的任何争议,与本平台无关。如网页中刊载的文章或图片涉及侵权,请提供相关的权利证明和身份证明发送邮件到support@aicoin.com,本平台相关工作人员将会进行核查。


