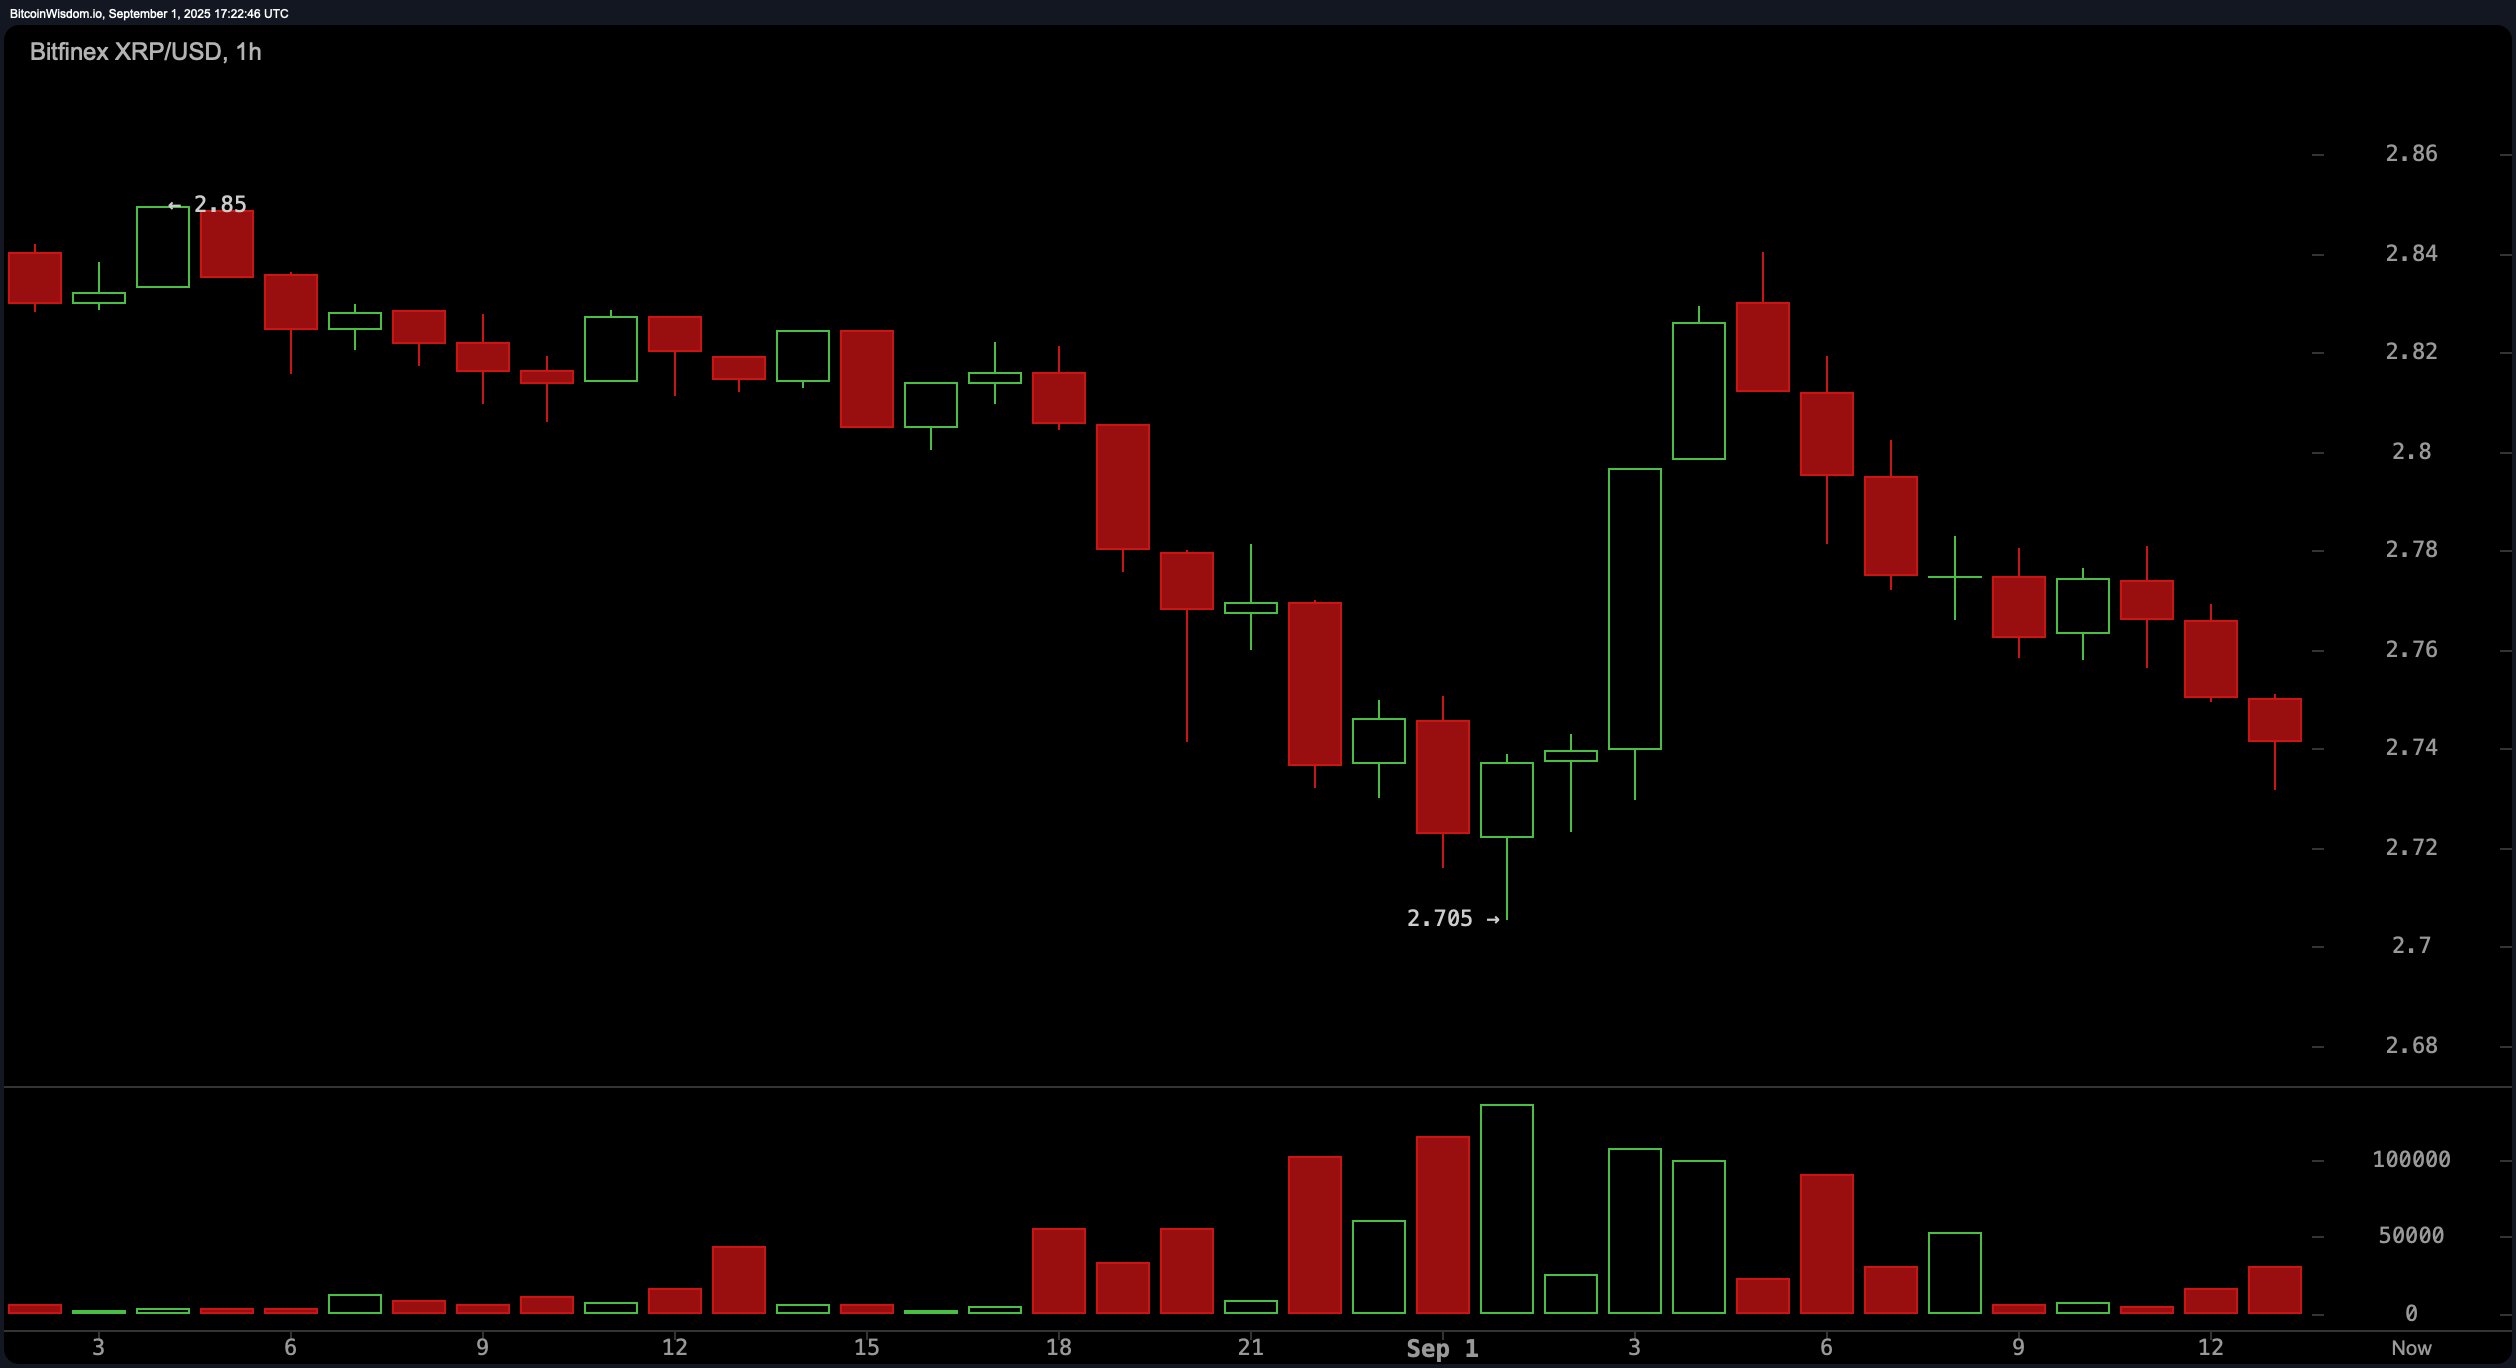
On the 1-hour chart, XRP has established a clear pattern of lower highs and persistent closes below the $2.80 mark. A sharp bounce earlier in the session into the $2.84 to $2.85 range was swiftly rejected, indicating strong intraday supply. This lower time frame behavior underscores a bearish microstructure, with short sellers firmly in control. Key support at $2.70 to $2.75 remains under threat, and any hourly close below $2.70 could accelerate downside momentum.

XRP/USD via Bitfinex 1-hour chart on Sept. 1, 2025.
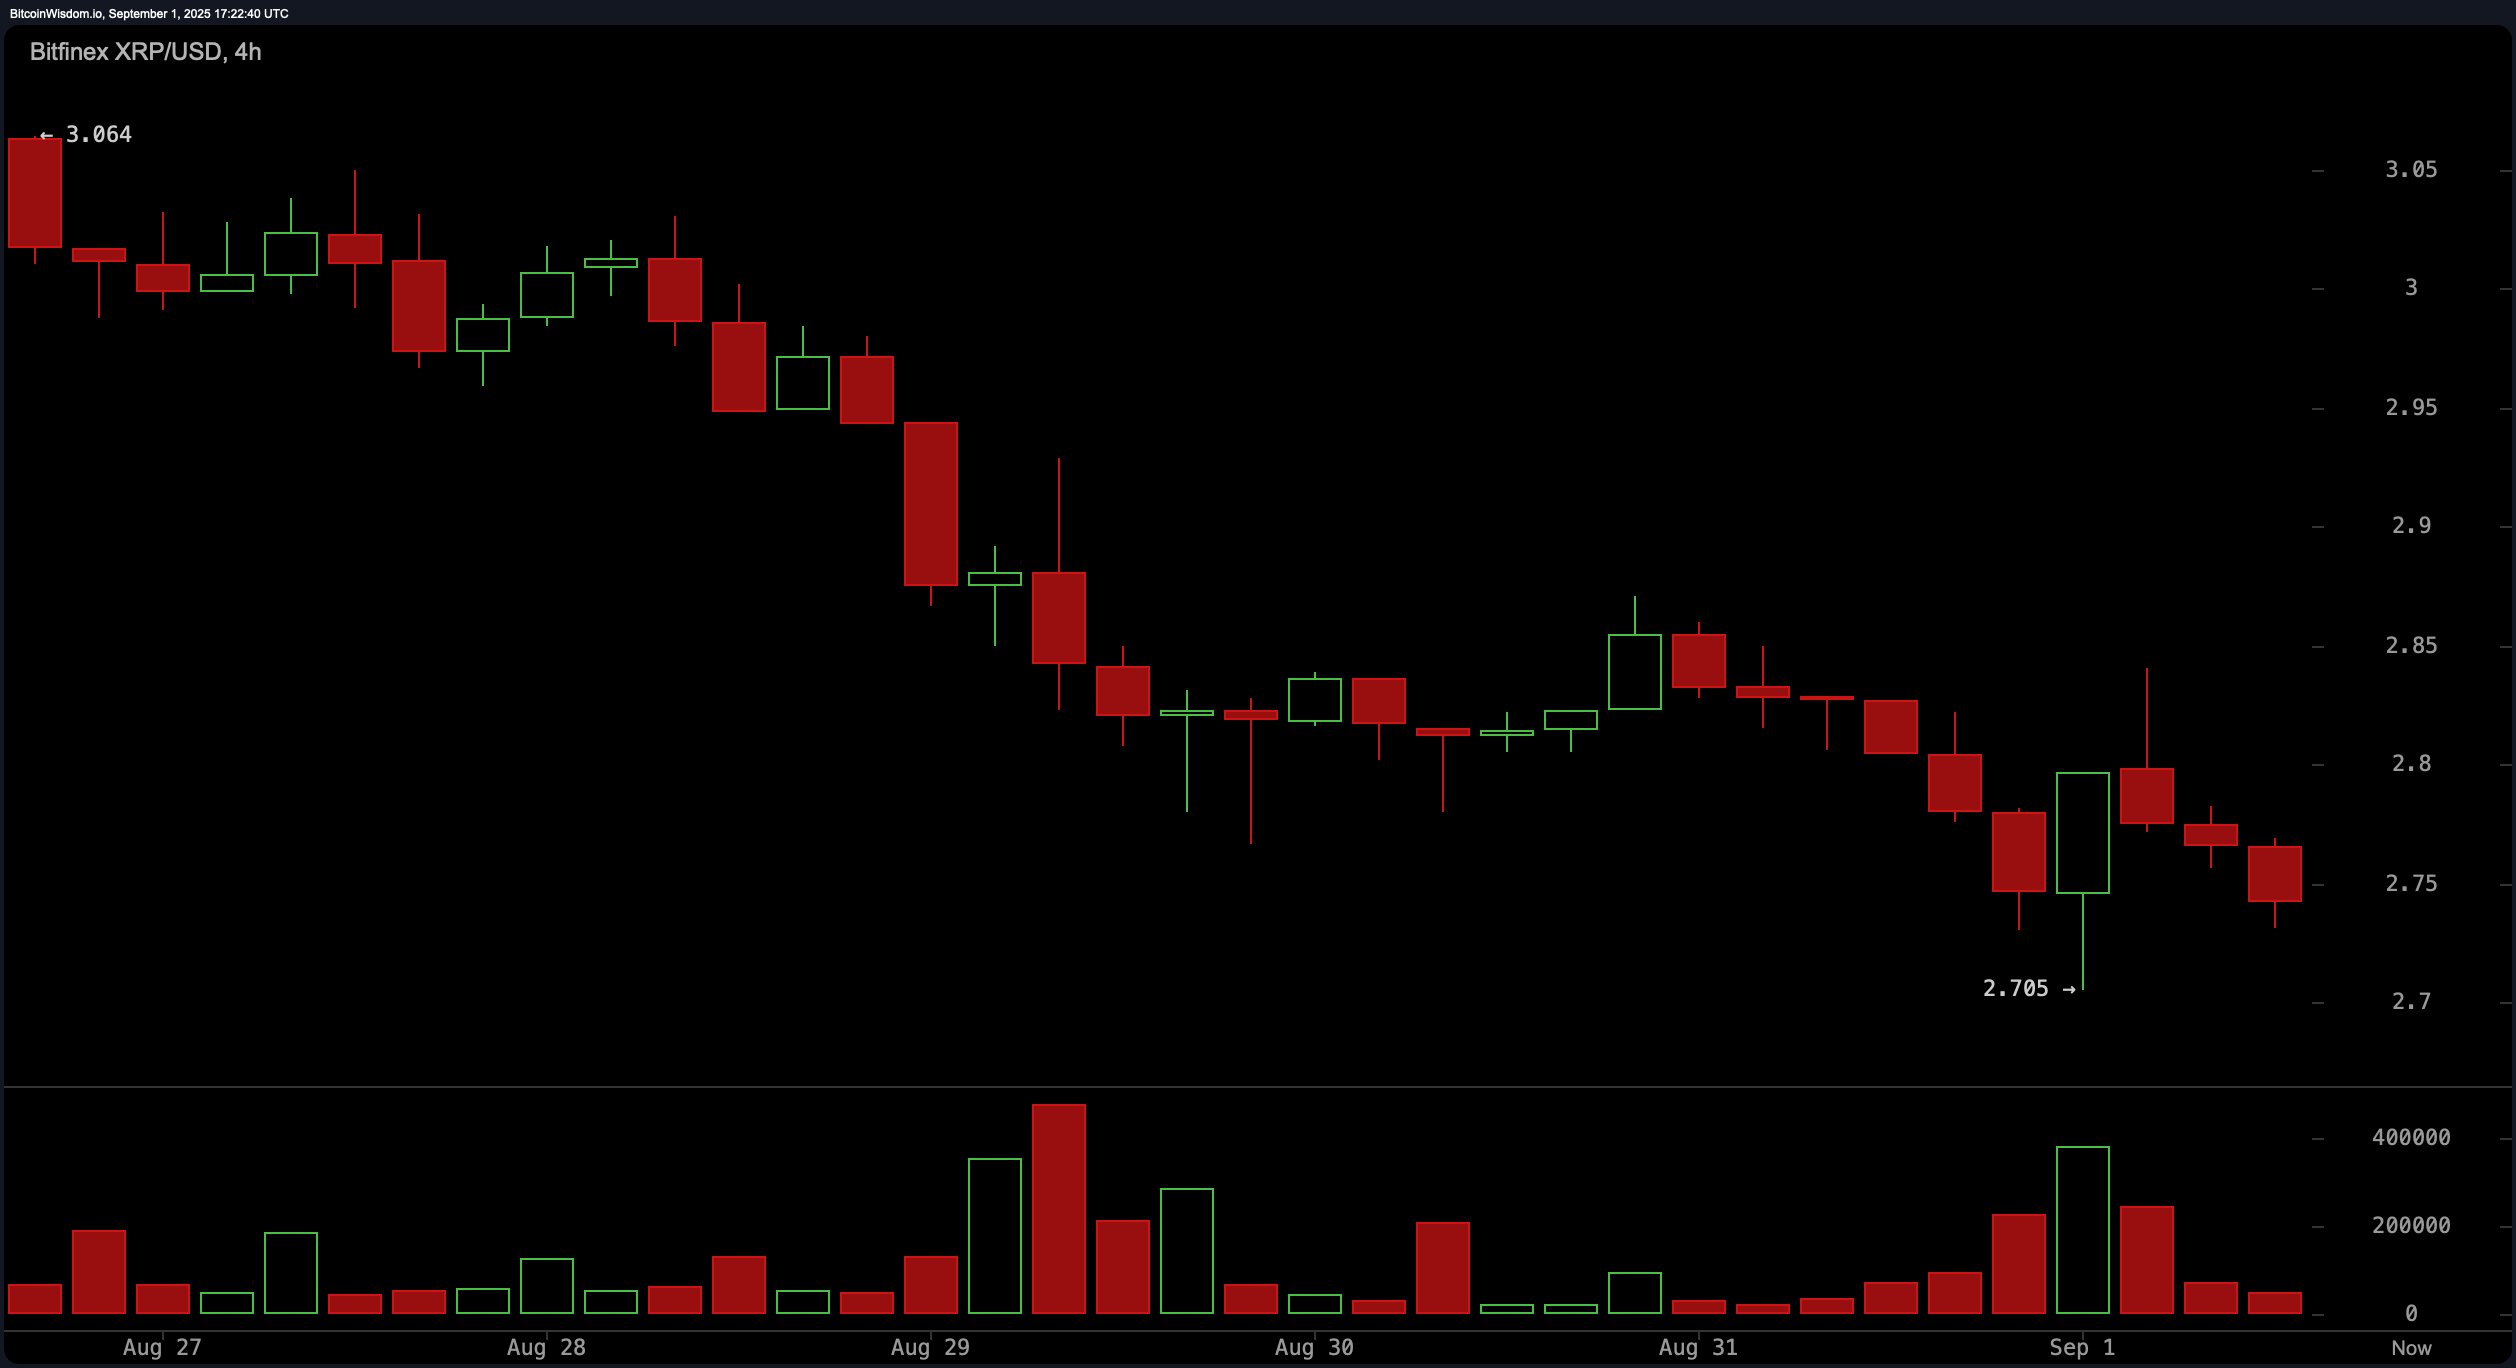
The 4-hour chart confirms a consistent descending channel since August 29, as price action has been characterized by a sequence of failed rebounds and heavier volume on red candles. Rebounds into the $2.85 to $2.90 range have repeatedly encountered resistance, highlighting the dominance of supply over demand. A breakdown below the $2.70 shelf on a 4-hour closing basis could set the stage for further downside toward $2.66 to $2.68, while reclaiming $2.90 on strong volume would be the first bullish trigger.

XRP/USD via Bitfinex 4-hour chart on Sept. 1, 2025.
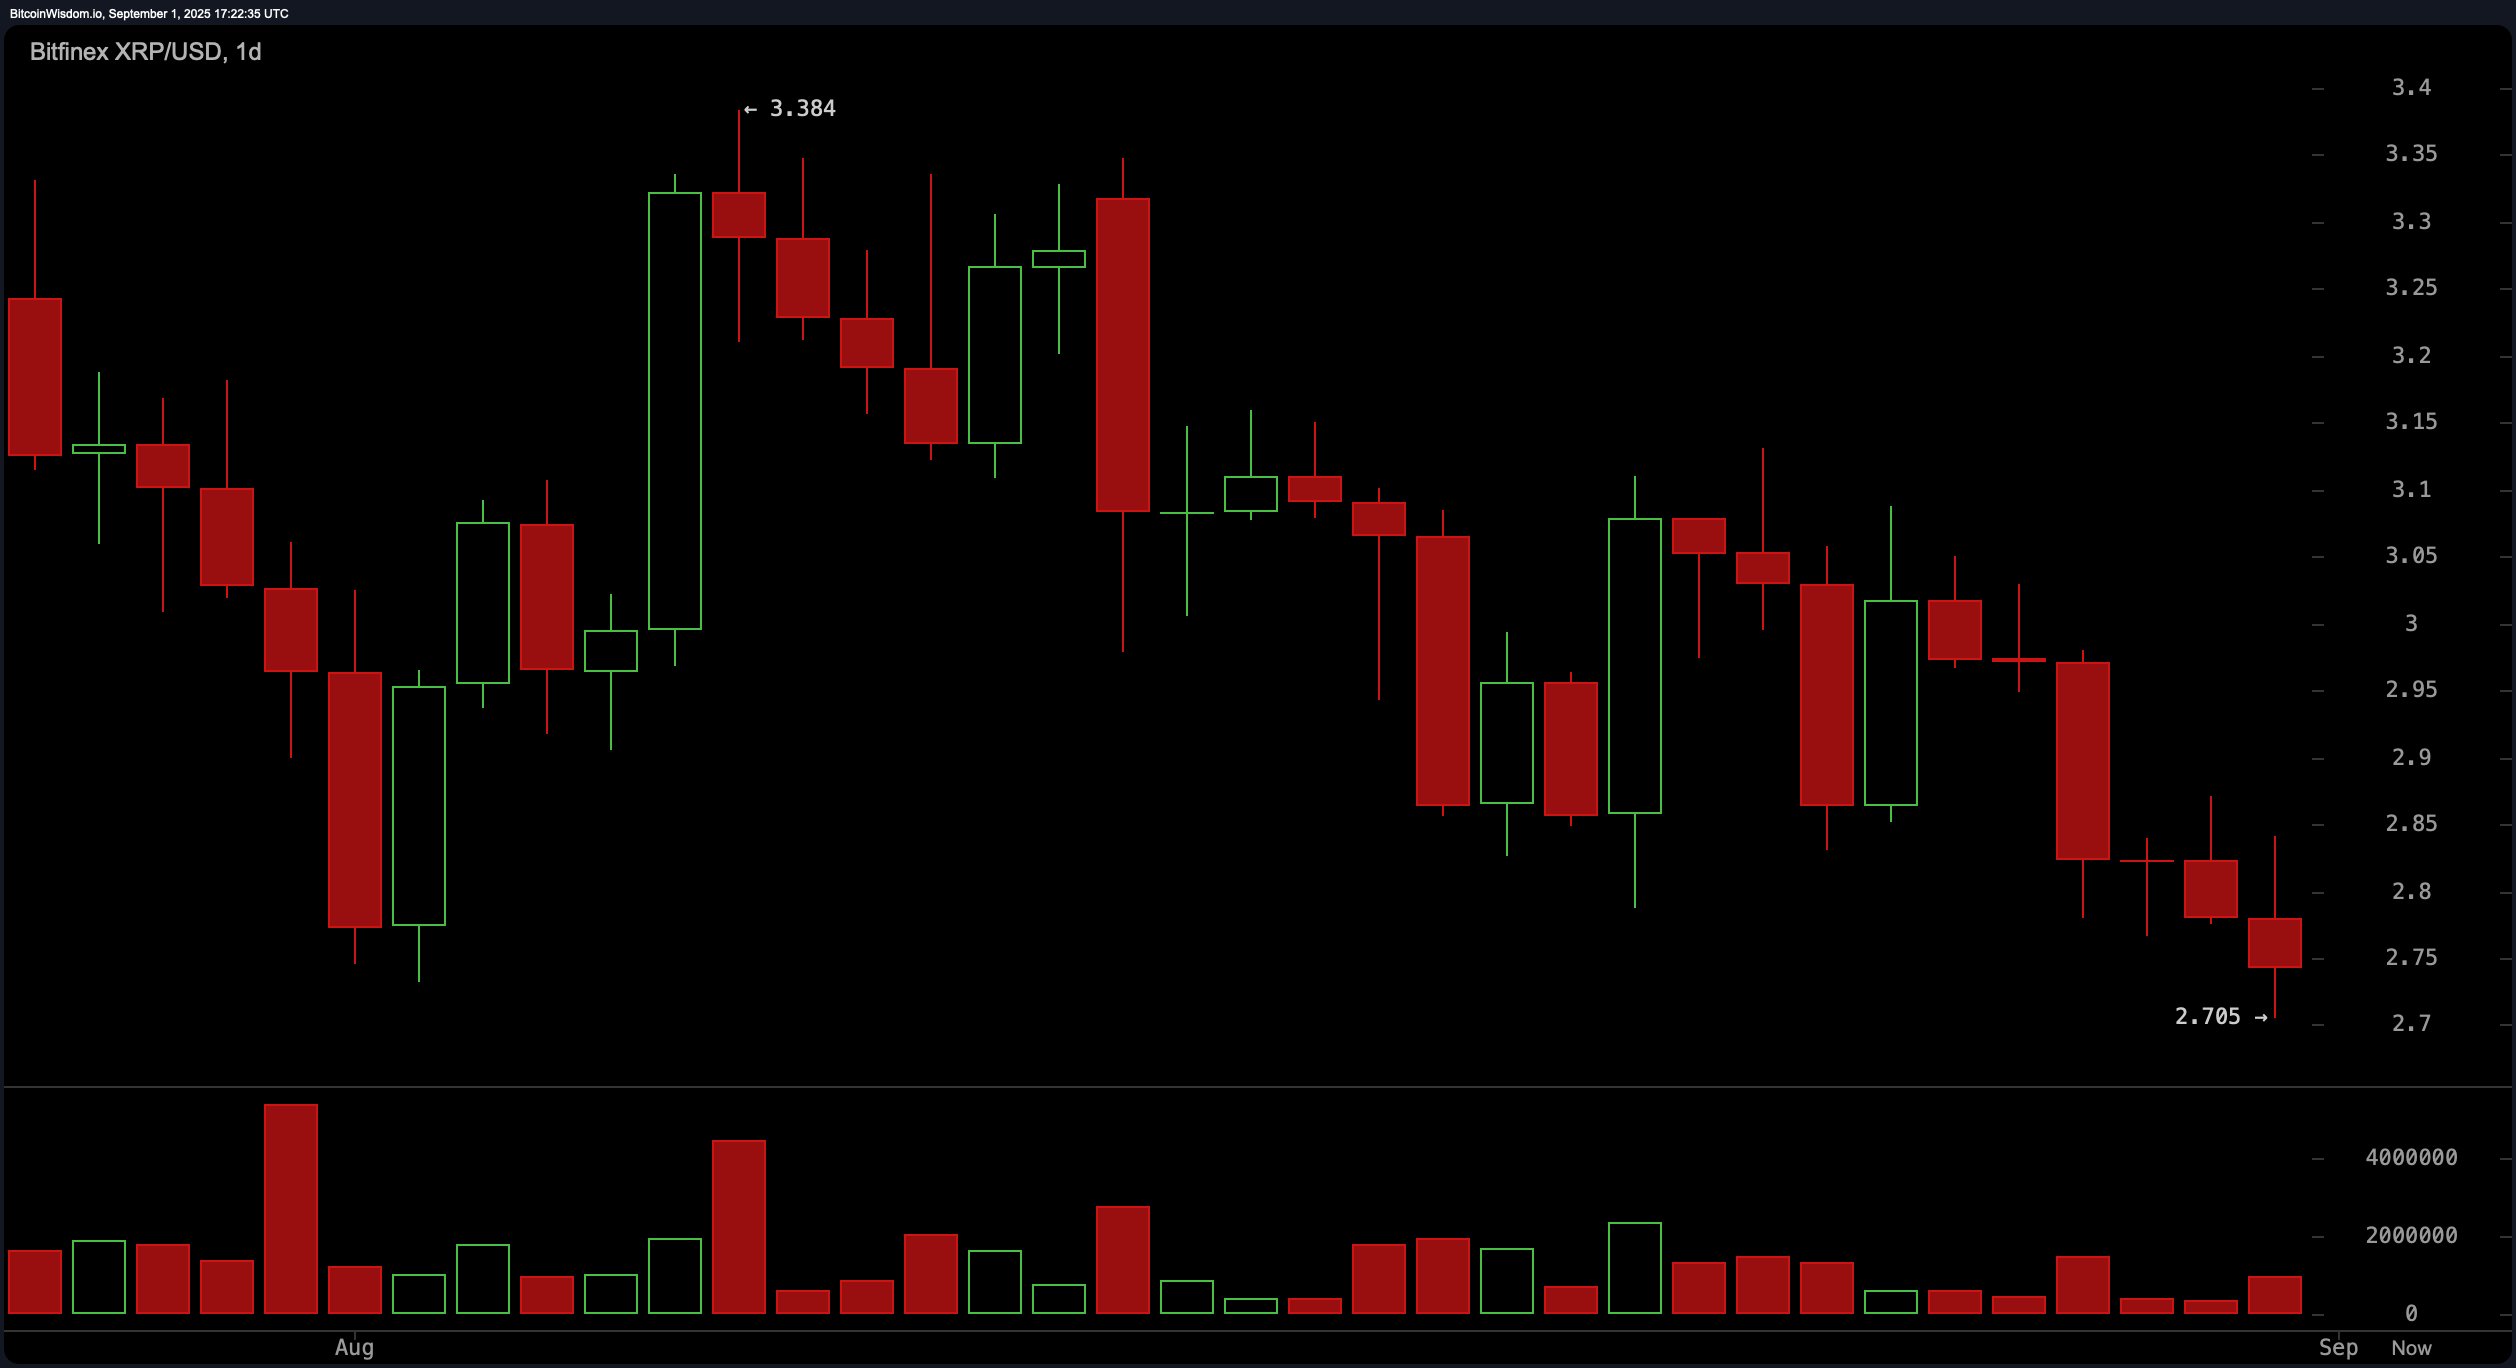
On the daily chart, XRP remains under pressure after a series of lower highs and lower lows from its August pivot near $3.384. The $2.70 to $2.75 area is a critical support zone, with the latest low marked at $2.705. Sellers continue to reject attempts to push above $3.00, making any rallies short-lived. Until the price reclaims and sustains above the $2.90 to $3.00 zone, the broader trend remains bearish, with potential downside continuation if current levels fail to hold.

XRP/USD via Bitfinex 1-day chart on Sept. 1, 2025.
Oscillators present a mixed but overall cautious outlook. The relative strength index (RSI) reads 39.09, the Stochastic oscillator is at 9.15, and the commodity channel index (CCI) sits at −150.05 — all of which indicate a neutral momentum environment. The average directional index (ADX 14) at 18.41 suggests a weak trend. However, the momentum oscillator is at −0.33 and the moving average convergence divergence (MACD) is at −0.0665, both signaling a negative bias.
Moving averages (MAs) further reinforce the bearish sentiment across short- to medium-term horizons. All major short-term moving averages — including the 10-period exponential moving average (EMA 10) at $2.874, the 10-period simple moving average (SMA 10) at $2.903, the 20-period EMA at $2.942, and the 20-period SMA at $2.973 — are signaling bearish action. Notably, the 100-period EMA at $2.768 and the 100-period SMA at $2.670 are diverging, with the SMA flashing a rare bullish signal. Long-term signals from the 200-period EMA at $2.507 and 200-period SMA at $2.483 both indicate buying conditions, suggesting a potential long-term base despite near-term volatility.
Bull Verdict:
While XRP remains under short-term pressure, the presence of long-term buy signals from the 100-period and 200-period Simple Moving Averages (SMA) and Exponential Moving Averages (EMA) suggests potential for accumulation at current levels. A sustained reclaim of the $2.90–$3.00 resistance zone, accompanied by increased volume, could shift momentum and reignite a bullish trend toward $3.10 and beyond.
Bear Verdict:
XRP continues to exhibit technical weakness across the 1-hour, 4-hour, and daily charts, with lower highs, rejected rallies, and heavy resistance below $3.00. The dominance of sell signals across nearly all key moving averages and oscillators supports a bearish bias, with downside risk accelerating if the $2.70 support level breaks on a closing basis.
免责声明:本文章仅代表作者个人观点,不代表本平台的立场和观点。本文章仅供信息分享,不构成对任何人的任何投资建议。用户与作者之间的任何争议,与本平台无关。如网页中刊载的文章或图片涉及侵权,请提供相关的权利证明和身份证明发送邮件到support@aicoin.com,本平台相关工作人员将会进行核查。


