Looking back at the market at the beginning of this week, on the 26th, Tuesday, Bitcoin's downward trend intensified, with the price briefly falling below $109,000, reaching a low of $108,559, marking the lowest point in nearly a month and a half. The main reason for this rapid decline was the continuous outflow from Bitcoin ETFs, with a total outflow of approximately $1.2 billion in a single week, breaking the stable net inflow pattern led by institutions this year. Retail investors tend to reduce their positions during high volatility, amplifying short-term selling pressure.
This week, the overall market capitalization of the cryptocurrency market fell by 0.53%, but positive events are about to unfold. Federal Reserve Governor Waller stated support for a 25 basis point rate cut at the Fed's September meeting, expecting further cuts in the next 3 to 6 months; unless the August employment report shows significant economic weakness while inflation remains well-controlled, he does not believe a larger rate cut is necessary in September. Excluding the temporary impact of tariffs, the potential inflation rate is close to 2%; the policy rate is "moderately restrictive," expected to be 1.25 to 1.5 percentage points above the neutral rate. The probability of the Fed maintaining interest rates in September is 13.8%, while the probability of a 25 basis point cut is 86.2%. The probability of the Fed maintaining interest rates in October is 6.7%, with a cumulative probability of a 25 basis point cut at 49.1% and a cumulative probability of a 50 basis point cut at 44.2%.
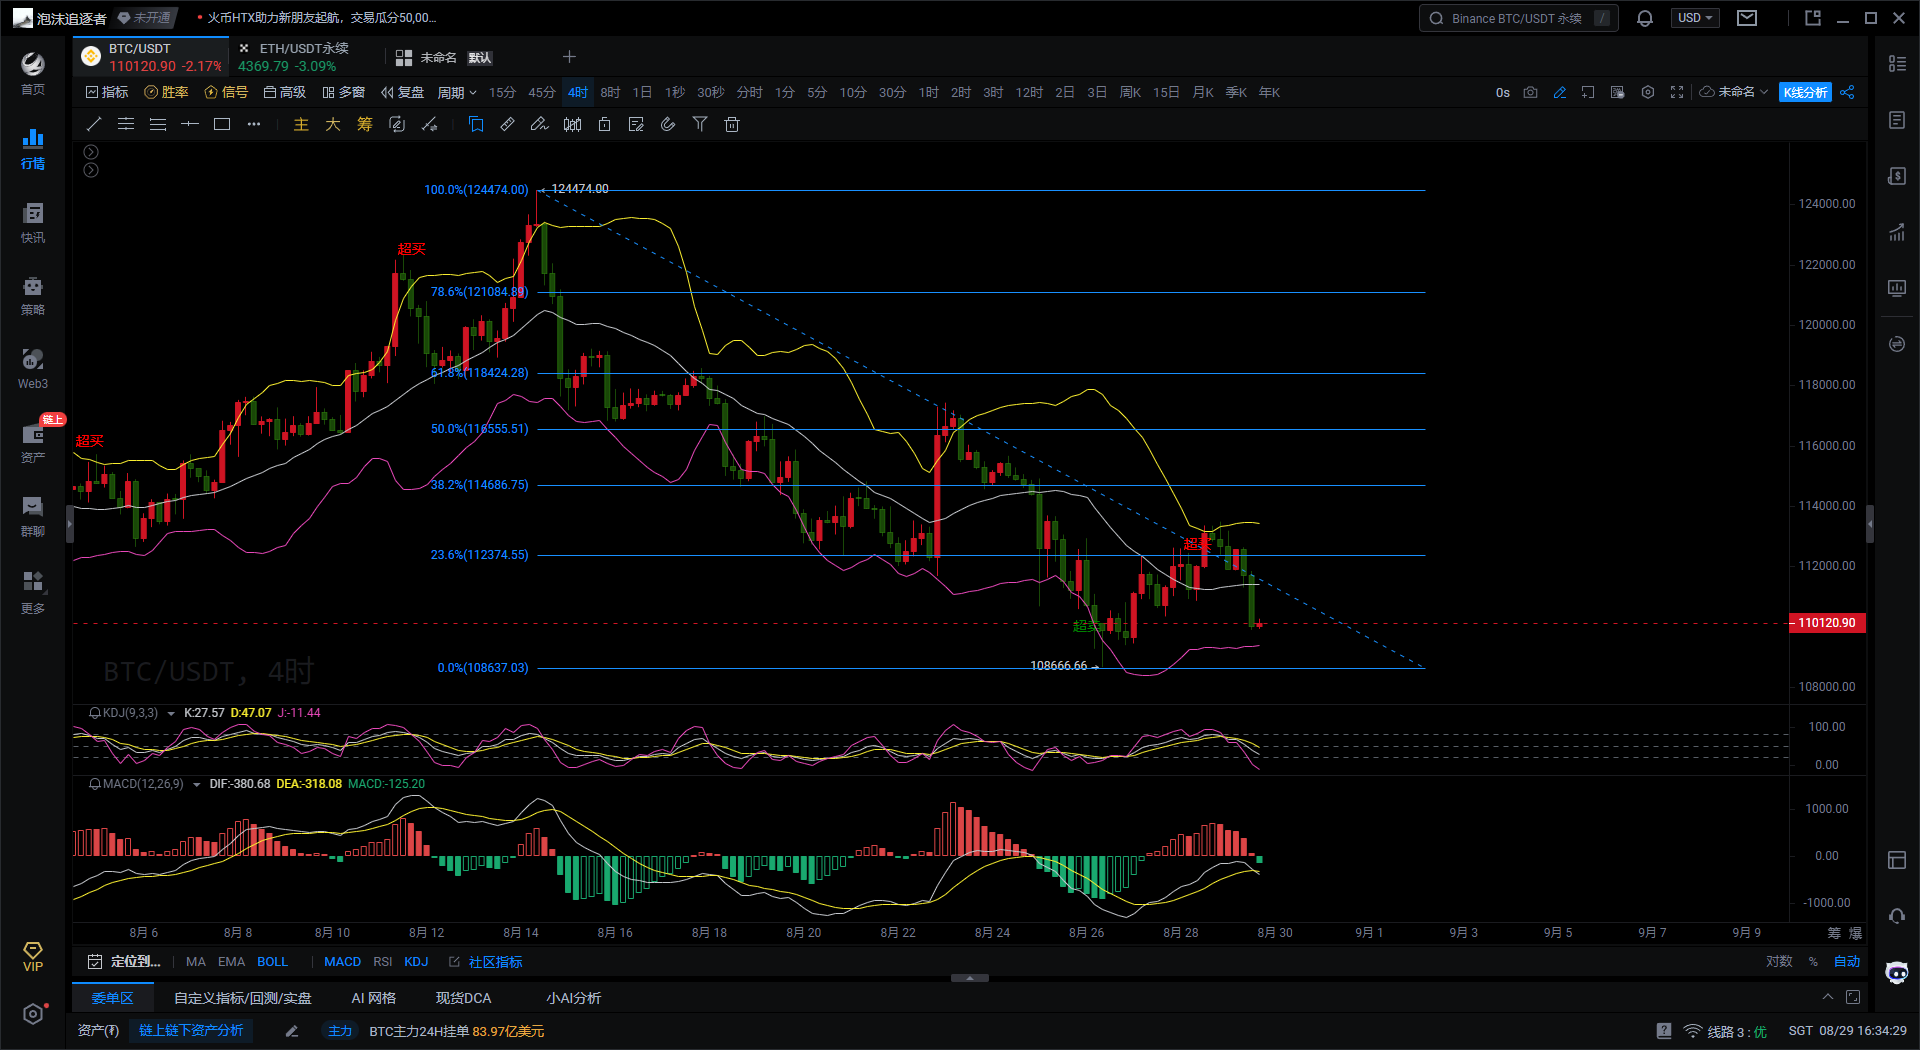
Bitcoin Four-Hour Chart

Bitcoin's technical indicators show a weak short-term trend, but there is a possibility of a rebound. In terms of the MACD indicator, the DIF line and DEA line are operating below the 0 axis and have formed a death cross, with the MACD red histogram continuing to expand, indicating that bears have regained dominance and downward momentum is strengthening, which may continue to test the lower support level in the short term.
The KDJ indicator shows a K value of 27, a D value of 47, and a J value that has dropped to -11, nearing the oversold area. Although the current indicators show weakness, if a golden cross can form at a low level, it may trigger a technical rebound. This indicates that Bitcoin's price is close to a short-term oversold state, and a rebound may occur at any time.
From the Bollinger Bands indicator, Bitcoin's price is currently operating near the lower band at around $109,300. The middle band at $113,500 and the upper band at $118,000 constitute resistance above. The current price is in the support area of the Bollinger Bands lower band, with expectations of a rebound in the short term. However, it is important to note that if the price effectively breaks below the lower band support, it may open up greater downward space.
Fibonacci retracement analysis shows that Bitcoin's price is oscillating below the 23.6% retracement level. The key support level is around $108,600; if this position can be held, there is hope for a rebound to the $112,300-$114,600 range to test the 38.2% resistance level. Similarly, if the support level of $108,600 is effectively broken, it may accelerate the downward trend.
In summary, although various technical indicators show that bears dominate in the short term, the existence of an oversold state and key support levels makes the possibility of a rebound significant. It is essential to closely monitor the gains and losses of the $108,600 support level, as well as whether the KDJ indicator can form a golden cross signal at a low level.
Based on the above, the following suggestions are provided for reference:
Consider going long on Bitcoin near $108,600, targeting $112,300-$113,500, with a stop loss at $108,000.
Giving you a 100% accurate suggestion is not as valuable as providing you with the correct mindset and trend. After all, teaching someone to fish is better than giving them a fish; suggestions may earn you a moment, but learning the mindset can earn you a lifetime! The focus is on the mindset, grasping the trend, and planning positions in the market. What I can do is use my practical experience to help you, guiding your investment decisions and management in the right direction.
Written on: (2025-08-29, 16:30)

(Written by - Master Says Coin) Disclaimer: Online publication has delays, and the above suggestions are for reference only. The author is dedicated to research and analysis in the investment fields of Bitcoin, Ethereum, altcoins, foreign exchange, stocks, etc., having been involved in the financial markets for many years and possessing rich practical experience. Investment carries risks; proceed with caution. For more real-time market analysis, please follow the official account Master Says Coin for discussion and exchange.
免责声明:本文章仅代表作者个人观点,不代表本平台的立场和观点。本文章仅供信息分享,不构成对任何人的任何投资建议。用户与作者之间的任何争议,与本平台无关。如网页中刊载的文章或图片涉及侵权,请提供相关的权利证明和身份证明发送邮件到support@aicoin.com,本平台相关工作人员将会进行核查。


