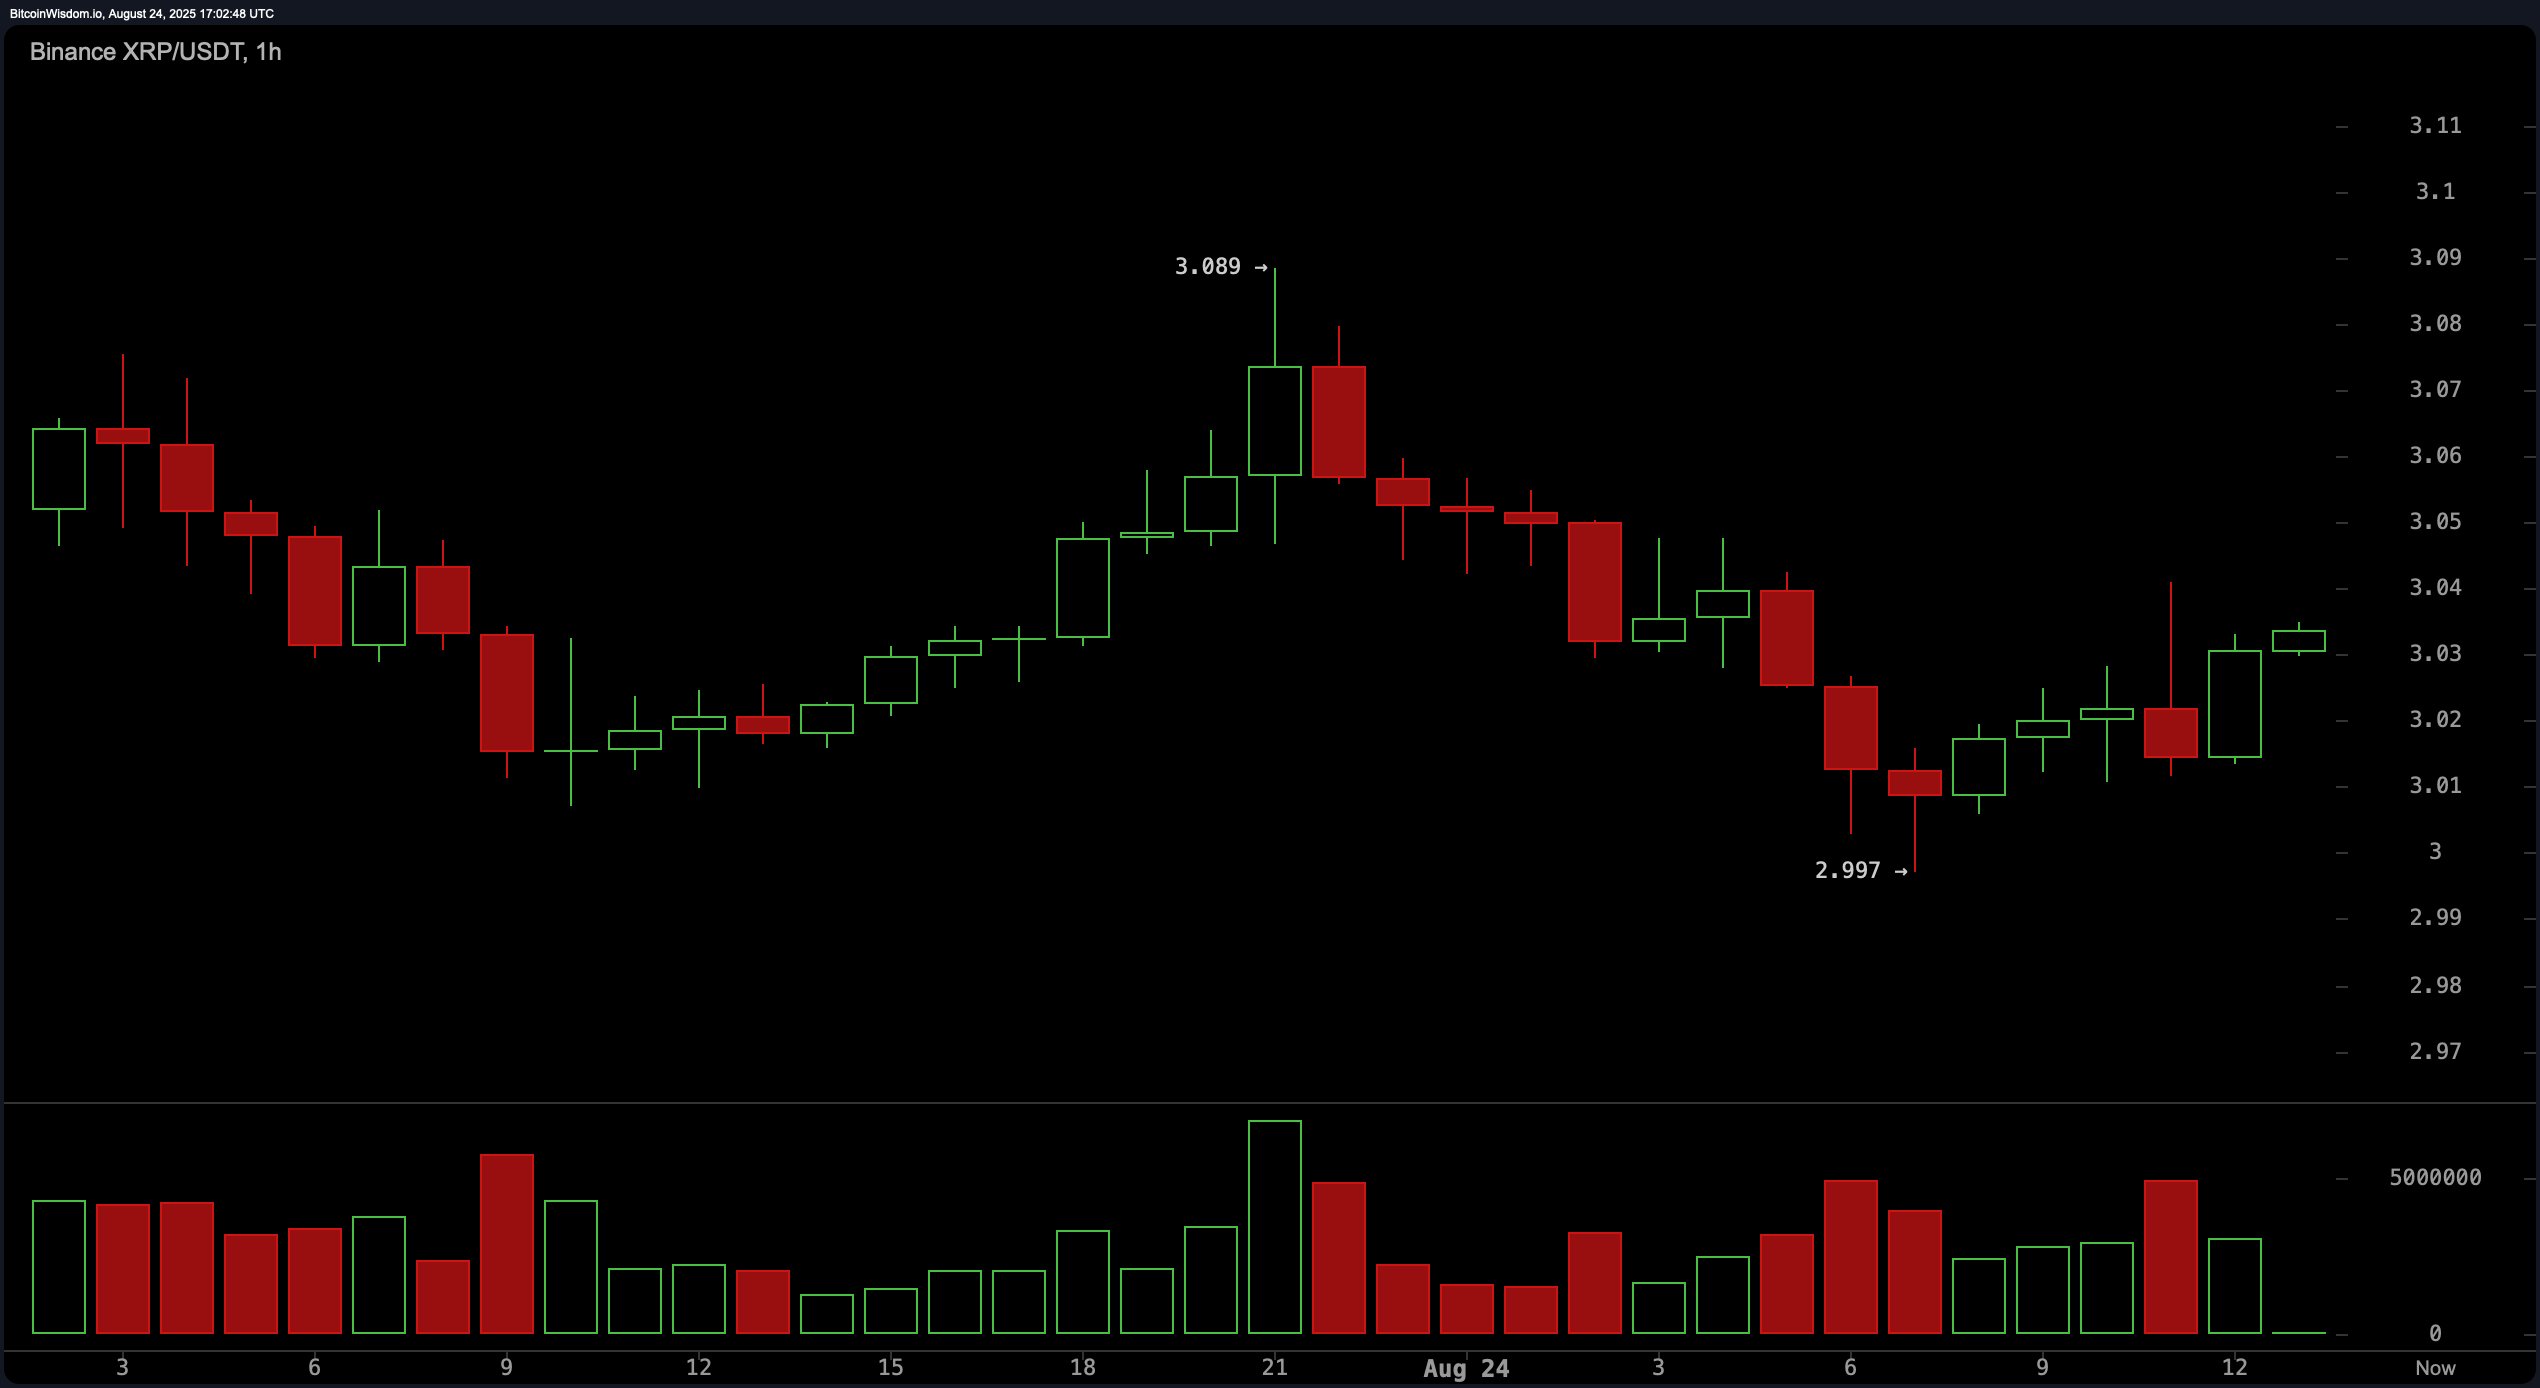
In the 1-hour chart, XRP attempted a micro breakout to $3.089 but faced immediate rejection, followed by a dip to $2.997 that established a higher low. The price action suggests a nascent short-term uptrend, currently hovering near $3.03. However, the movement lacks strong bullish momentum, with trading volume steadily declining. This setup indicates the market is likely awaiting a catalyst, and a confirmed break above $3.06 to $3.09 with increased volume would provide a more convincing bullish signal.

XRP/ USDT via Binance 1-hour chart on Aug. 24, 2025.
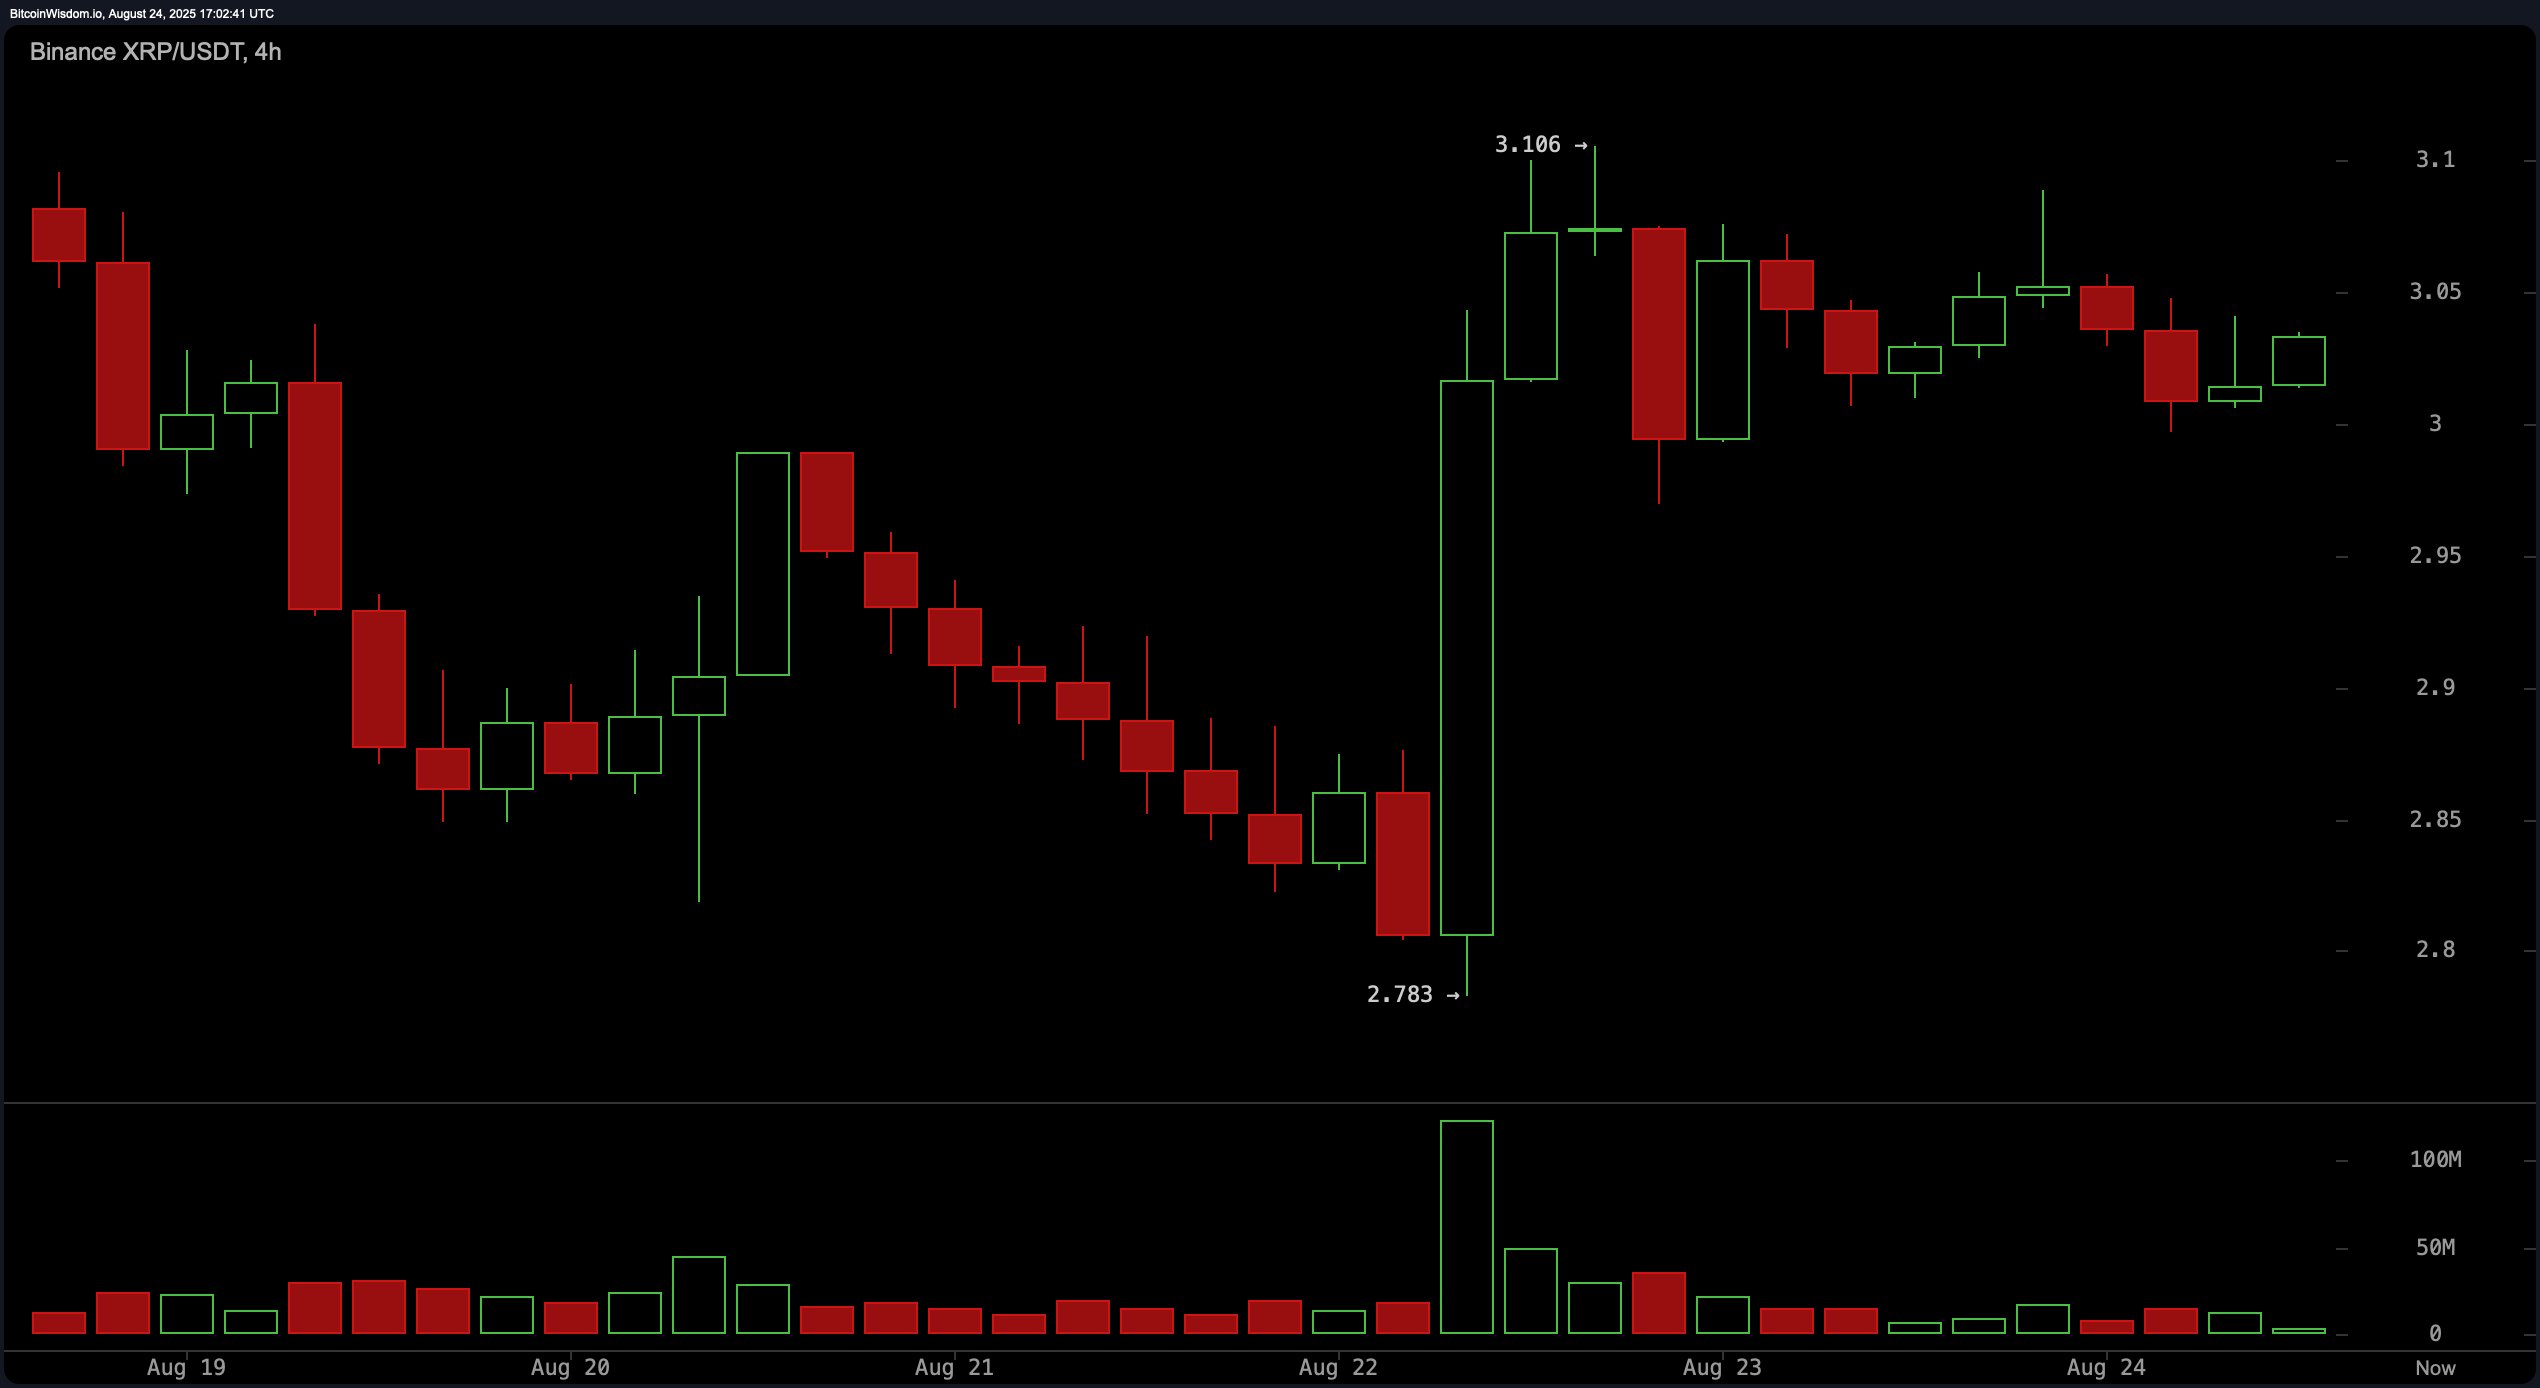
The 4-hour chart paints a picture of consolidation following a sharp upward spike to $3.106 from a reversal point at $2.783. This rally was potentially driven by a short squeeze or a news catalyst, as suggested by the accompanying volume surge. Since then, XRP has been moving sideways between $3.00 and $3.05, forming a structure that could evolve into a bullish flag. A breakout above $3.11 on strong volume would target the $3.30 to $3.40 resistance range. Conversely, a decline below $2.98 would negate the bullish setup and shift the near-term outlook to bearish.

XRP/ USDT via Binance 4-hour chart on Aug. 24, 2025.
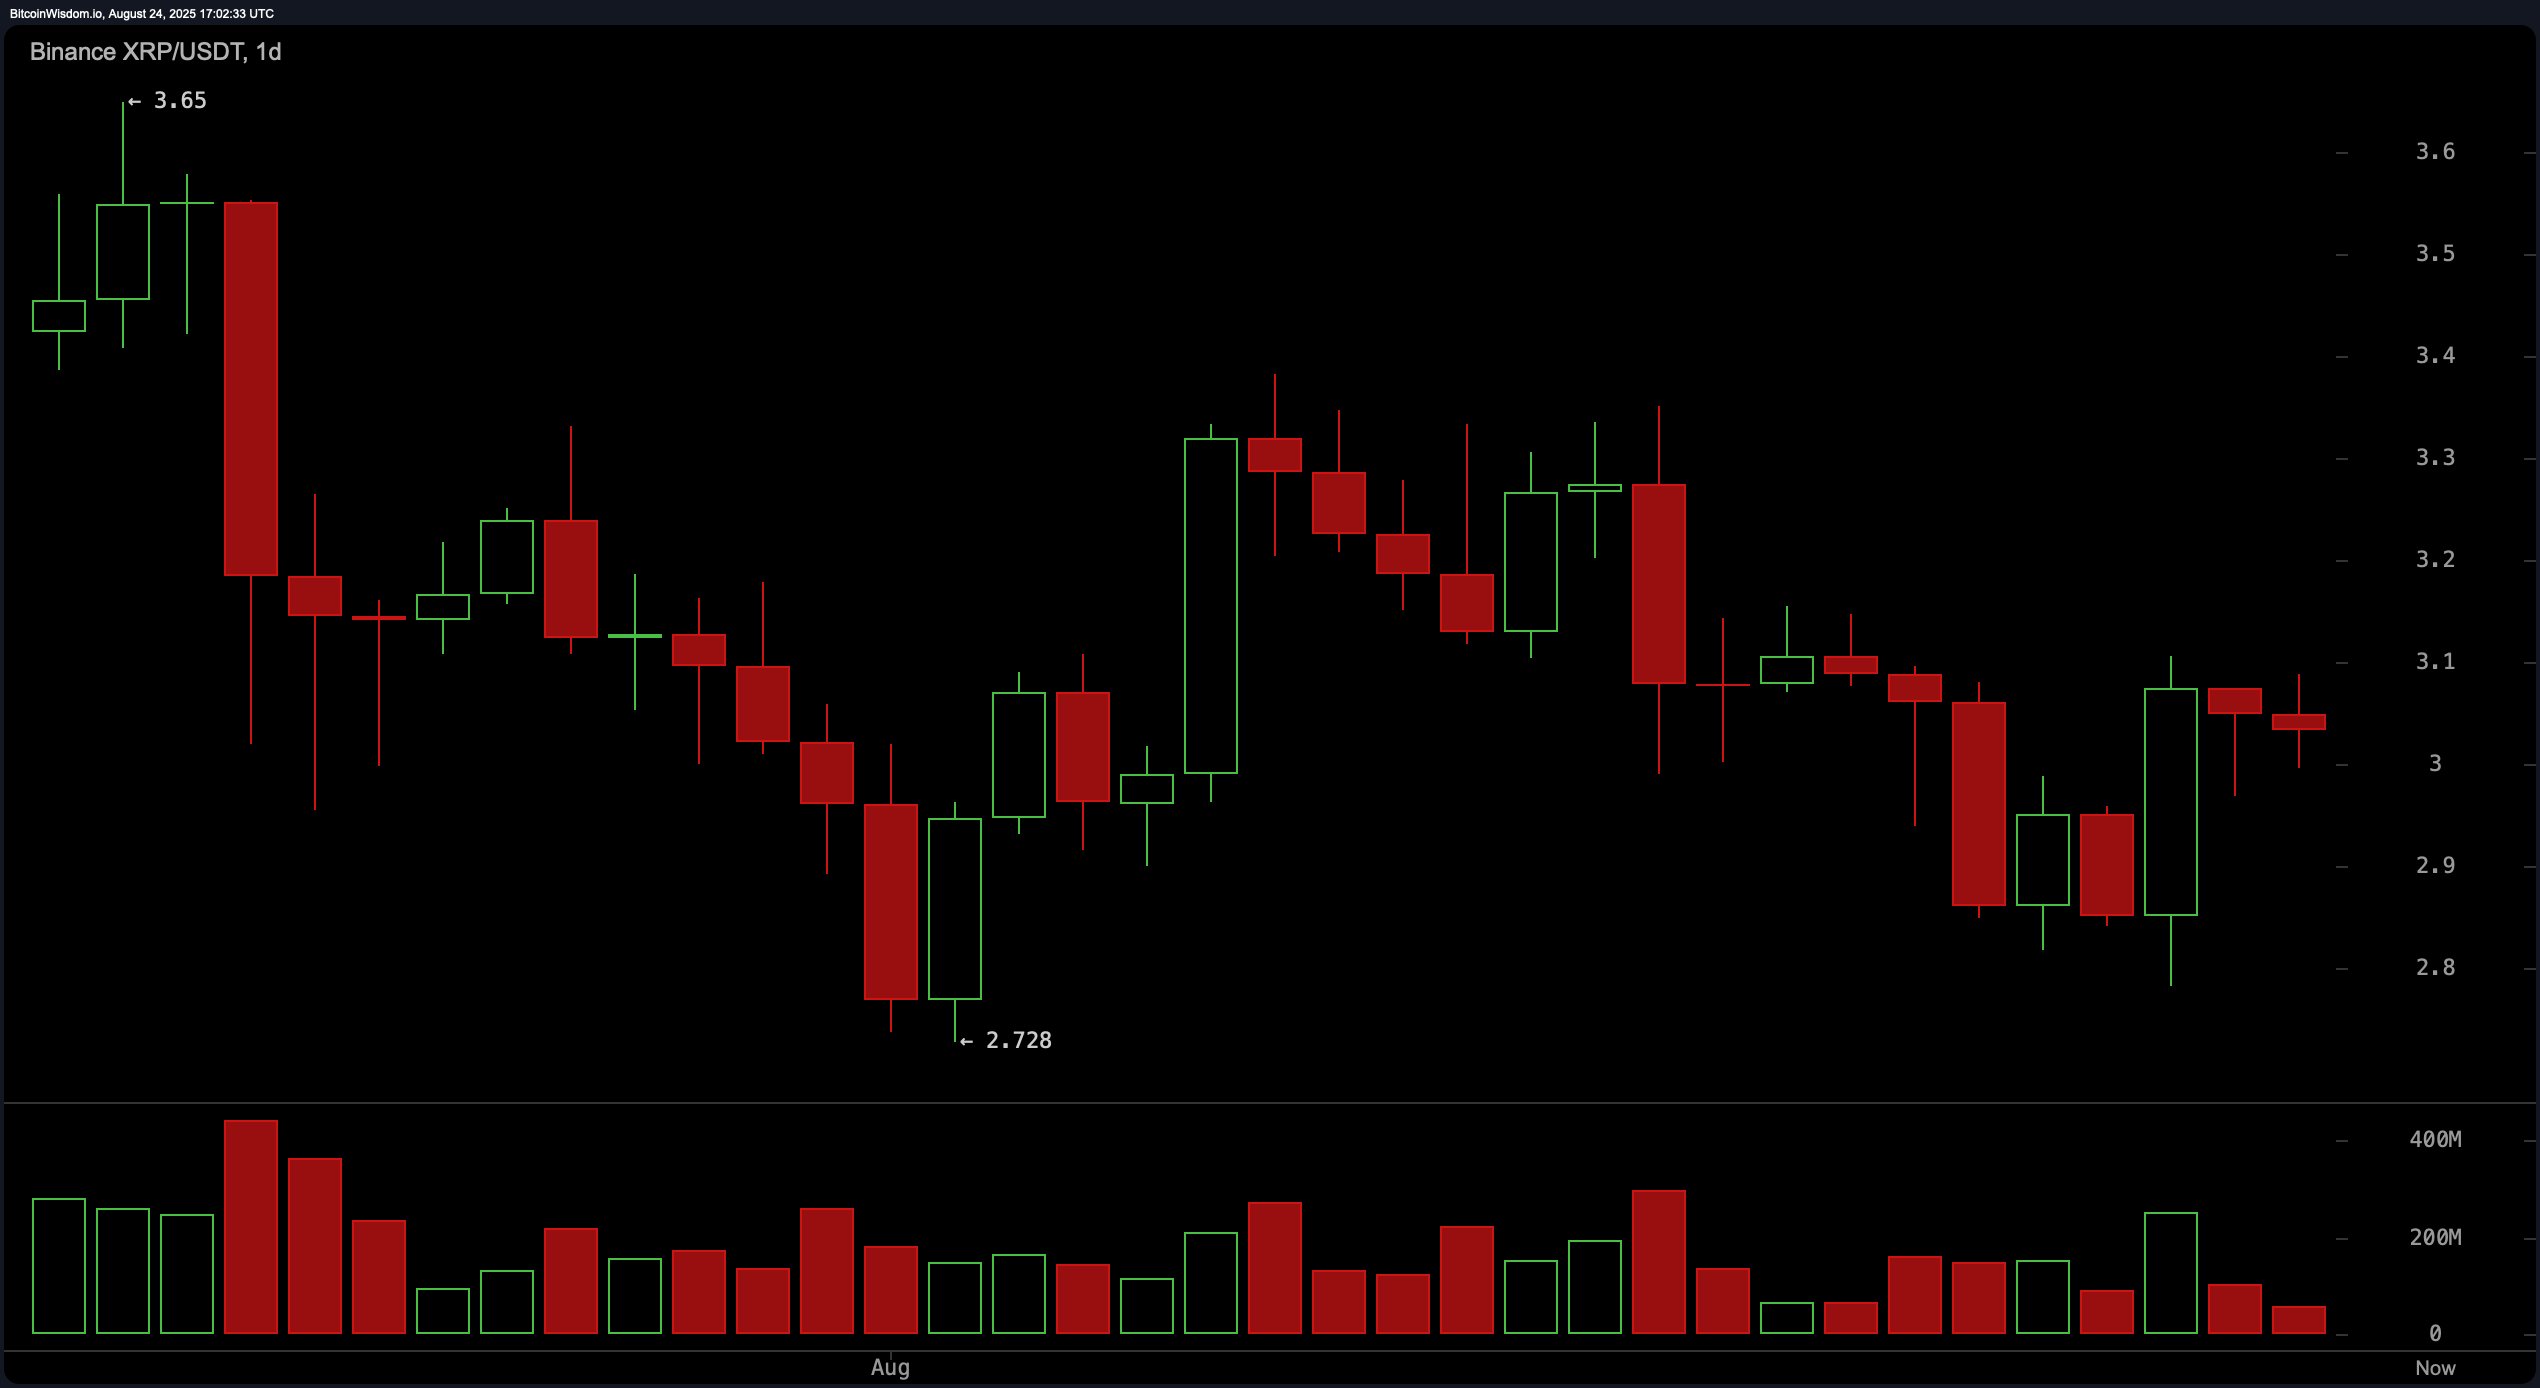
From a broader perspective, the daily chart reveals a continuing macro downtrend, with XRP having formed a series of lower highs and lower lows. The high and low for this timeframe are $3.65 and $2.728, respectively, with current prices consolidating between $3.00 and $3.10. A failed bullish breakout above $3.30 earlier in the trend further confirms weak bullish conviction. Notably, trading volume remains subdued except during significant red candles, indicating limited buyer interest. A close above $3.30, supported by robust volume, would be necessary to shift the daily outlook from bearish to neutral or bullish.

XRP/ USDT via Binance daily chart on Aug. 24, 2025.
Oscillator readings across all timeframes convey a mixed but generally neutral bias. The relative strength index (RSI) at 49.44, the Stochastic oscillator at 47.06, and the commodity channel index (CCI) at -34.42 all indicate neutrality. Similarly, the average directional index (ADX) on Sunday afternoon at 17.91, and the Awesome oscillator at -0.14 do not provide a decisive trend signal. While the momentum indicator at -0.05 offers a mild positive suggestion, the moving average convergence divergence (MACD) at -0.00956 suggests a bearish trend on the horizon. These mixed signals reinforce the notion that the market is in a consolidation phase and lacks strong directional momentum.
Moving averages (MAs) provide a nuanced view of the prevailing trend. On the short-term front, both the 10-period exponential moving average (EMA) at $3.029 and the 10-period simple moving average (SMA) at $3.015 issue bullish signals. However, the 20- and 30-period EMAs and SMAs reflect a bearish alignment with negative signals. In the medium and long term, the 50-, 100-, and 200-period EMAs and SMAs largely favor the bulls, particularly the 100-period EMA at $2.751 and SMA at $2.631, both issuing strong optimism.
This divergence between short- and mid-to-long-term averages underlines market indecision and supports a strategy of caution until a clear breakout direction materializes. XRP futures open interest rose 1.63% in the past 24 hours to $8.37 billion, with Binance and OKX showing the strongest growth at 2.87% and 2.96%, respectively. CME Group remains dominant, holding $1.17 billion in XRP futures contracts.
Bull Verdict:
If XRP breaks above the $3.11 resistance with strong accompanying volume, the short-term outlook turns bullish, potentially targeting the $3.30 to $3.40 zone. Reinforcement from medium- and long-term moving averages supports a continued upward trajectory if buying momentum strengthens.
Bear Verdict:
Failure to hold the $3.00 level, especially a break below $2.98, would invalidate bullish setups and likely trigger a short-term downtrend. The macro downtrend, weak volume on upward moves, and sell signals from mid-range moving averages would all reinforce a bearish continuation toward the $2.80 support zone.
免责声明:本文章仅代表作者个人观点,不代表本平台的立场和观点。本文章仅供信息分享,不构成对任何人的任何投资建议。用户与作者之间的任何争议,与本平台无关。如网页中刊载的文章或图片涉及侵权,请提供相关的权利证明和身份证明发送邮件到support@aicoin.com,本平台相关工作人员将会进行核查。


