This article is only a personal market opinion and does not constitute investment advice. If you act based on it, you bear the risk of profit and loss.
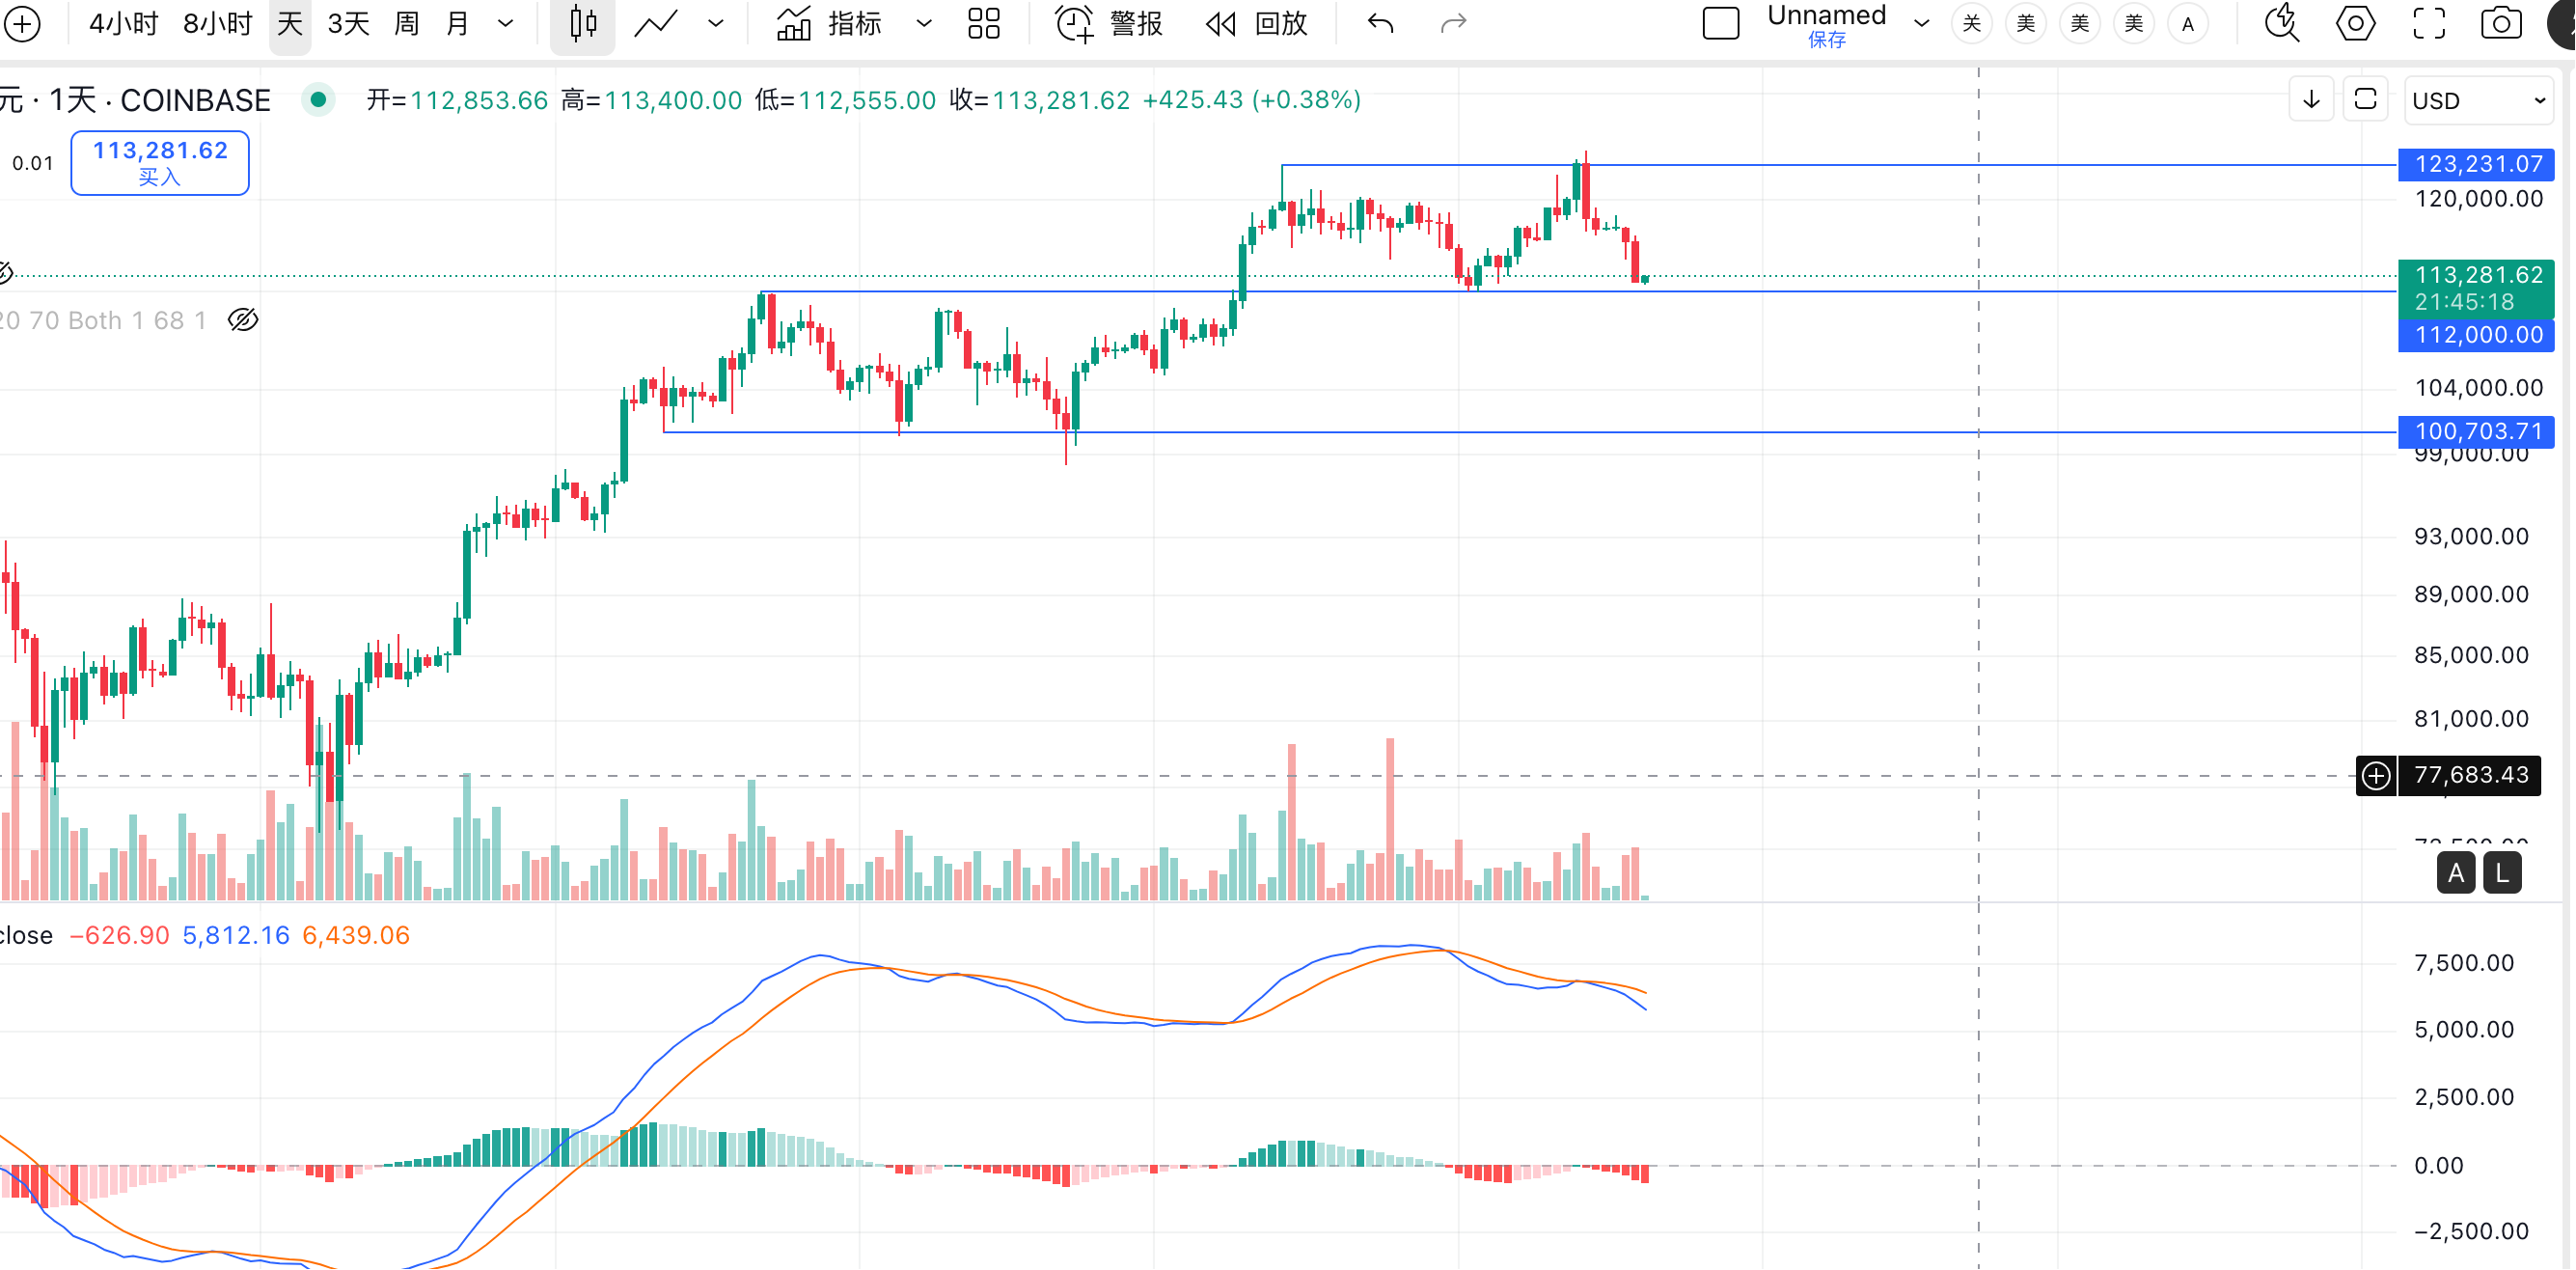
In the article a couple of days ago, I pointed out the pullback risk for ETH and mentioned that the important position for BTC is around 112,000.
With the market developments over the past couple of days, BTC is facing an important test. First, from a technical perspective, BTC has pulled back to a low of 125,000, nearing the lower edge of the consolidation area, which is also the upper edge of the consolidation area from May to July. This is a critical point for the transformation of resistance and support. If it does not break below 112,000, the market may continue to oscillate for a long time or rebound again.
Looking at the daily technical indicators, there is a typical bearish divergence at the new high, indicating a bearish signal. Therefore, if it subsequently breaks below the support level of 112,000, do not hold too many fantasies; it is highly likely to pull back to between 100,000 and 102,000. At that time, when shorting, it is important to set a stop loss to avoid a quick recovery after a drop, preventing holding positions above 112,000.
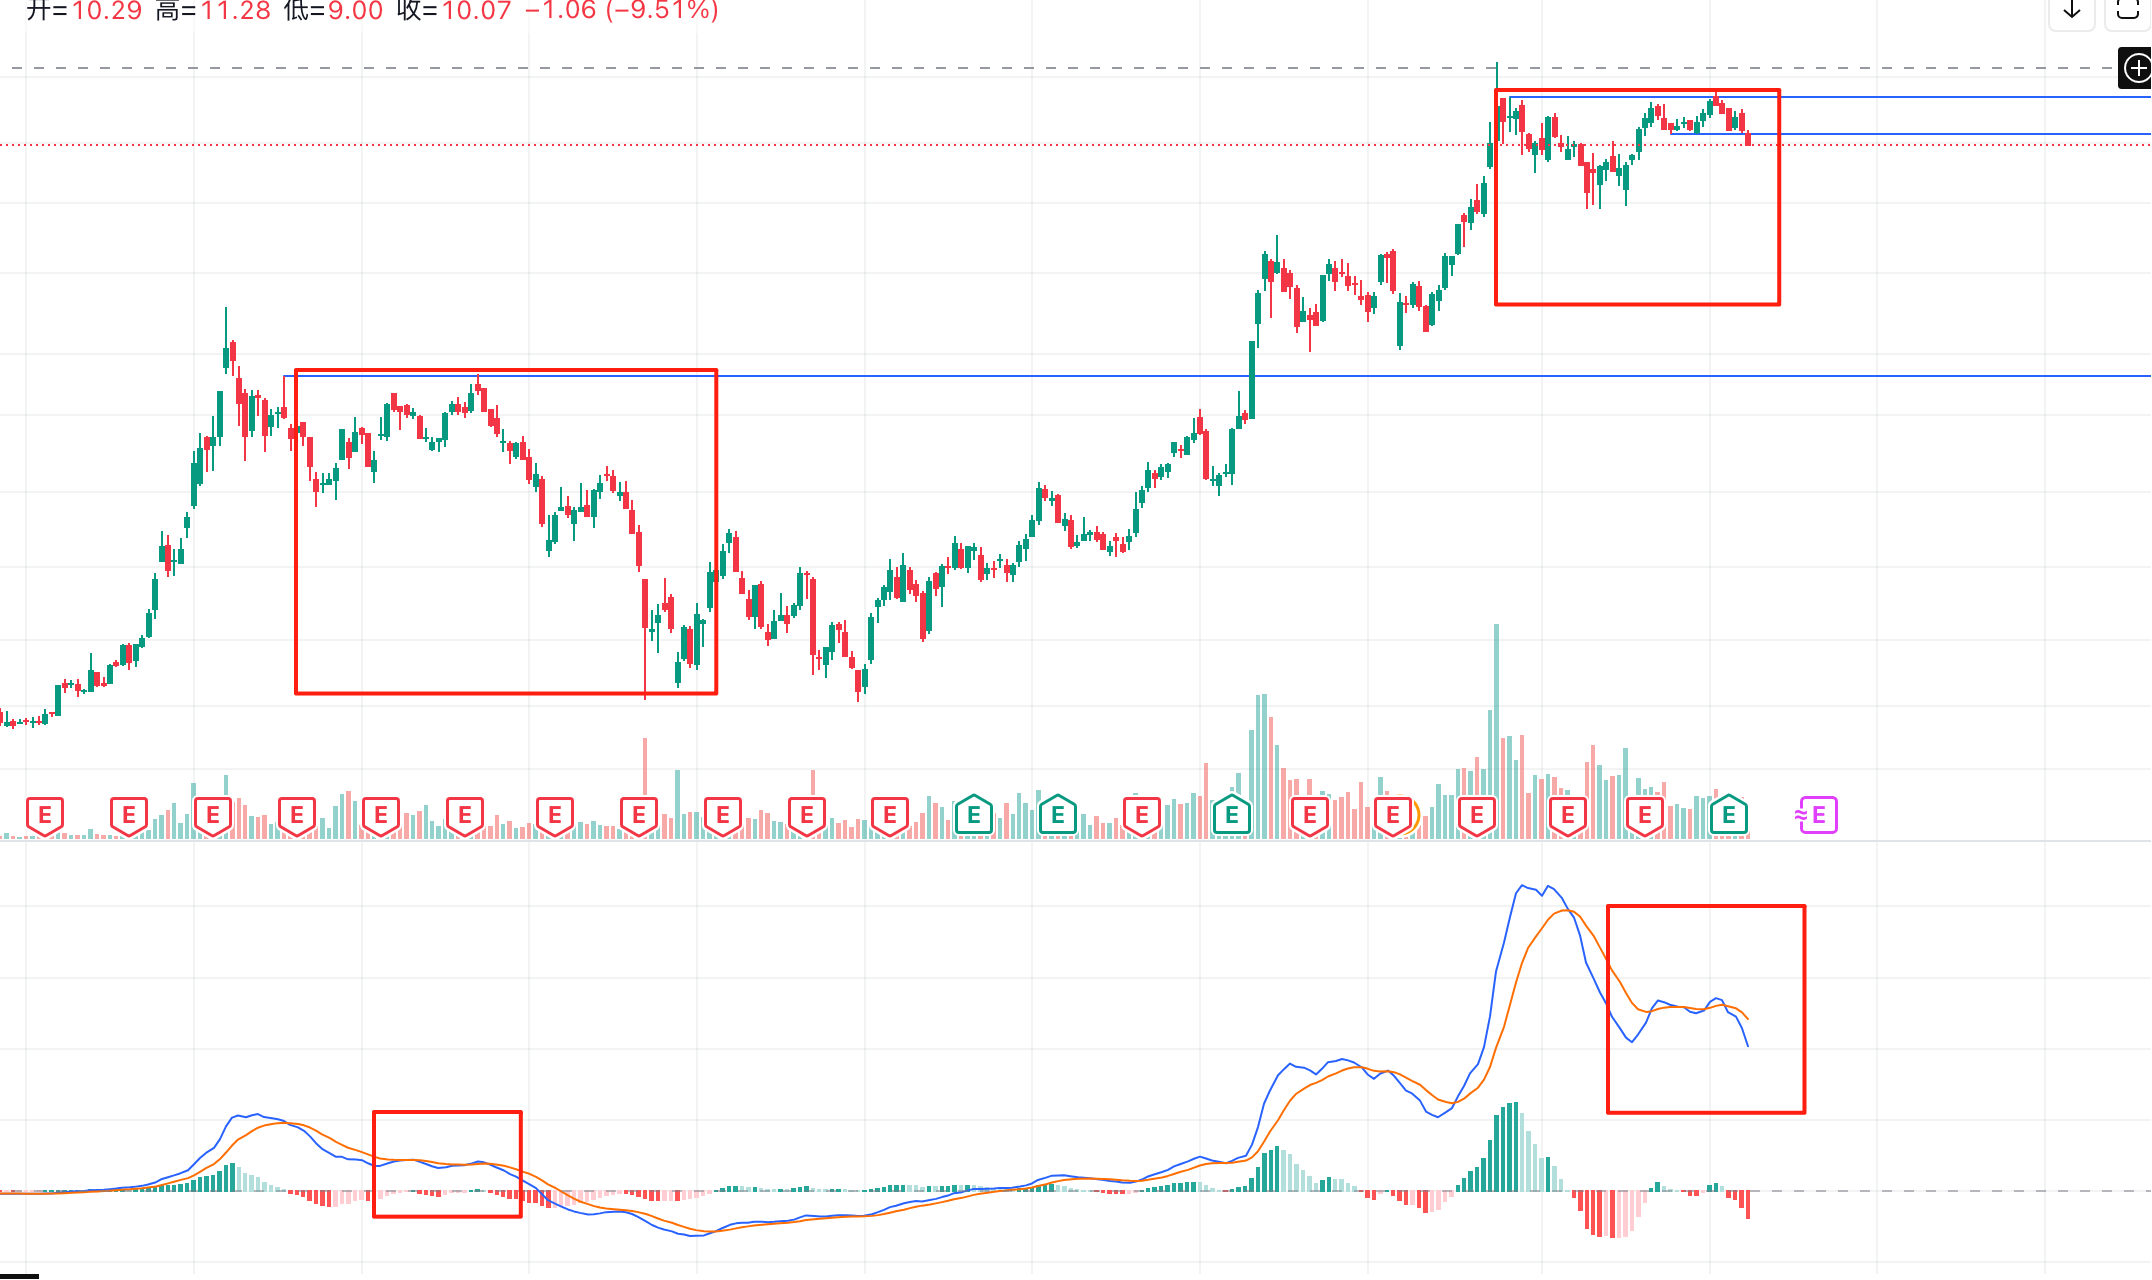
I also mentioned the stock price trend of MicroStrategy, which often leads BTC. Last night's decline saw MSTR's stock price break down, and both the daily and weekly MACD indicators have shown bearish signals. The following chart shows a very typical top divergence in the weekly MACD. After breaking below the platform level, the next target is likely around 300. More critically, this weekly trend of MicroStrategy basically announces a long-term decline, which can be compared to the trend after December 2021.
So for BTC, above 112,000, whether holding or buying/going long near 112,000 is fine, but remember, once it breaks below, all bullish views are inadvisable, and it’s best to exit promptly. Similarly, there is no need to be bearish before breaking below 112,000.
Now looking at ETH, since the recent rise, it has started to pull back as it approaches historical highs. This morning, the price hit a low of 4,060, slightly below the highs of April and December 2020 around 4,090, which is also close to a Fibonacci level, so during the day, ETH's price received some support here.
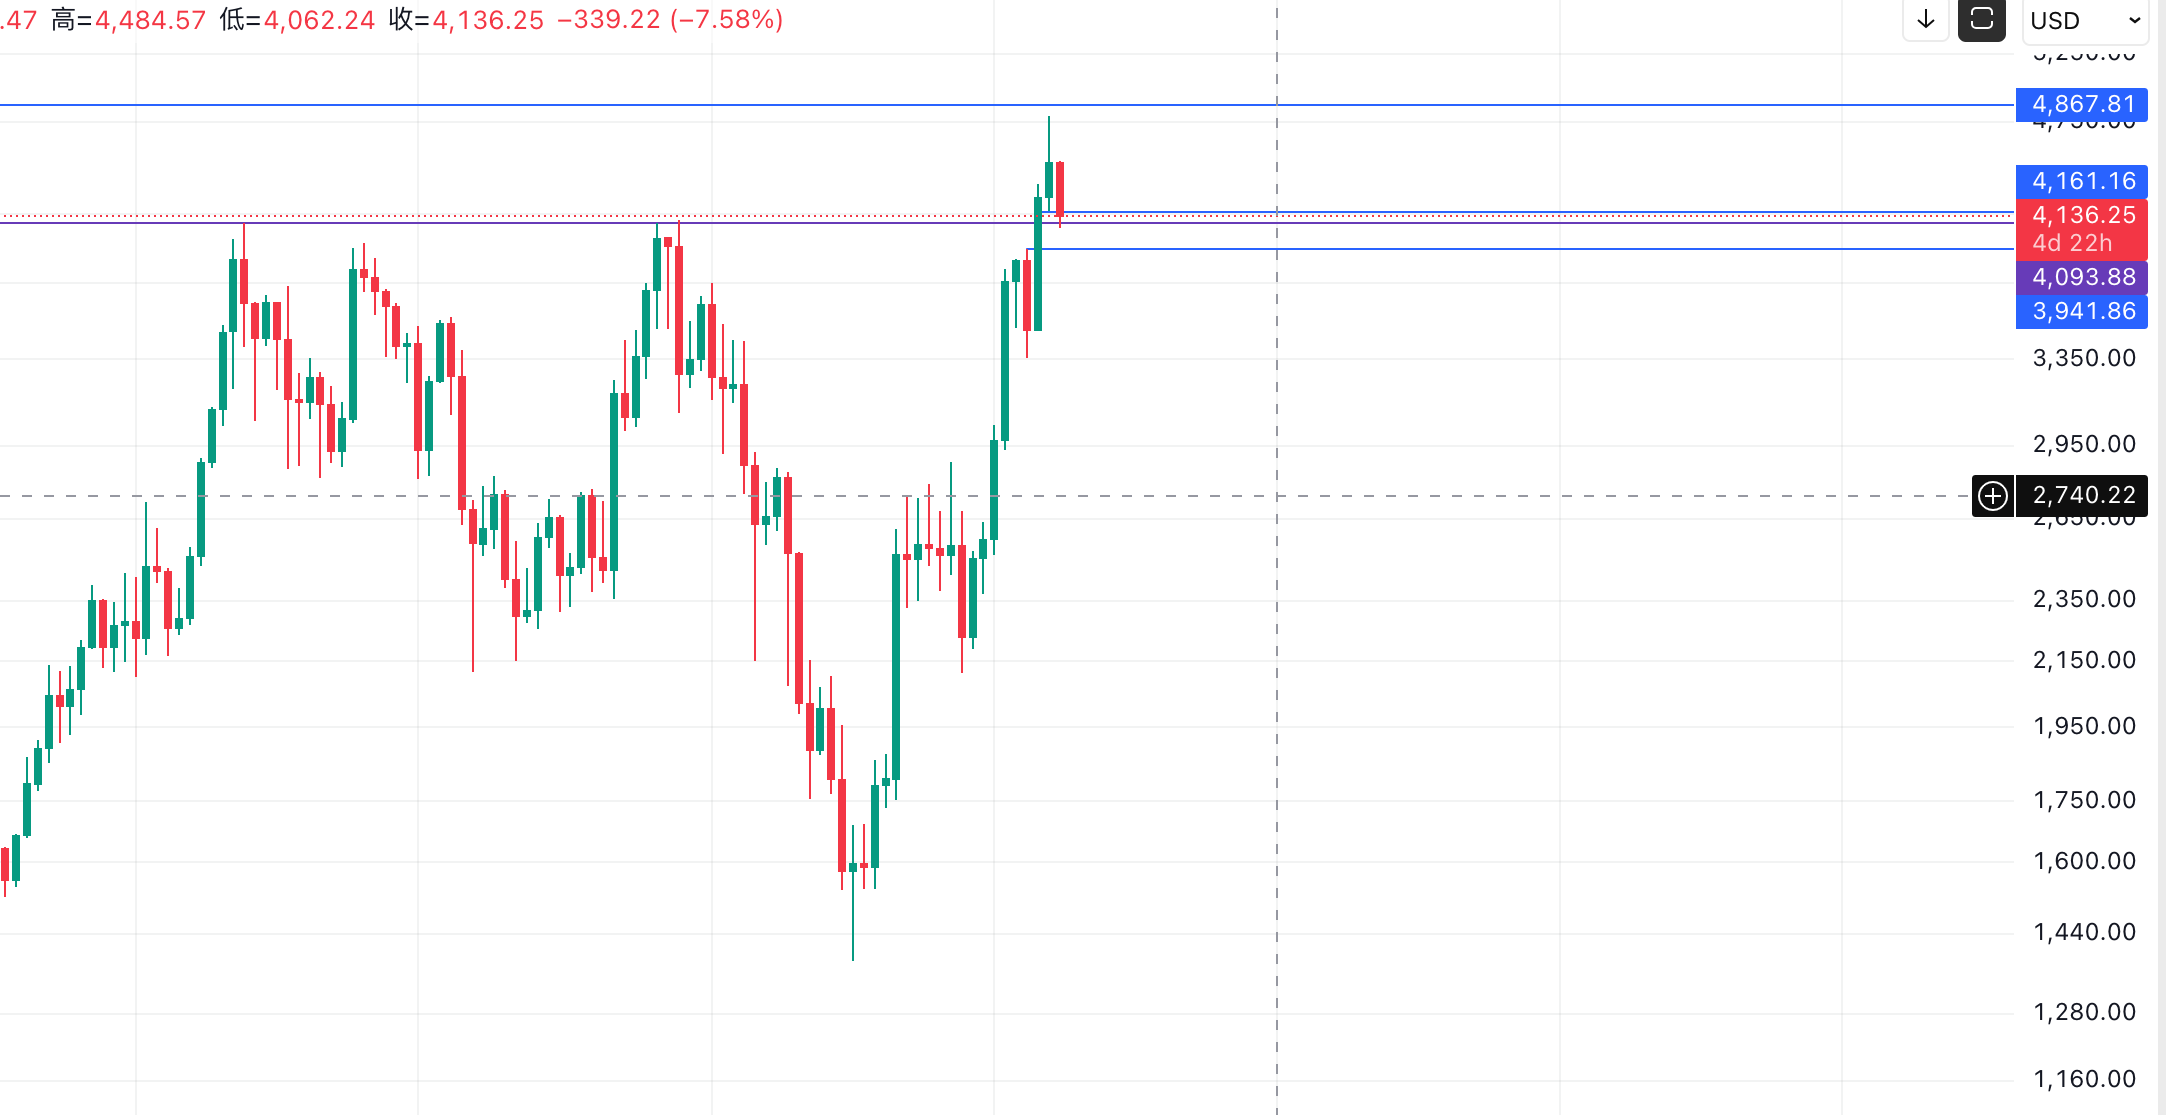
Looking at the daily candlestick chart, ETH has broken below the small support area of 4,160, and the current price has not yet recovered. However, the price has not fallen back into the July consolidation area. When ETH previously broke through 3,940 and 4,090, there was a significant increase in trading volume, so a new support area should form between these two prices, at least with repeated testing. I personally think it would be difficult to break through all at once.
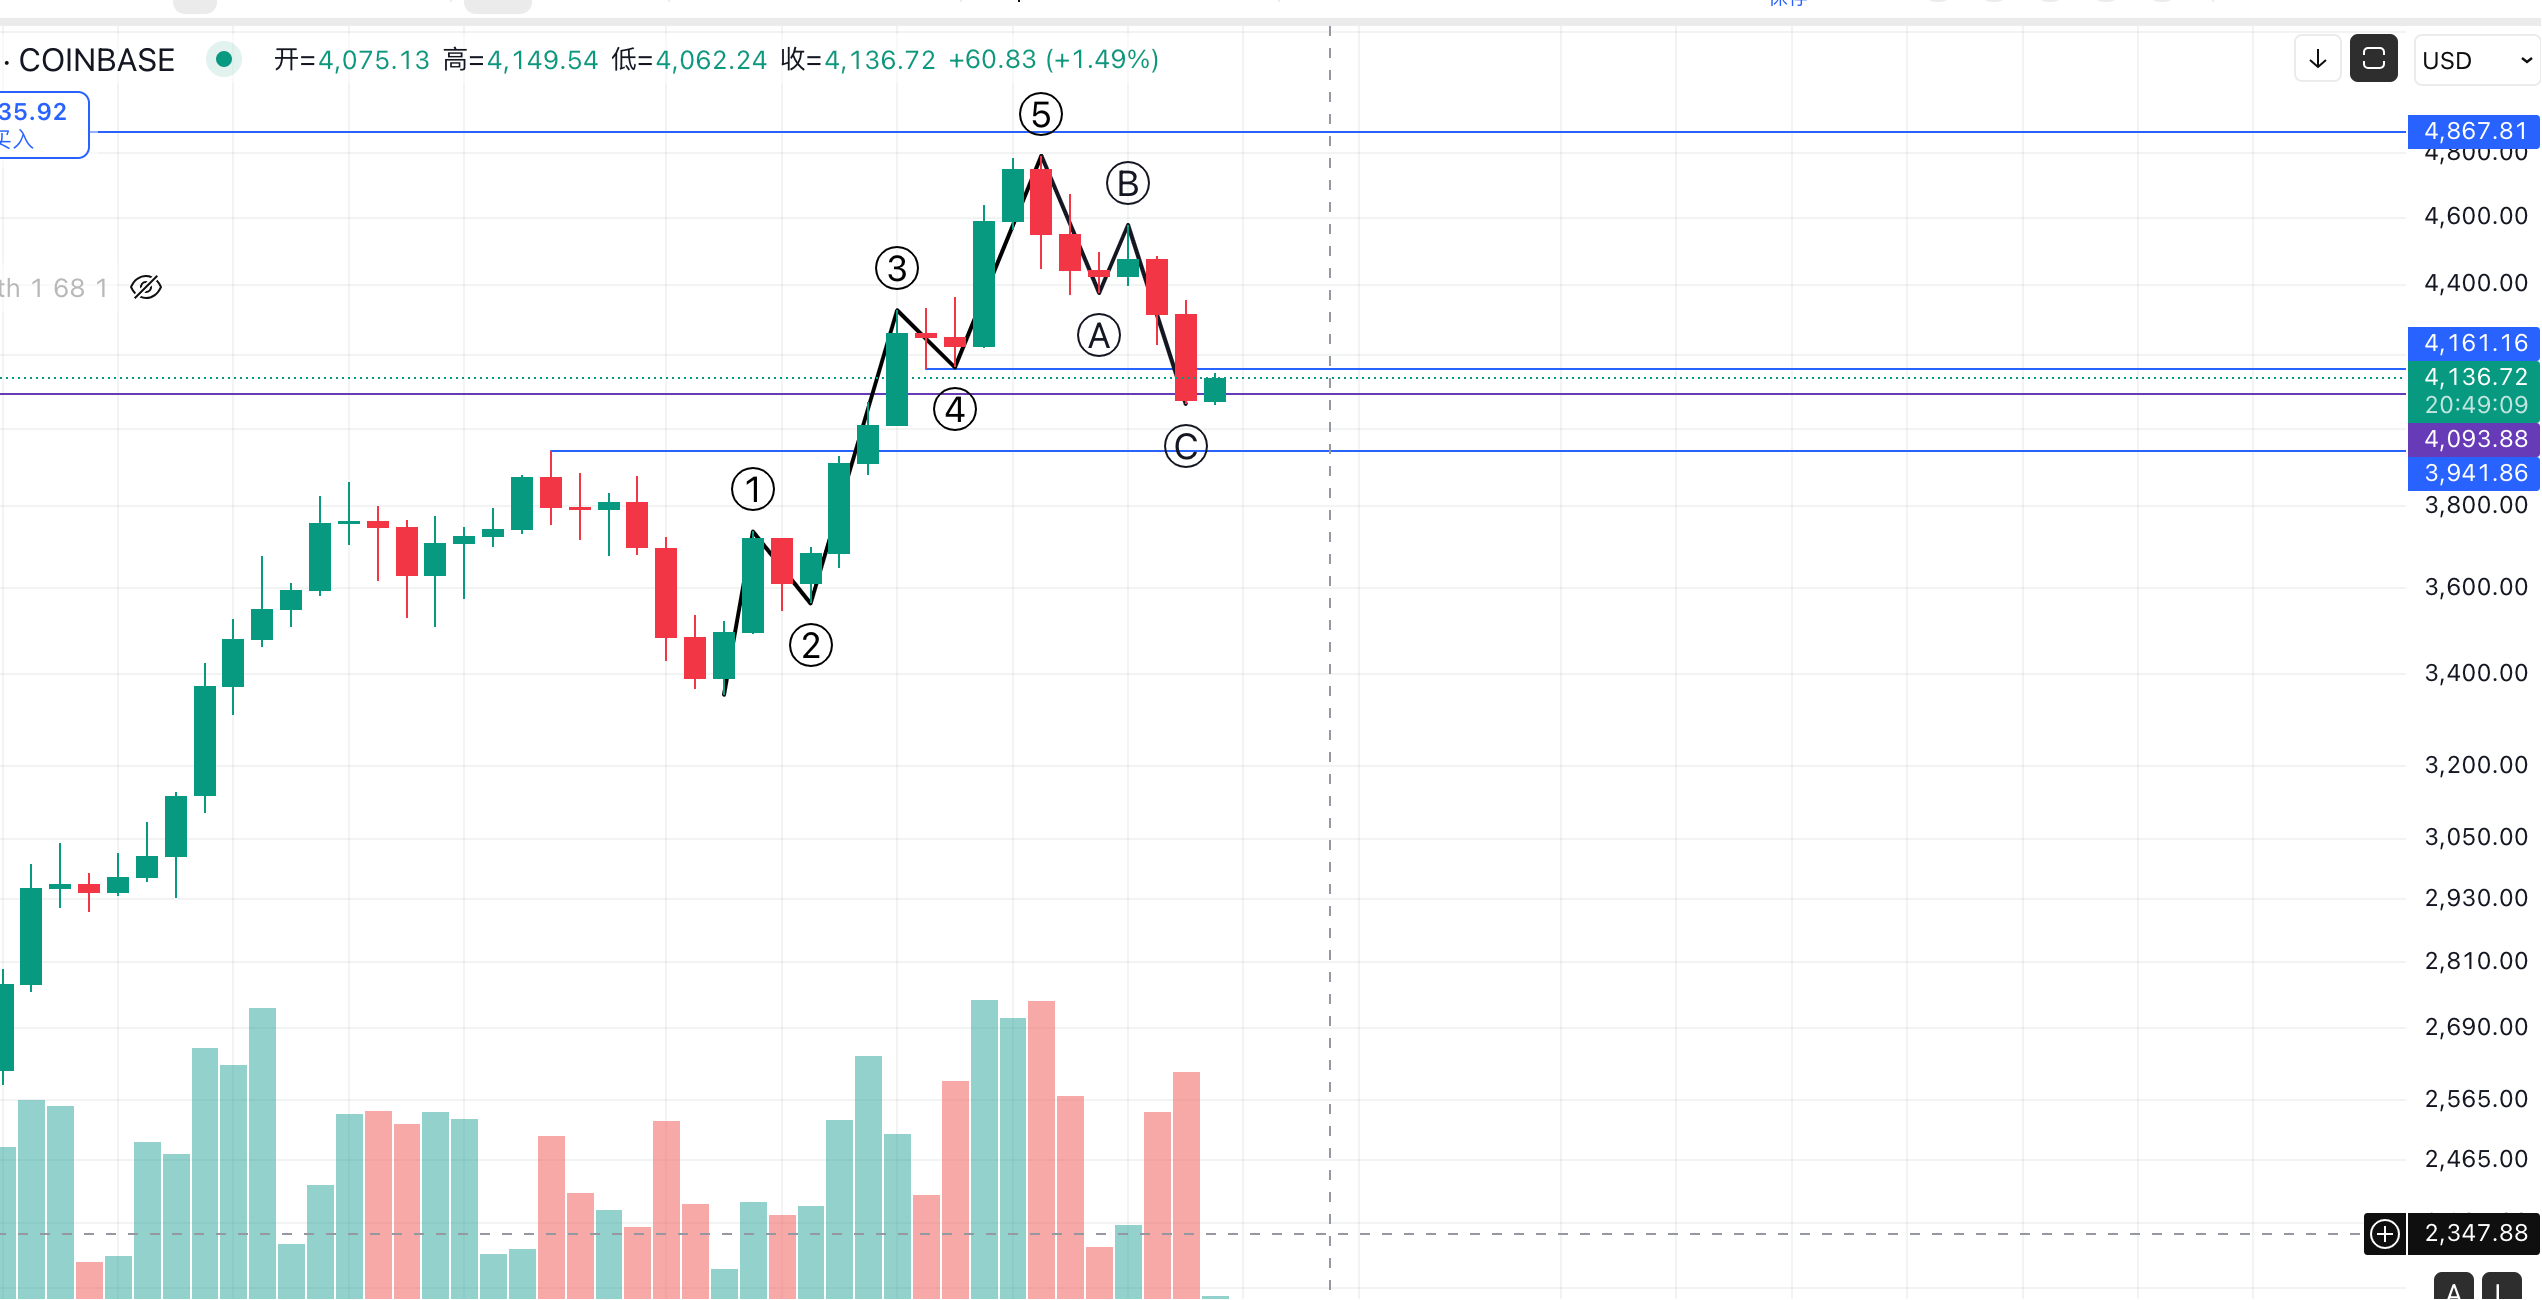
Since the rise in August, ETH has formed a standard 5-wave upward structure, followed by a corresponding 3-wave pullback, and is currently in the c-wave of the 3-wave decline, with an overall drop of more than 15%. In the next couple of days, pay attention to whether ETH can stabilize around 4,090. Additionally, watch if BTC will break below 112,000; if it does, it is highly likely to pull ETH down with it again.
Follow me to maximize trend profits with minimal operations.
免责声明:本文章仅代表作者个人观点,不代表本平台的立场和观点。本文章仅供信息分享,不构成对任何人的任何投资建议。用户与作者之间的任何争议,与本平台无关。如网页中刊载的文章或图片涉及侵权,请提供相关的权利证明和身份证明发送邮件到support@aicoin.com,本平台相关工作人员将会进行核查。


