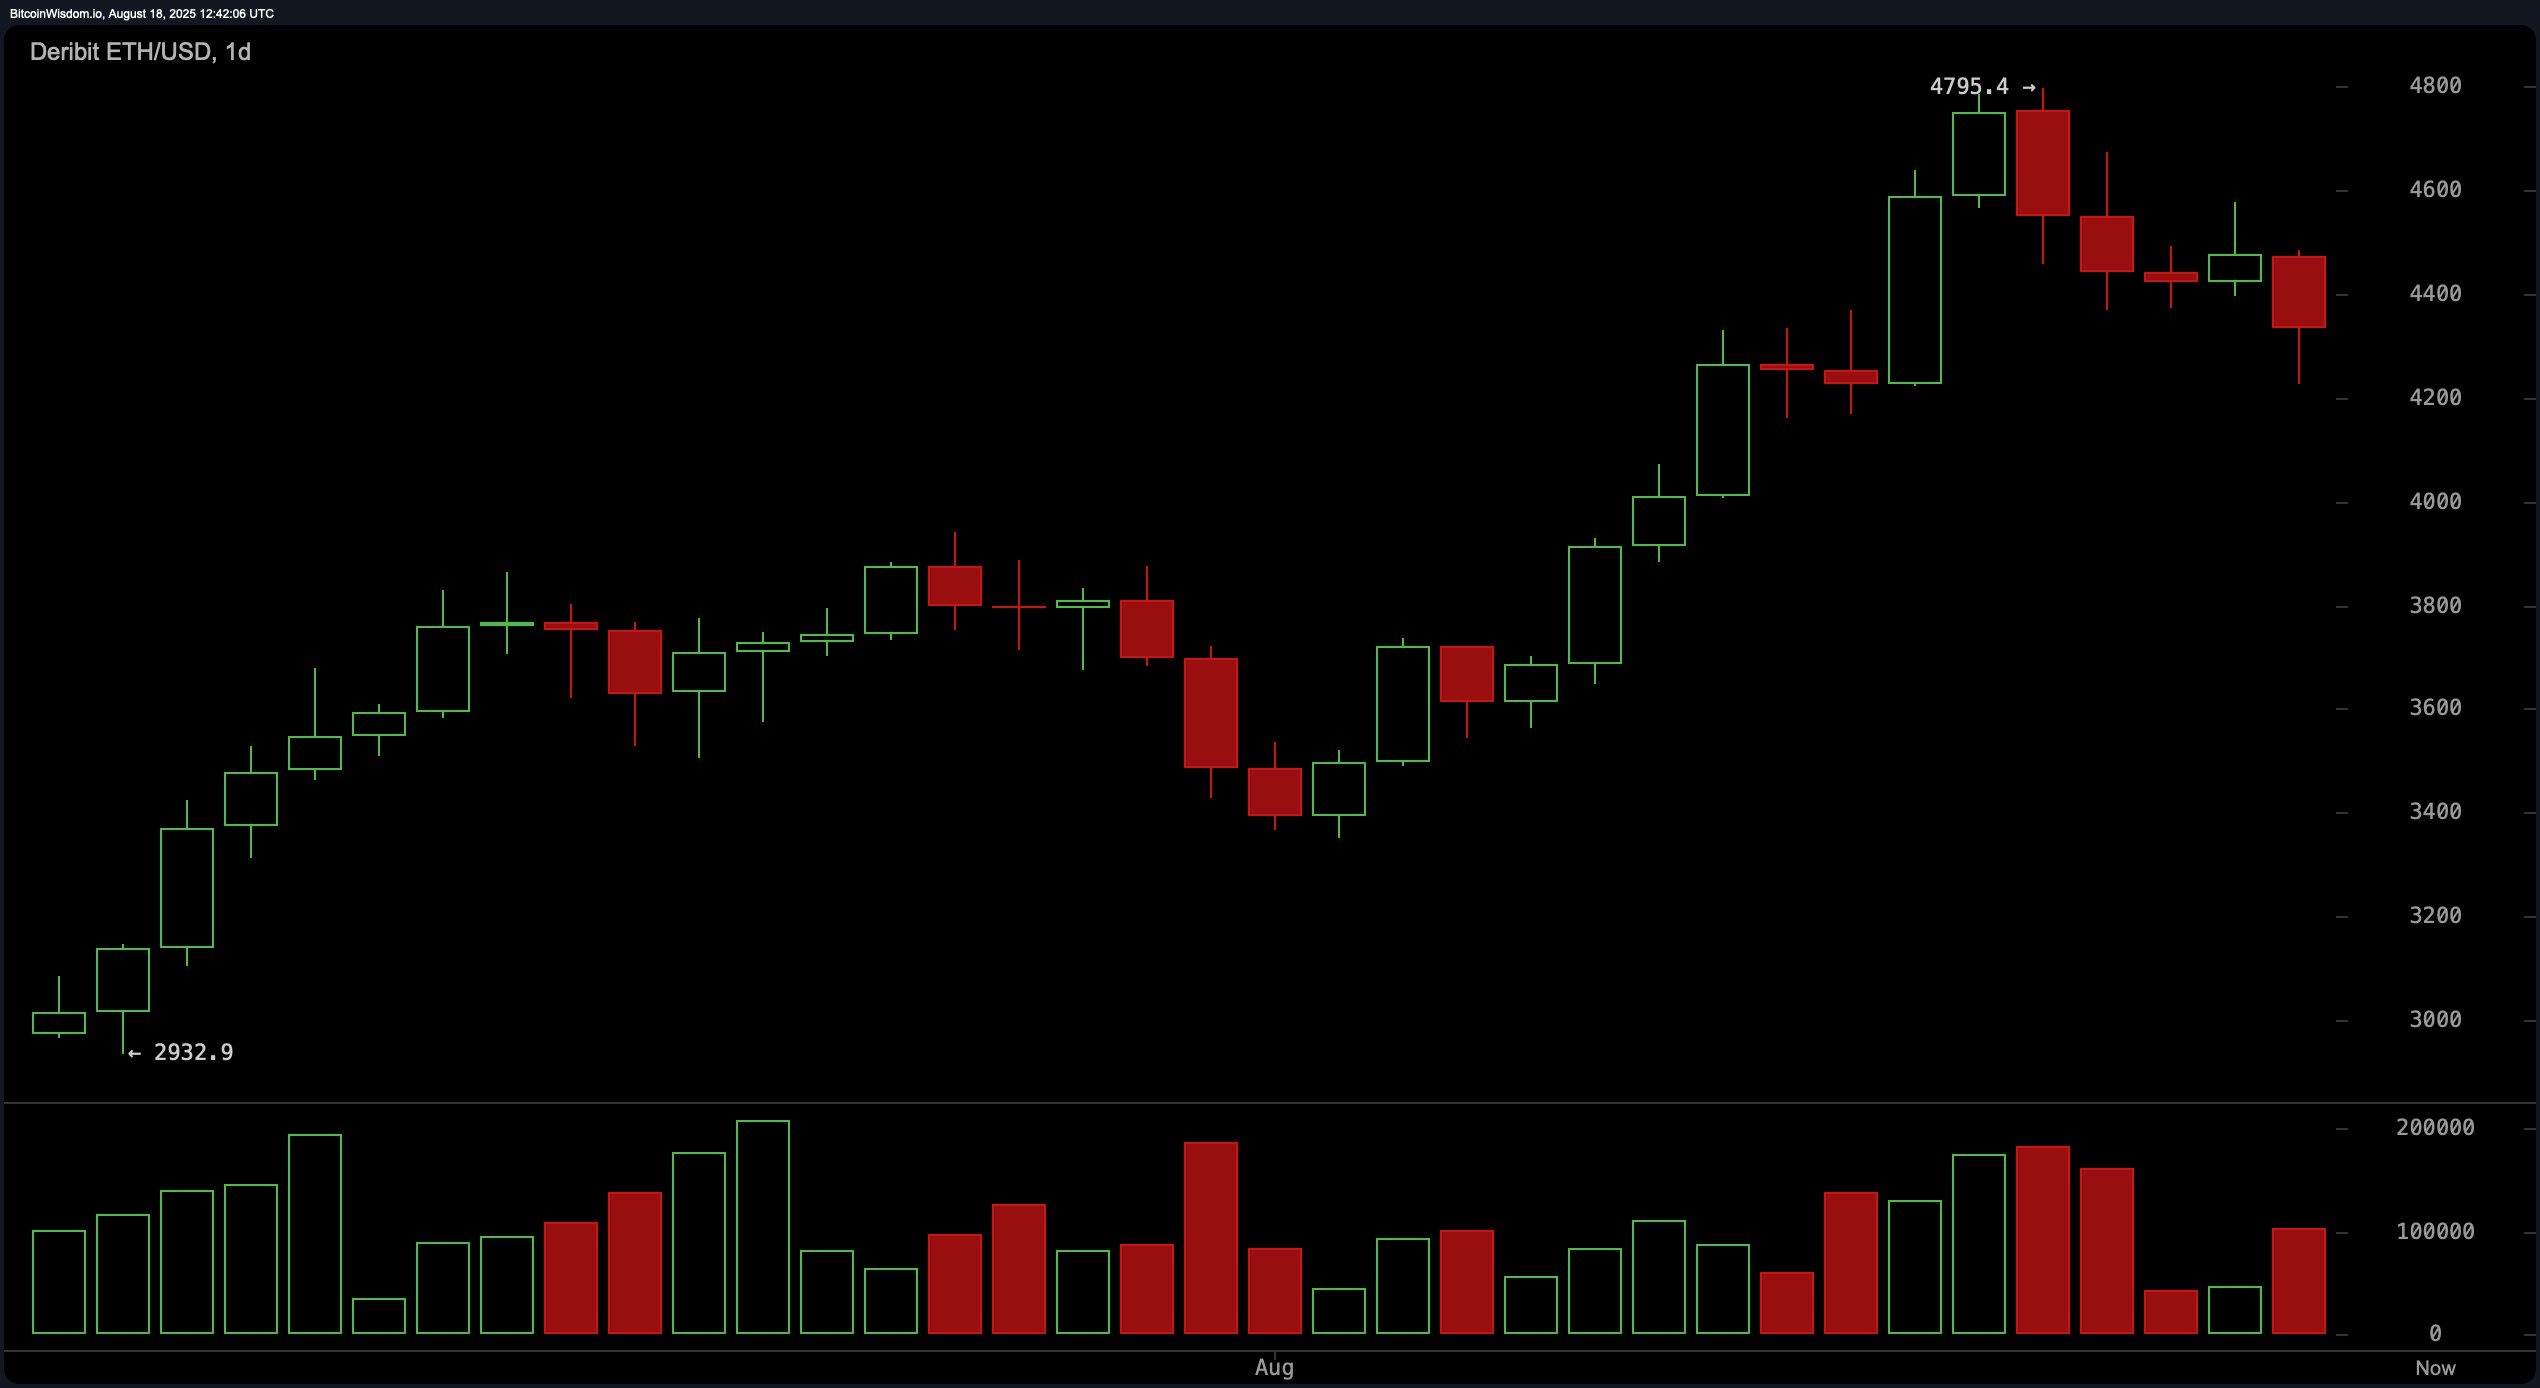
On the daily chart, ethereum remains within a long-term uptrend, but recent price action reveals a short-term bearish correction. After surging from approximately $2,932 to a peak near $4,795, the price has since retreated, forming lower highs and closing below previous levels. Increased selling volume on recent candles reinforces the view that a correction is underway. Ethereum is currently testing the $4,200–$4,300 support zone, with immediate resistance overhead in the $4,600–$4,795 range. This zone will be pivotal for determining whether the longer-term uptrend can resume.

ETH/USD 1-day chart via Deribit on Aug. 18, 2025.
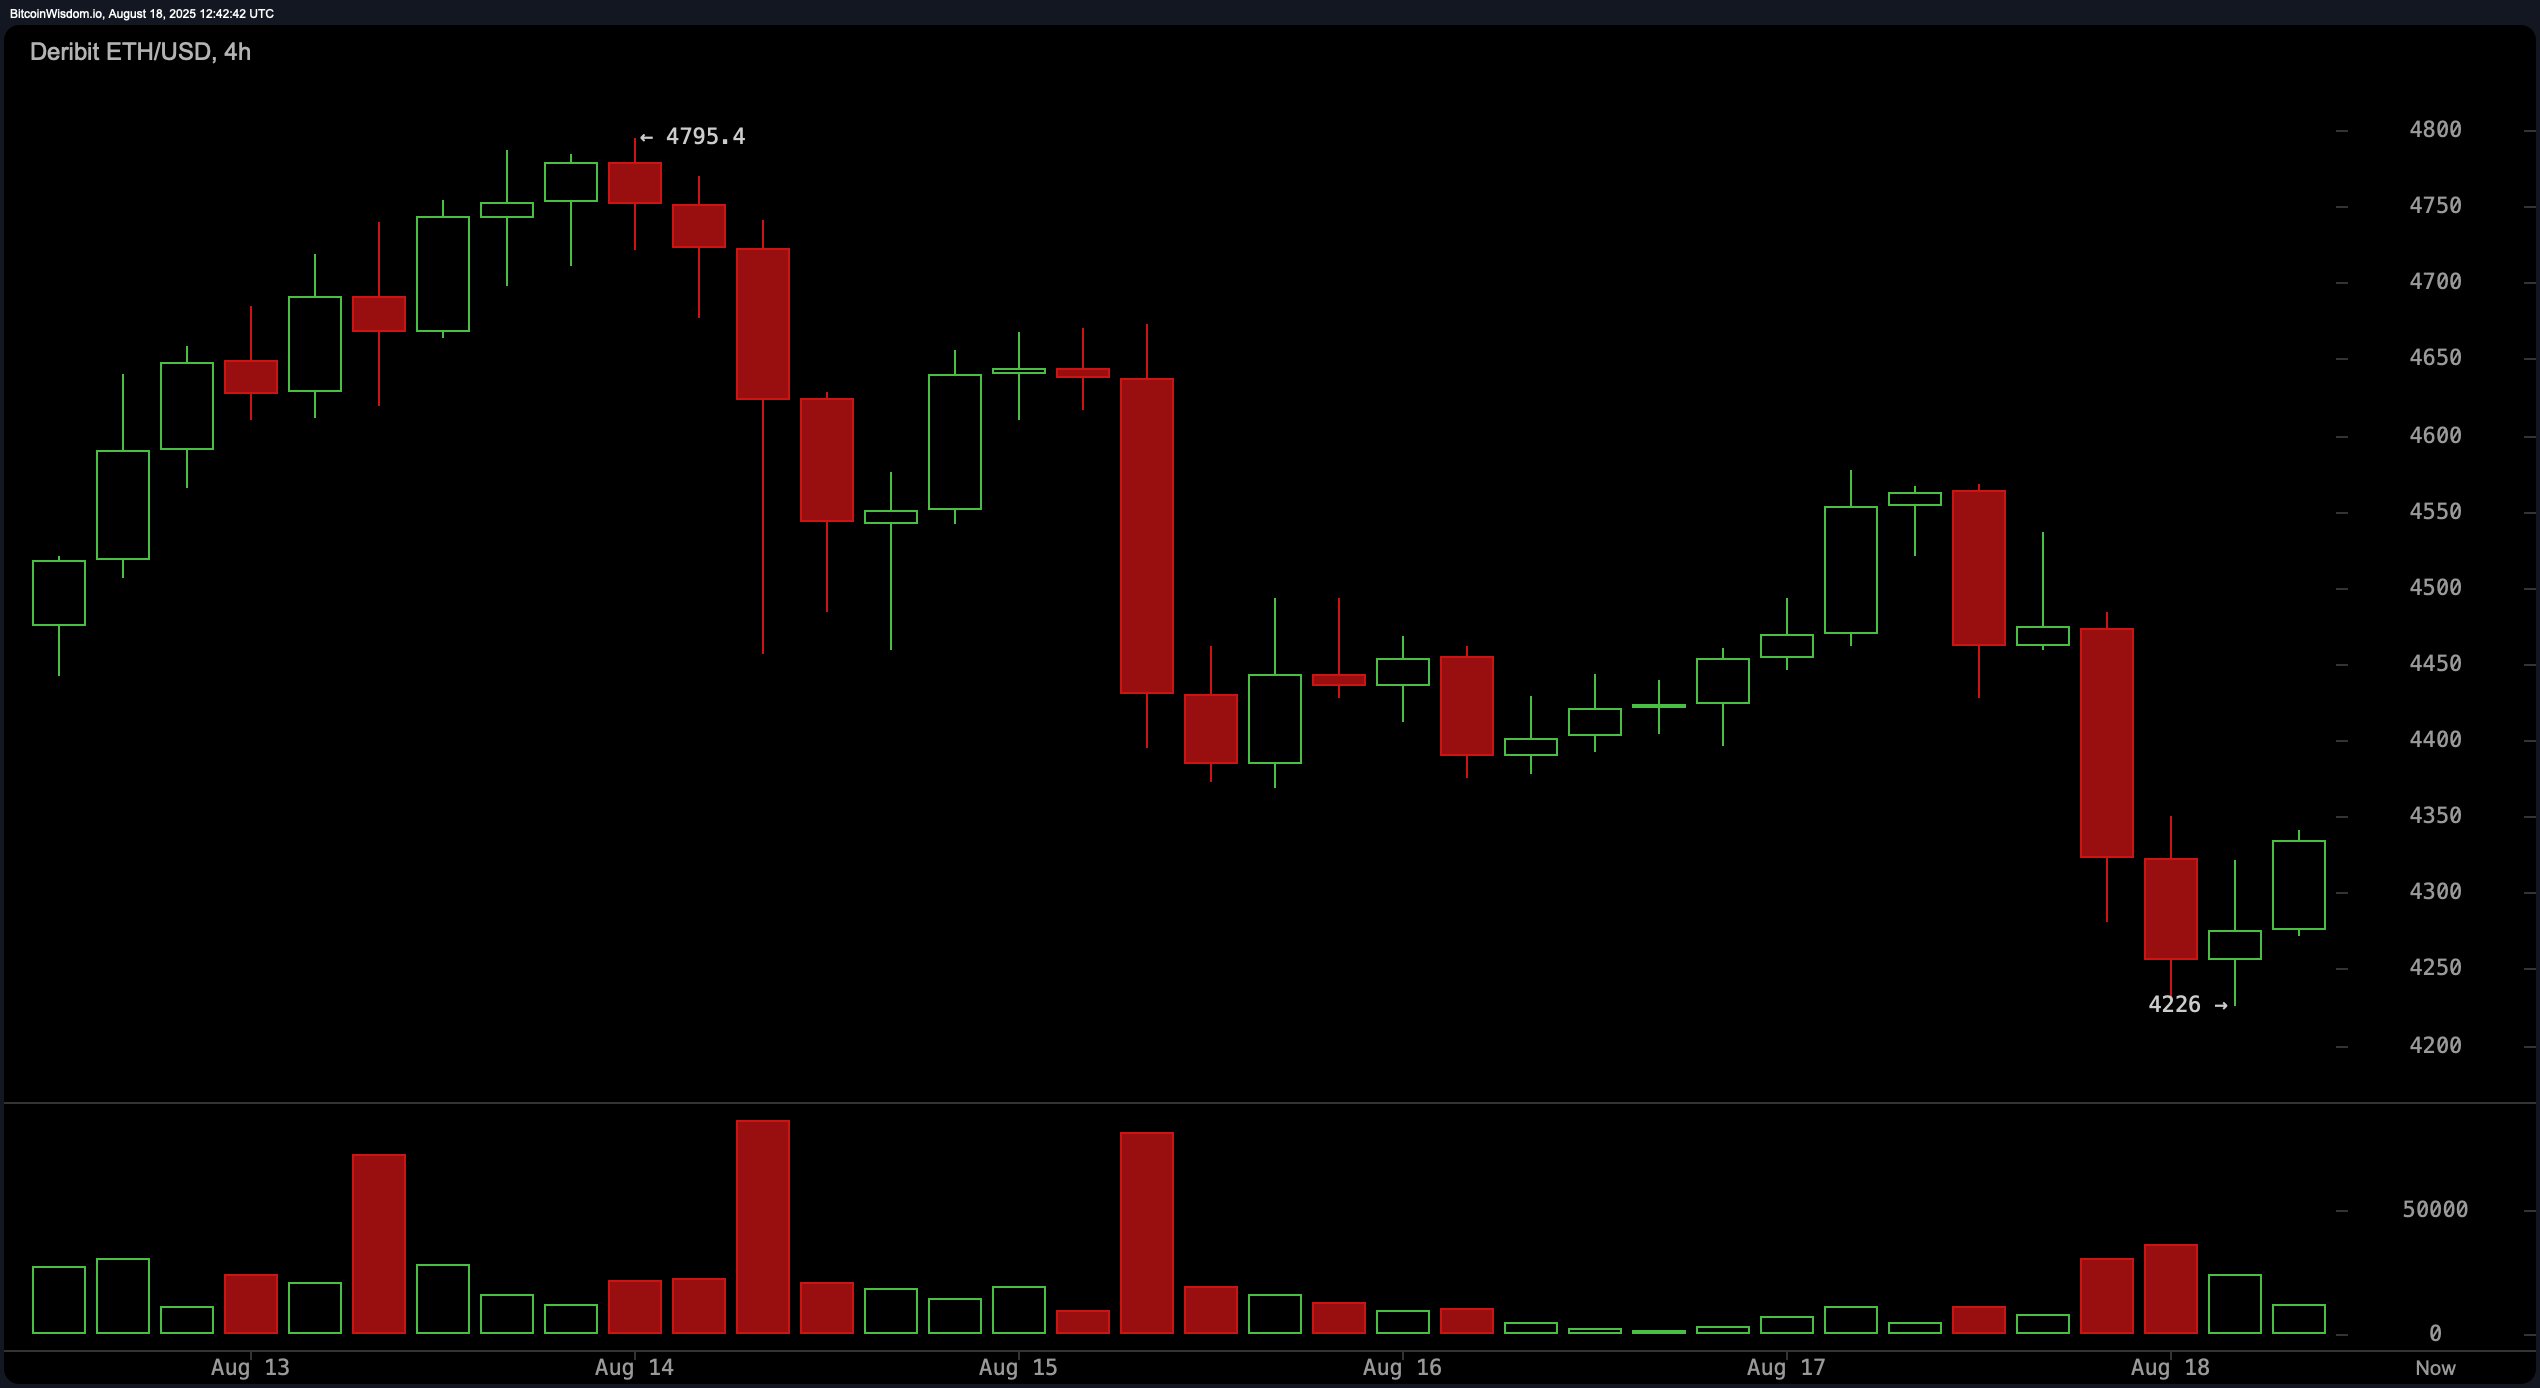
From the 4-hour perspective, ethereum presents a more tactical setup with a visible double top around $4,795, followed by a sharp breakdown on August 15 accompanied by high volume. This confirms a distribution phase. The price has since stabilized near $4,226 after a wick-based bounce and is now forming minor rebound candles, hinting at a potential relief rally. However, any bullish momentum is likely to face resistance near $4,400–$4,450. Failure to reclaim this zone may reintroduce selling pressure.

ETH/USD 4-hour chart via Deribit on Aug. 18, 2025.
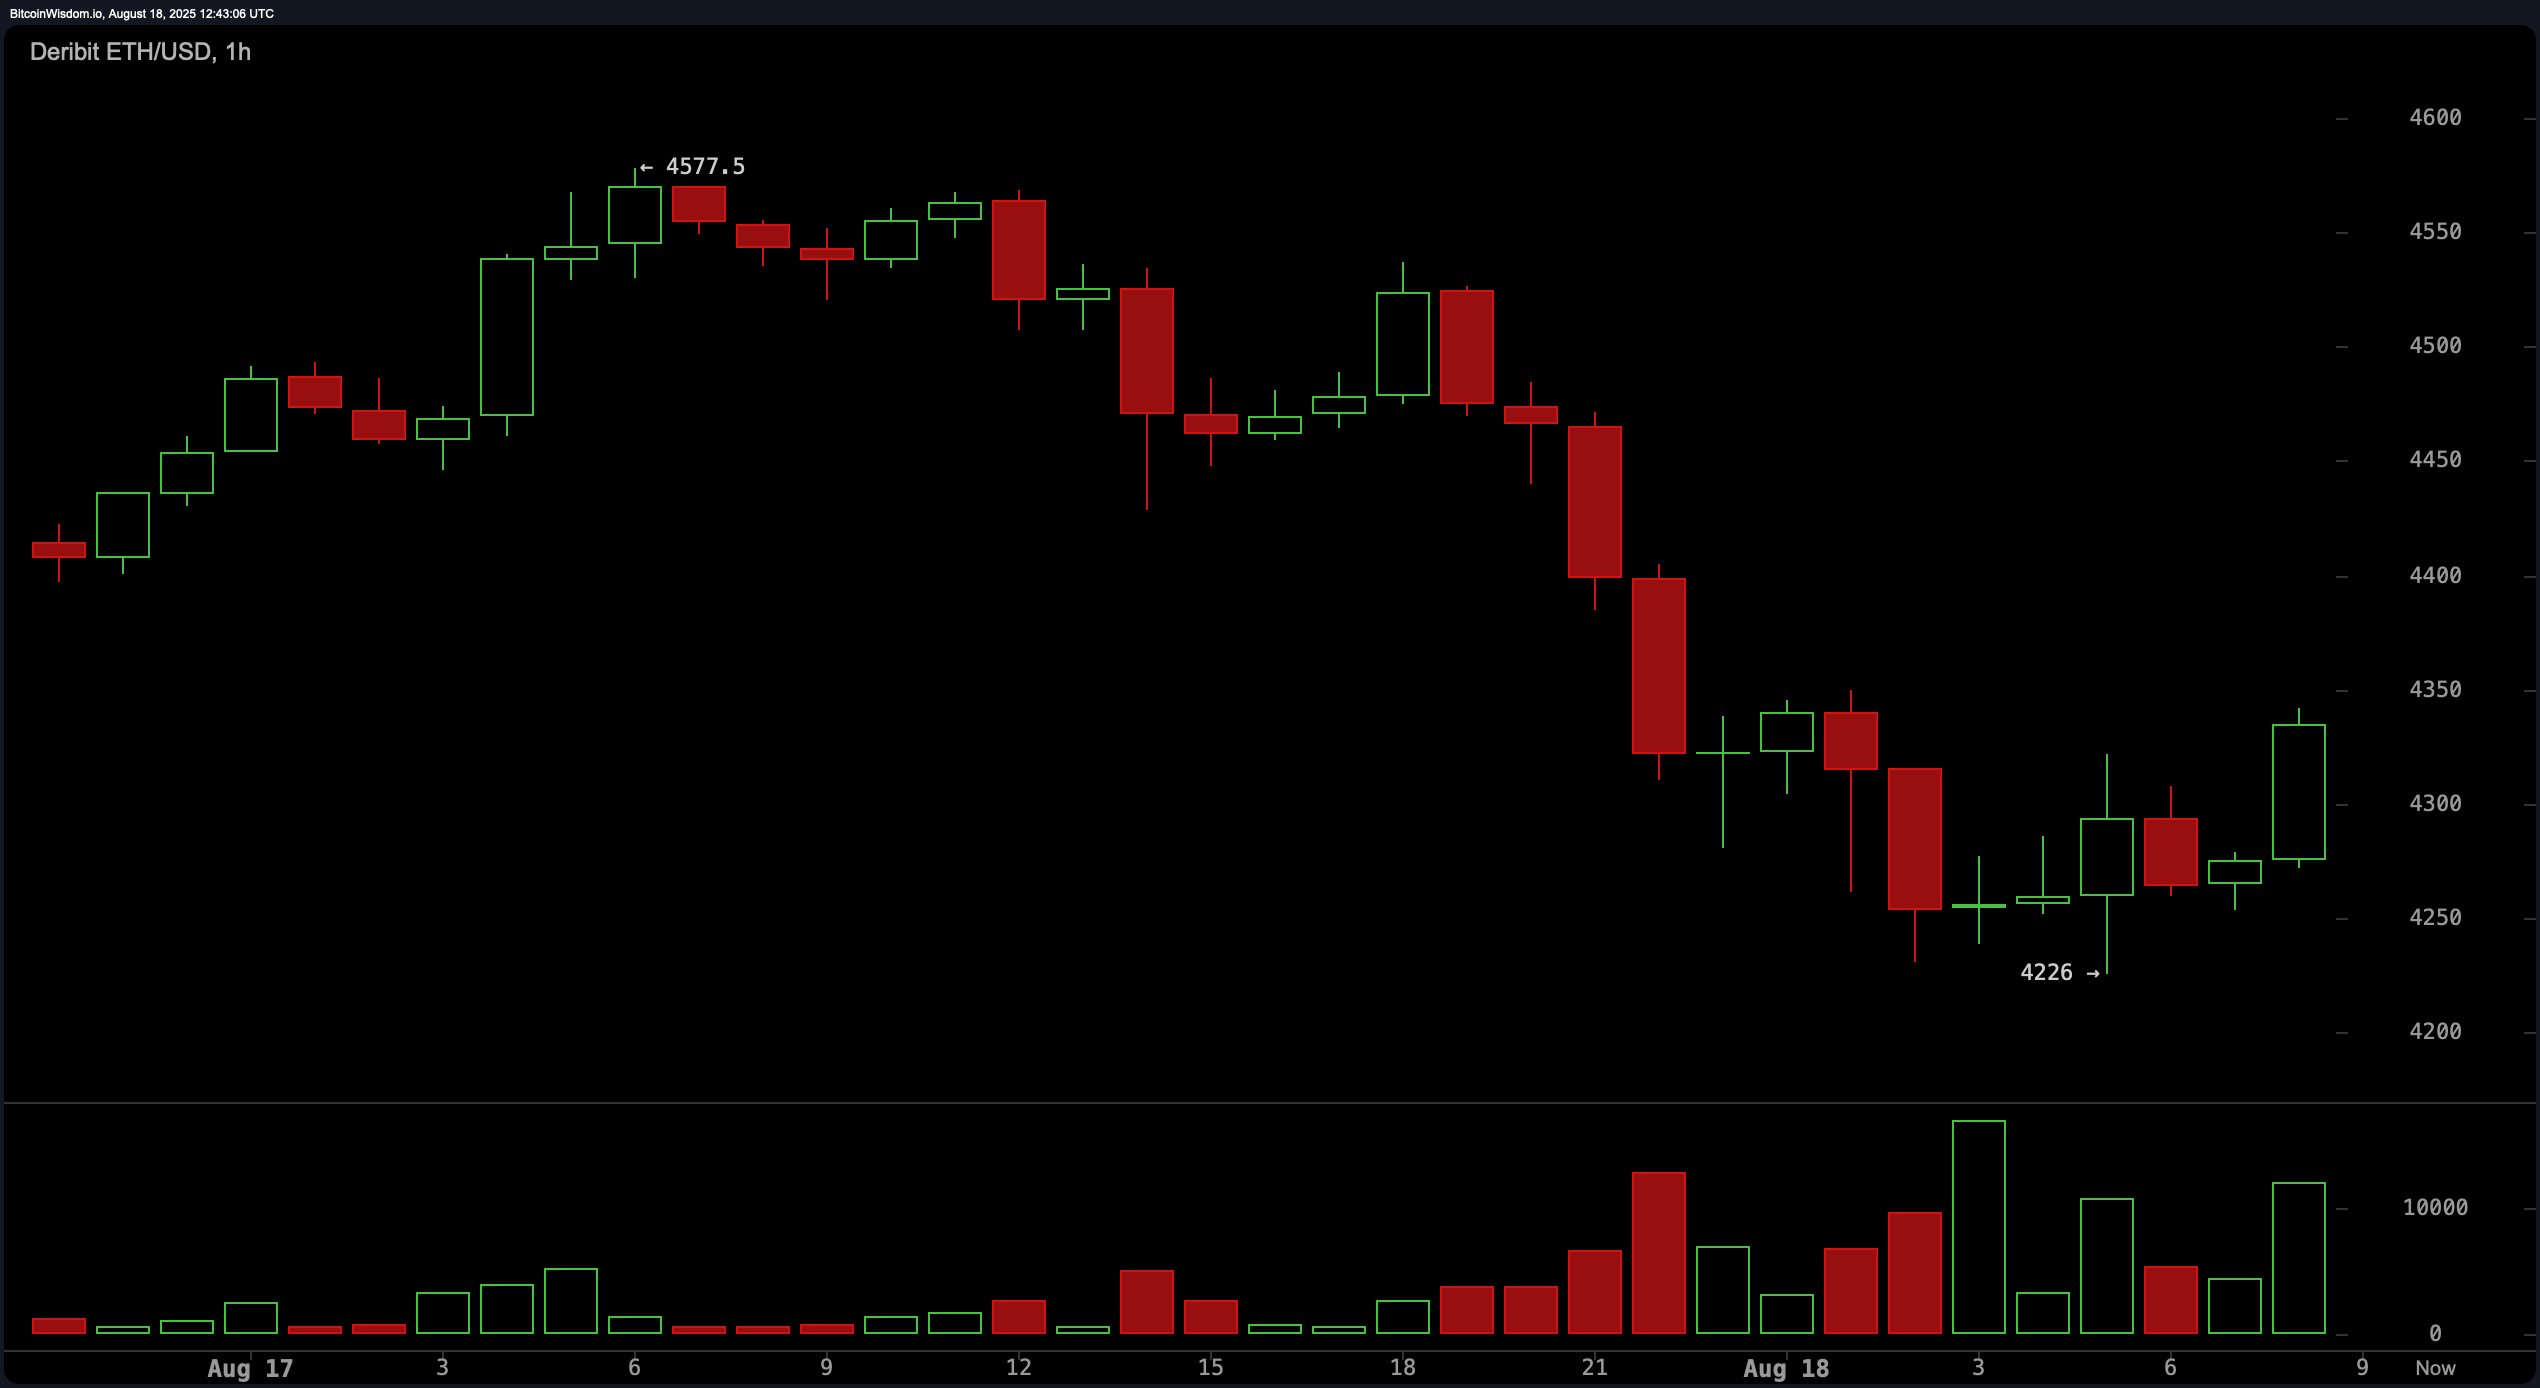
On the 1-hour ether chart, the short-term trend remains bearish, though signs of a potential reversal are emerging. A consolidation range has developed around $4,250–$4,300, supported by a volume spike during the latest leg down and partial recovery. A recent breakout candle above $4,300 with sufficient volume is a key signal. Should ethereum manage a decisive close above $4,350, it would open a window for intraday long opportunities targeting $4,450–$4,550, while maintaining a stop-loss below $4,220.

ETH/USD 1-hour chart via Deribit on Aug. 18, 2025.
Technical indicators offer a neutral-to-cautious outlook. Among oscillators, the relative strength index (RSI) is at 59.4, stochastic at 70.1, and commodity channel index (CCI) at 51.1—all in neutral territory. The average directional index (ADX) at 46.1 also suggests trend strength without a clear directional bias. However, momentum (282.7) and the moving average convergence divergence (MACD) level at 275.9 both indicate sell signals, adding a degree of skepticism to any bullish thesis in the near term.
Moving averages present a divided picture. The 10-period exponential moving average (EMA) and simple moving average (SMA) are both above current price levels and flashing sell signals. In contrast, the 20, 30, 50, 100, and 200-period EMAs and SMAs remain below market price and indicate buying strength. This divergence suggests that while short-term momentum is under pressure, the broader trend remains structurally bullish—supporting the view that ethereum may be in a healthy consolidation phase before a potential continuation.
Bull Verdict:
If ethereum successfully holds above the $4,300 support level and closes above $4,350 with rising volume, it could confirm a short-term reversal and pave the way for a relief rally toward the $4,450–$4,550 range. The prevailing long-term trend remains intact, supported by broader bullish signals from mid- to long-term moving averages.
Bear Verdict:
Should ethereum fail to sustain above $4,350 or face rejection near $4,450, the current relief rally may be short-lived. A return below $4,220 would invalidate bullish momentum and likely accelerate the corrective phase, with downside targets revisiting the $4,200 and potentially $4,050 levels.
免责声明:本文章仅代表作者个人观点,不代表本平台的立场和观点。本文章仅供信息分享,不构成对任何人的任何投资建议。用户与作者之间的任何争议,与本平台无关。如网页中刊载的文章或图片涉及侵权,请提供相关的权利证明和身份证明发送邮件到support@aicoin.com,本平台相关工作人员将会进行核查。


