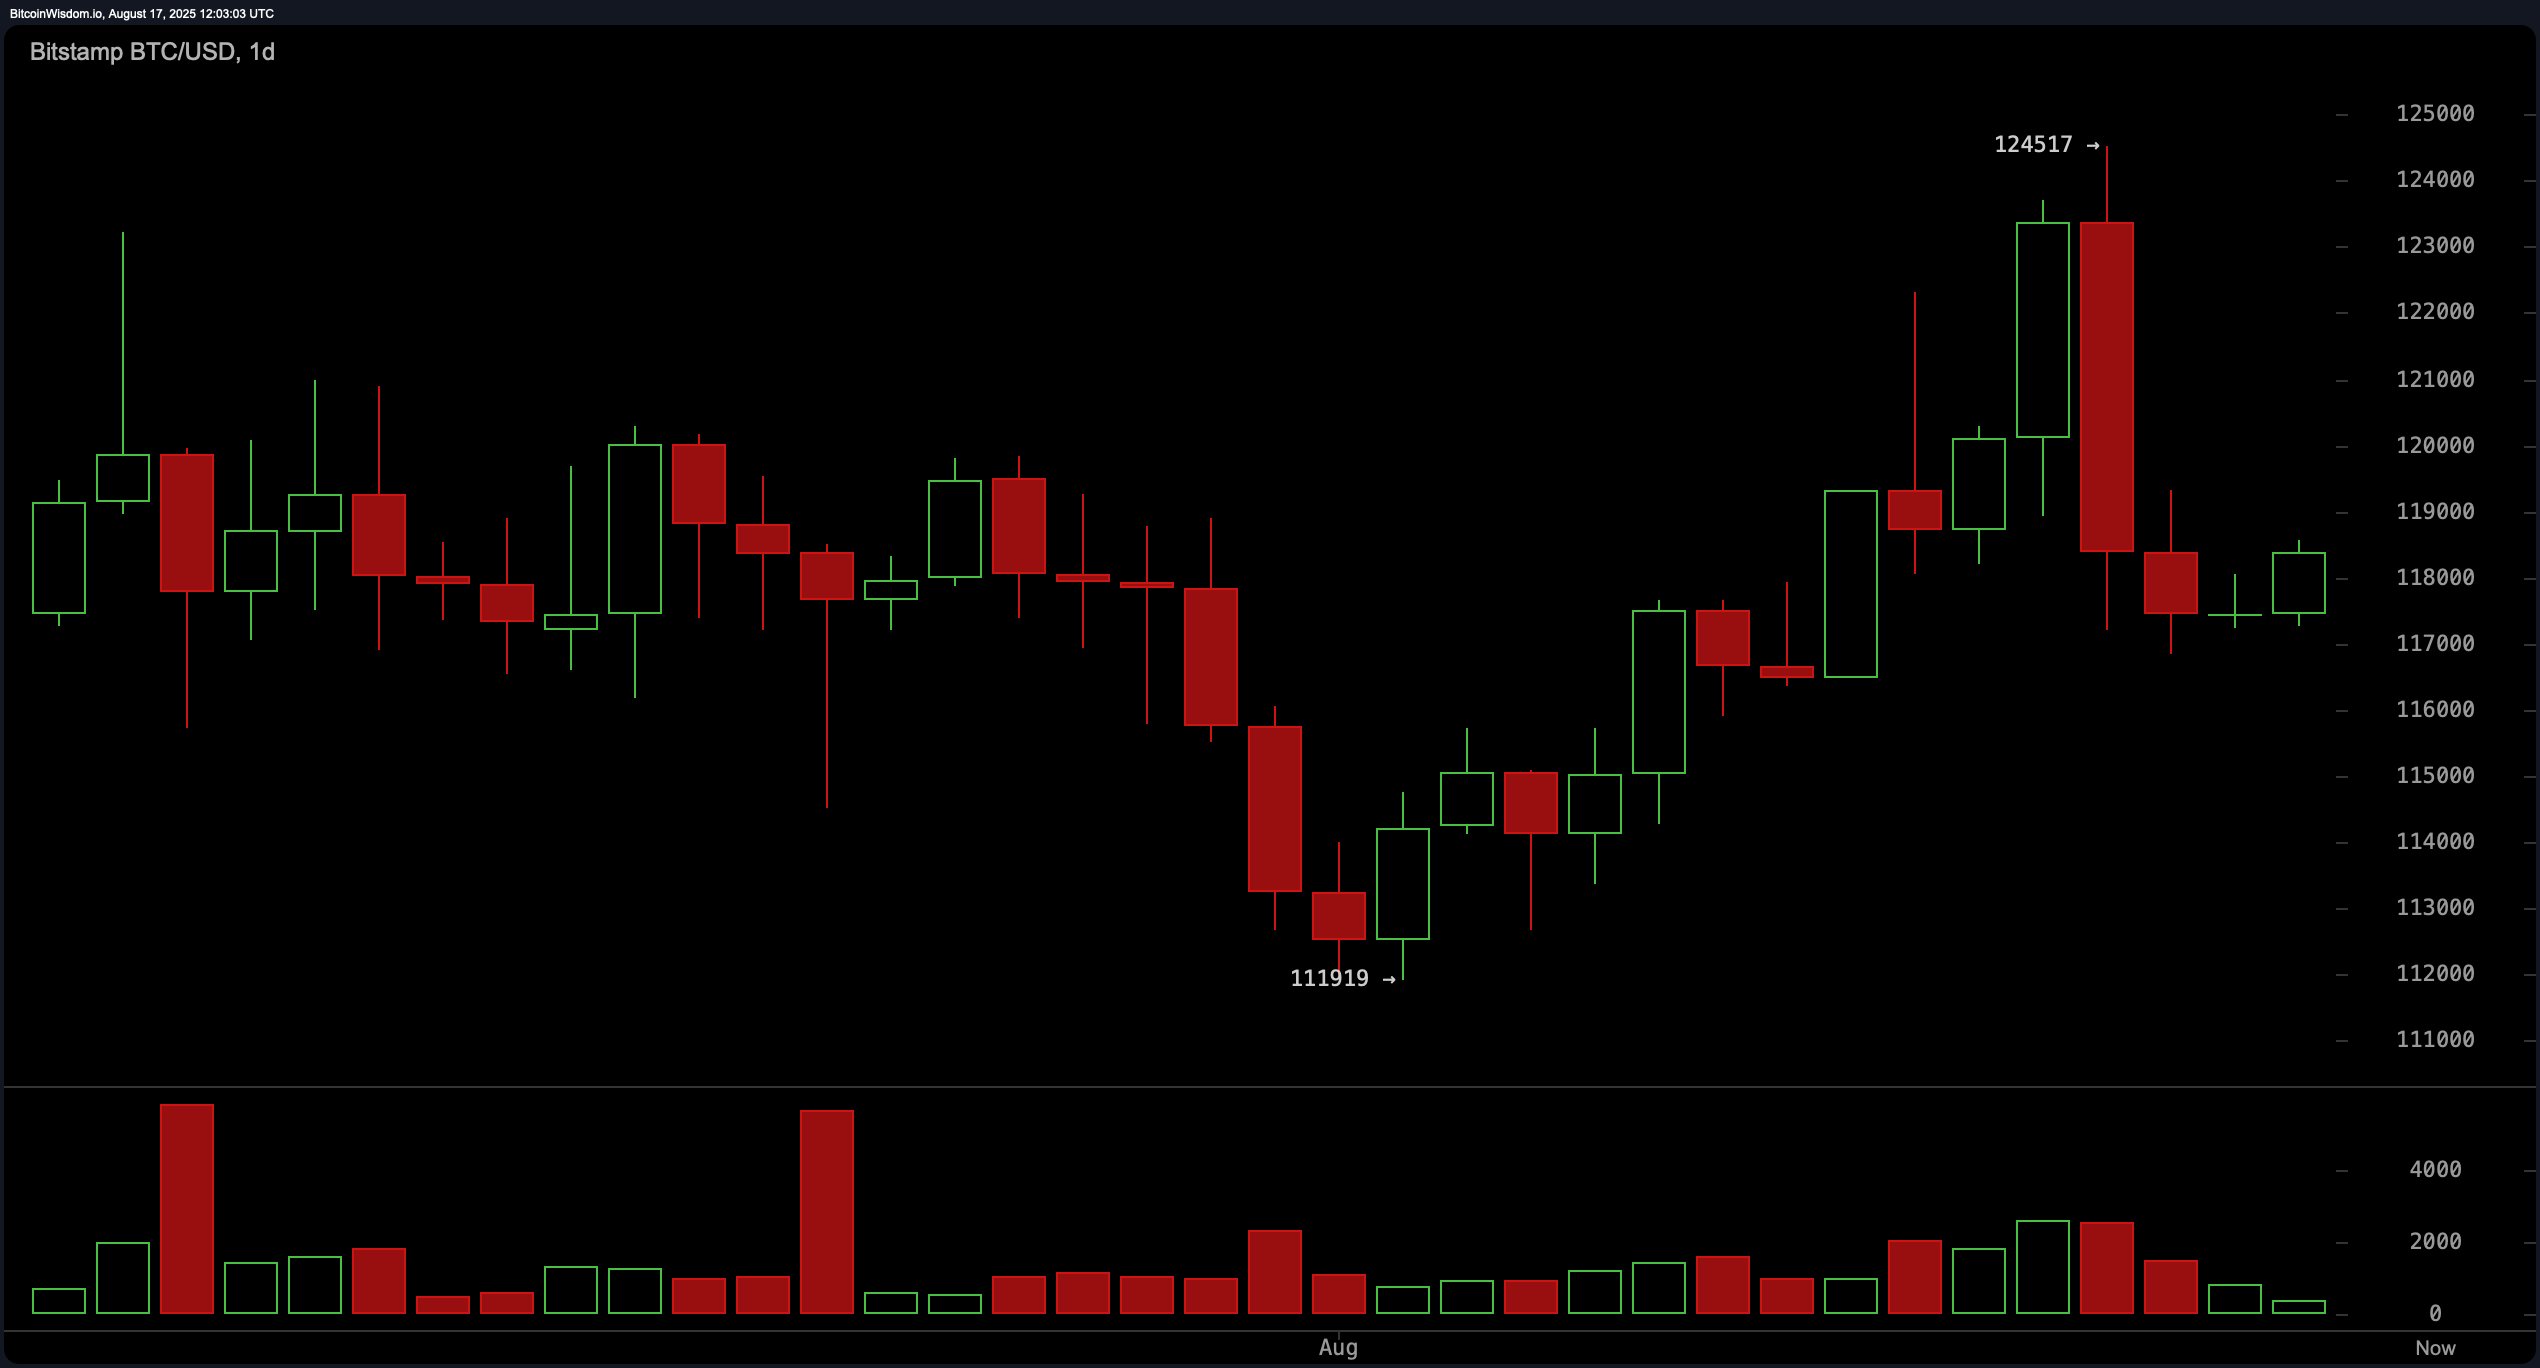
The daily bitcoin chart reflects a strong upward surge peaking at $124,517 before a sharp sell-off pulled the price toward consolidation levels near $118,000. Support between $117,000 and $118,000 is holding firm for now, though volume has tapered off, suggesting waning conviction among buyers. If the price breaks above $119,000 with higher volume, a recovery toward $121,000 to $122,500 is possible, while a breakdown below $116,500 could confirm a bearish reversal. This level remains critical to monitor, given the potential double-top structure forming at recent highs.

BTC/USD 1-day chart via Bitstamp on Aug. 17, 2025.
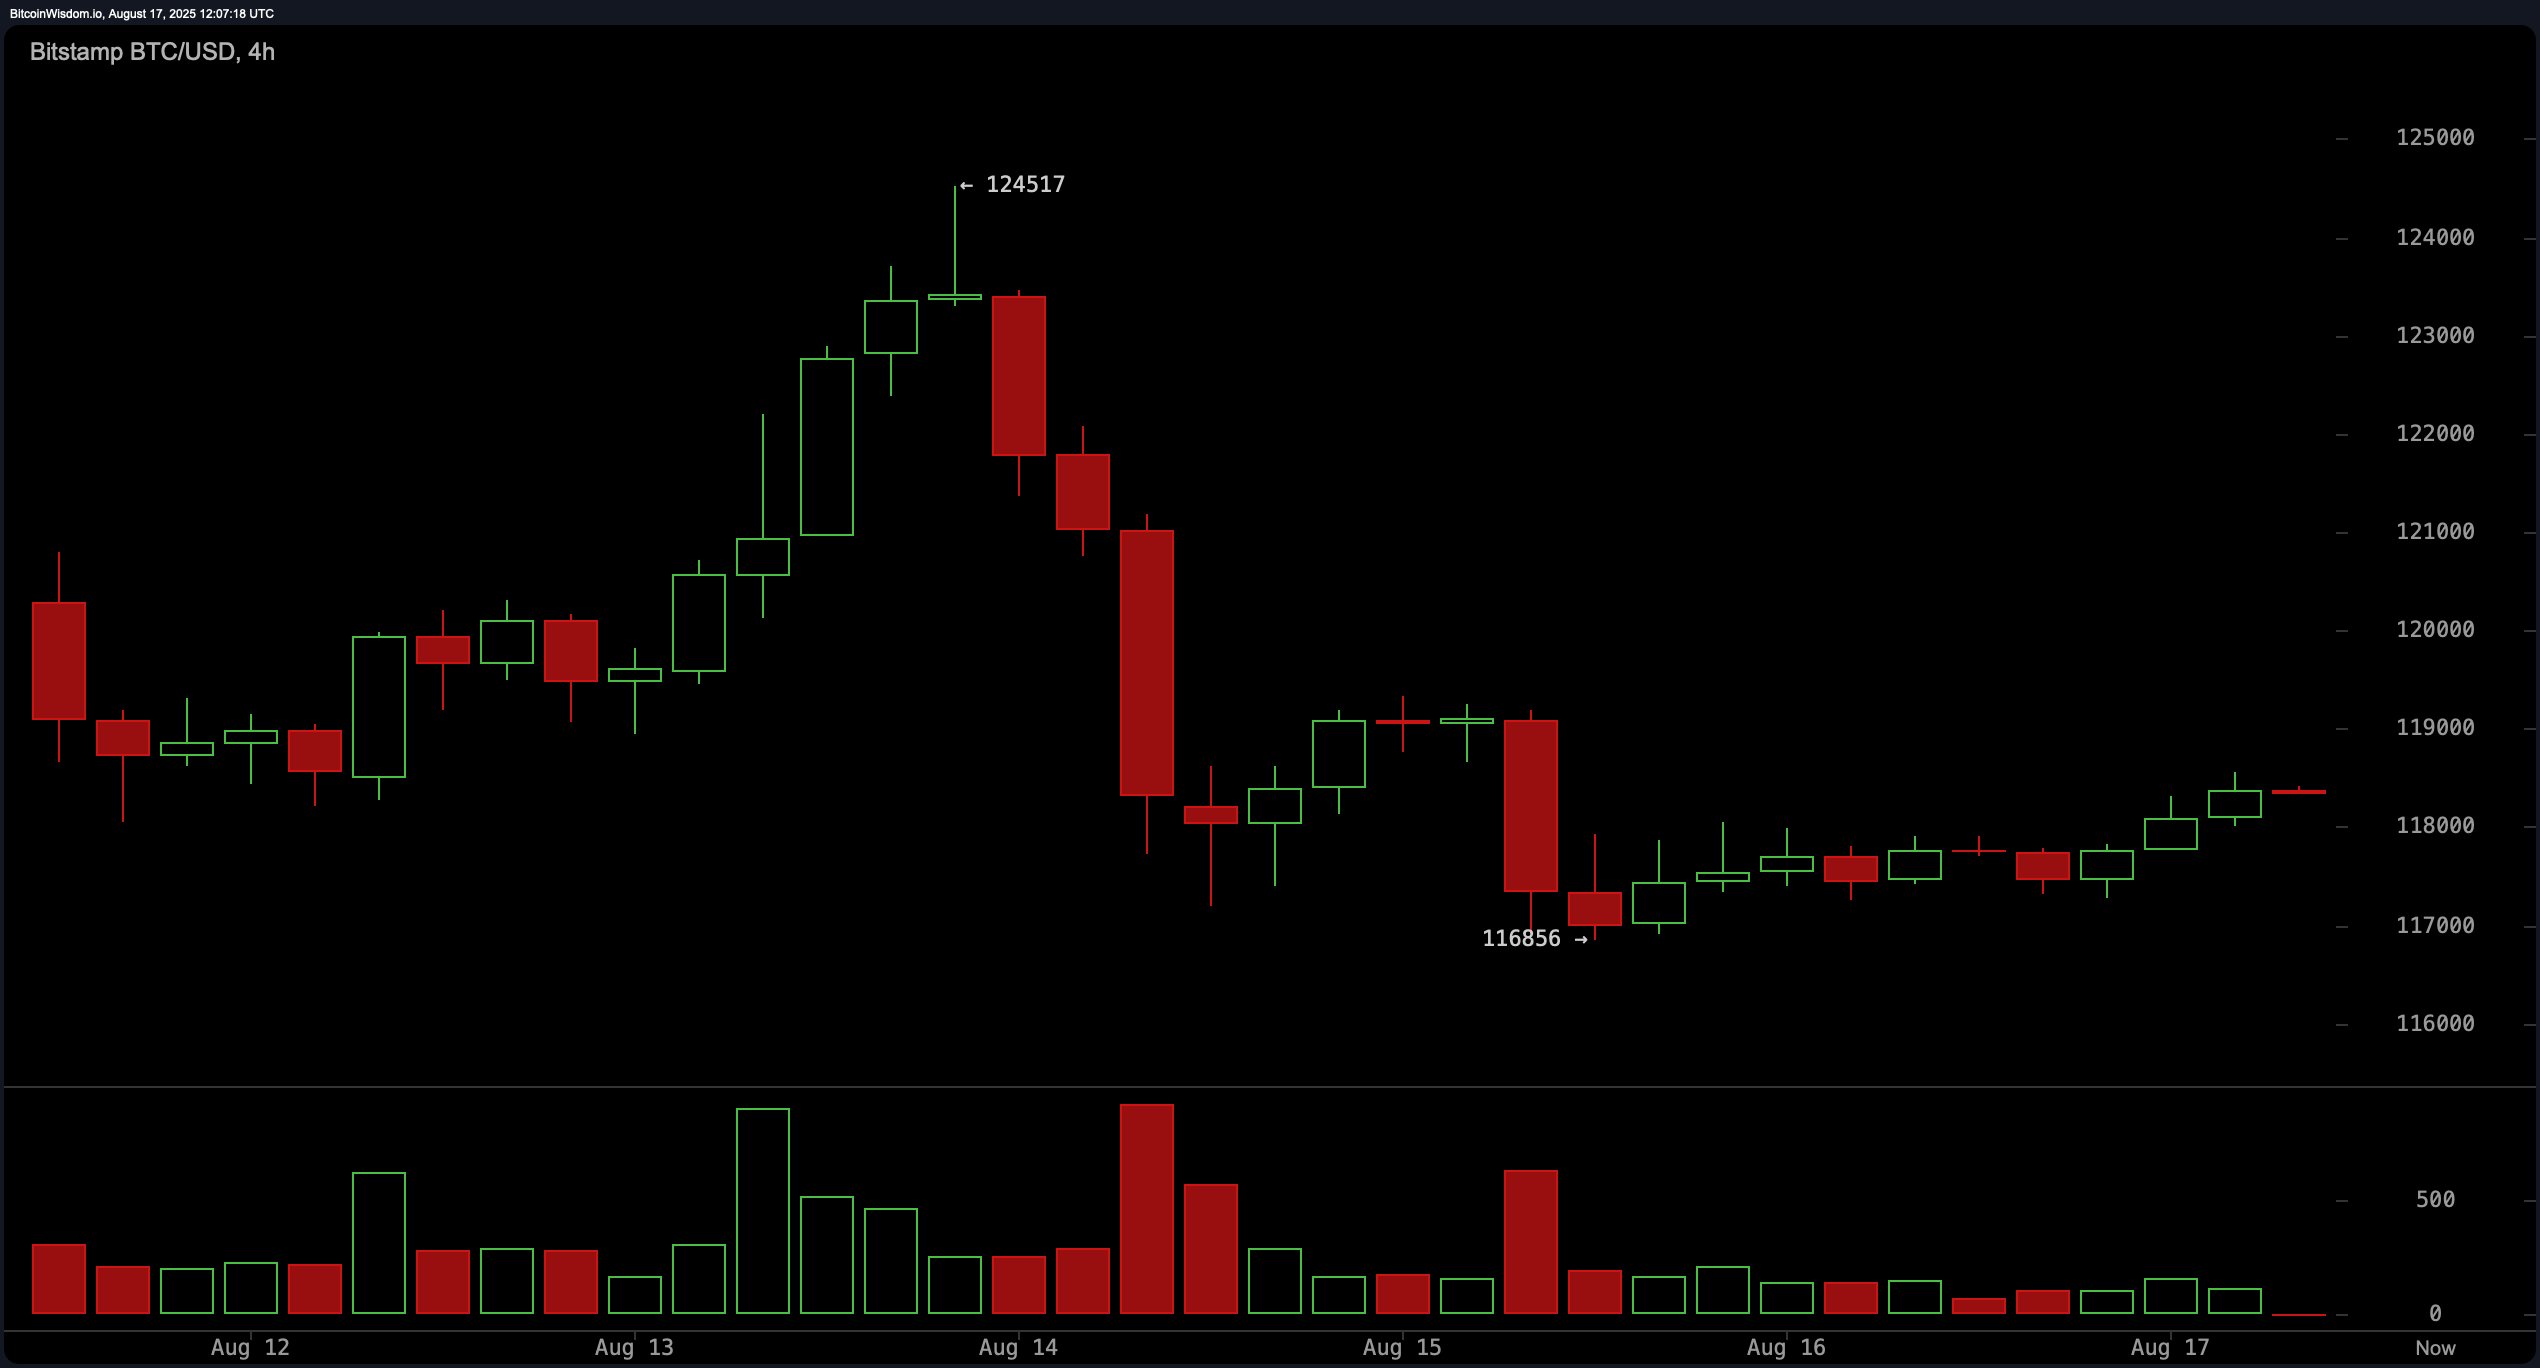
On the four-hour chart, bitcoin is recovering from a temporary bottom at $116,856, showing early signs of base-building behavior. Despite massive red candles from the local top, higher lows are emerging, offering some stability. The price is hovering below $119,000, but buying momentum remains weak. A breakout above $119,500 with a confirmed bullish candle could open a path to $121,000 or higher, while failure to hold above $118,000 risks further downside toward $117,000. This timeframe captures the tug-of-war between cautious bulls and opportunistic bears.

BTC/USD 4-hour chart via Bitstamp on Aug. 17, 2025.
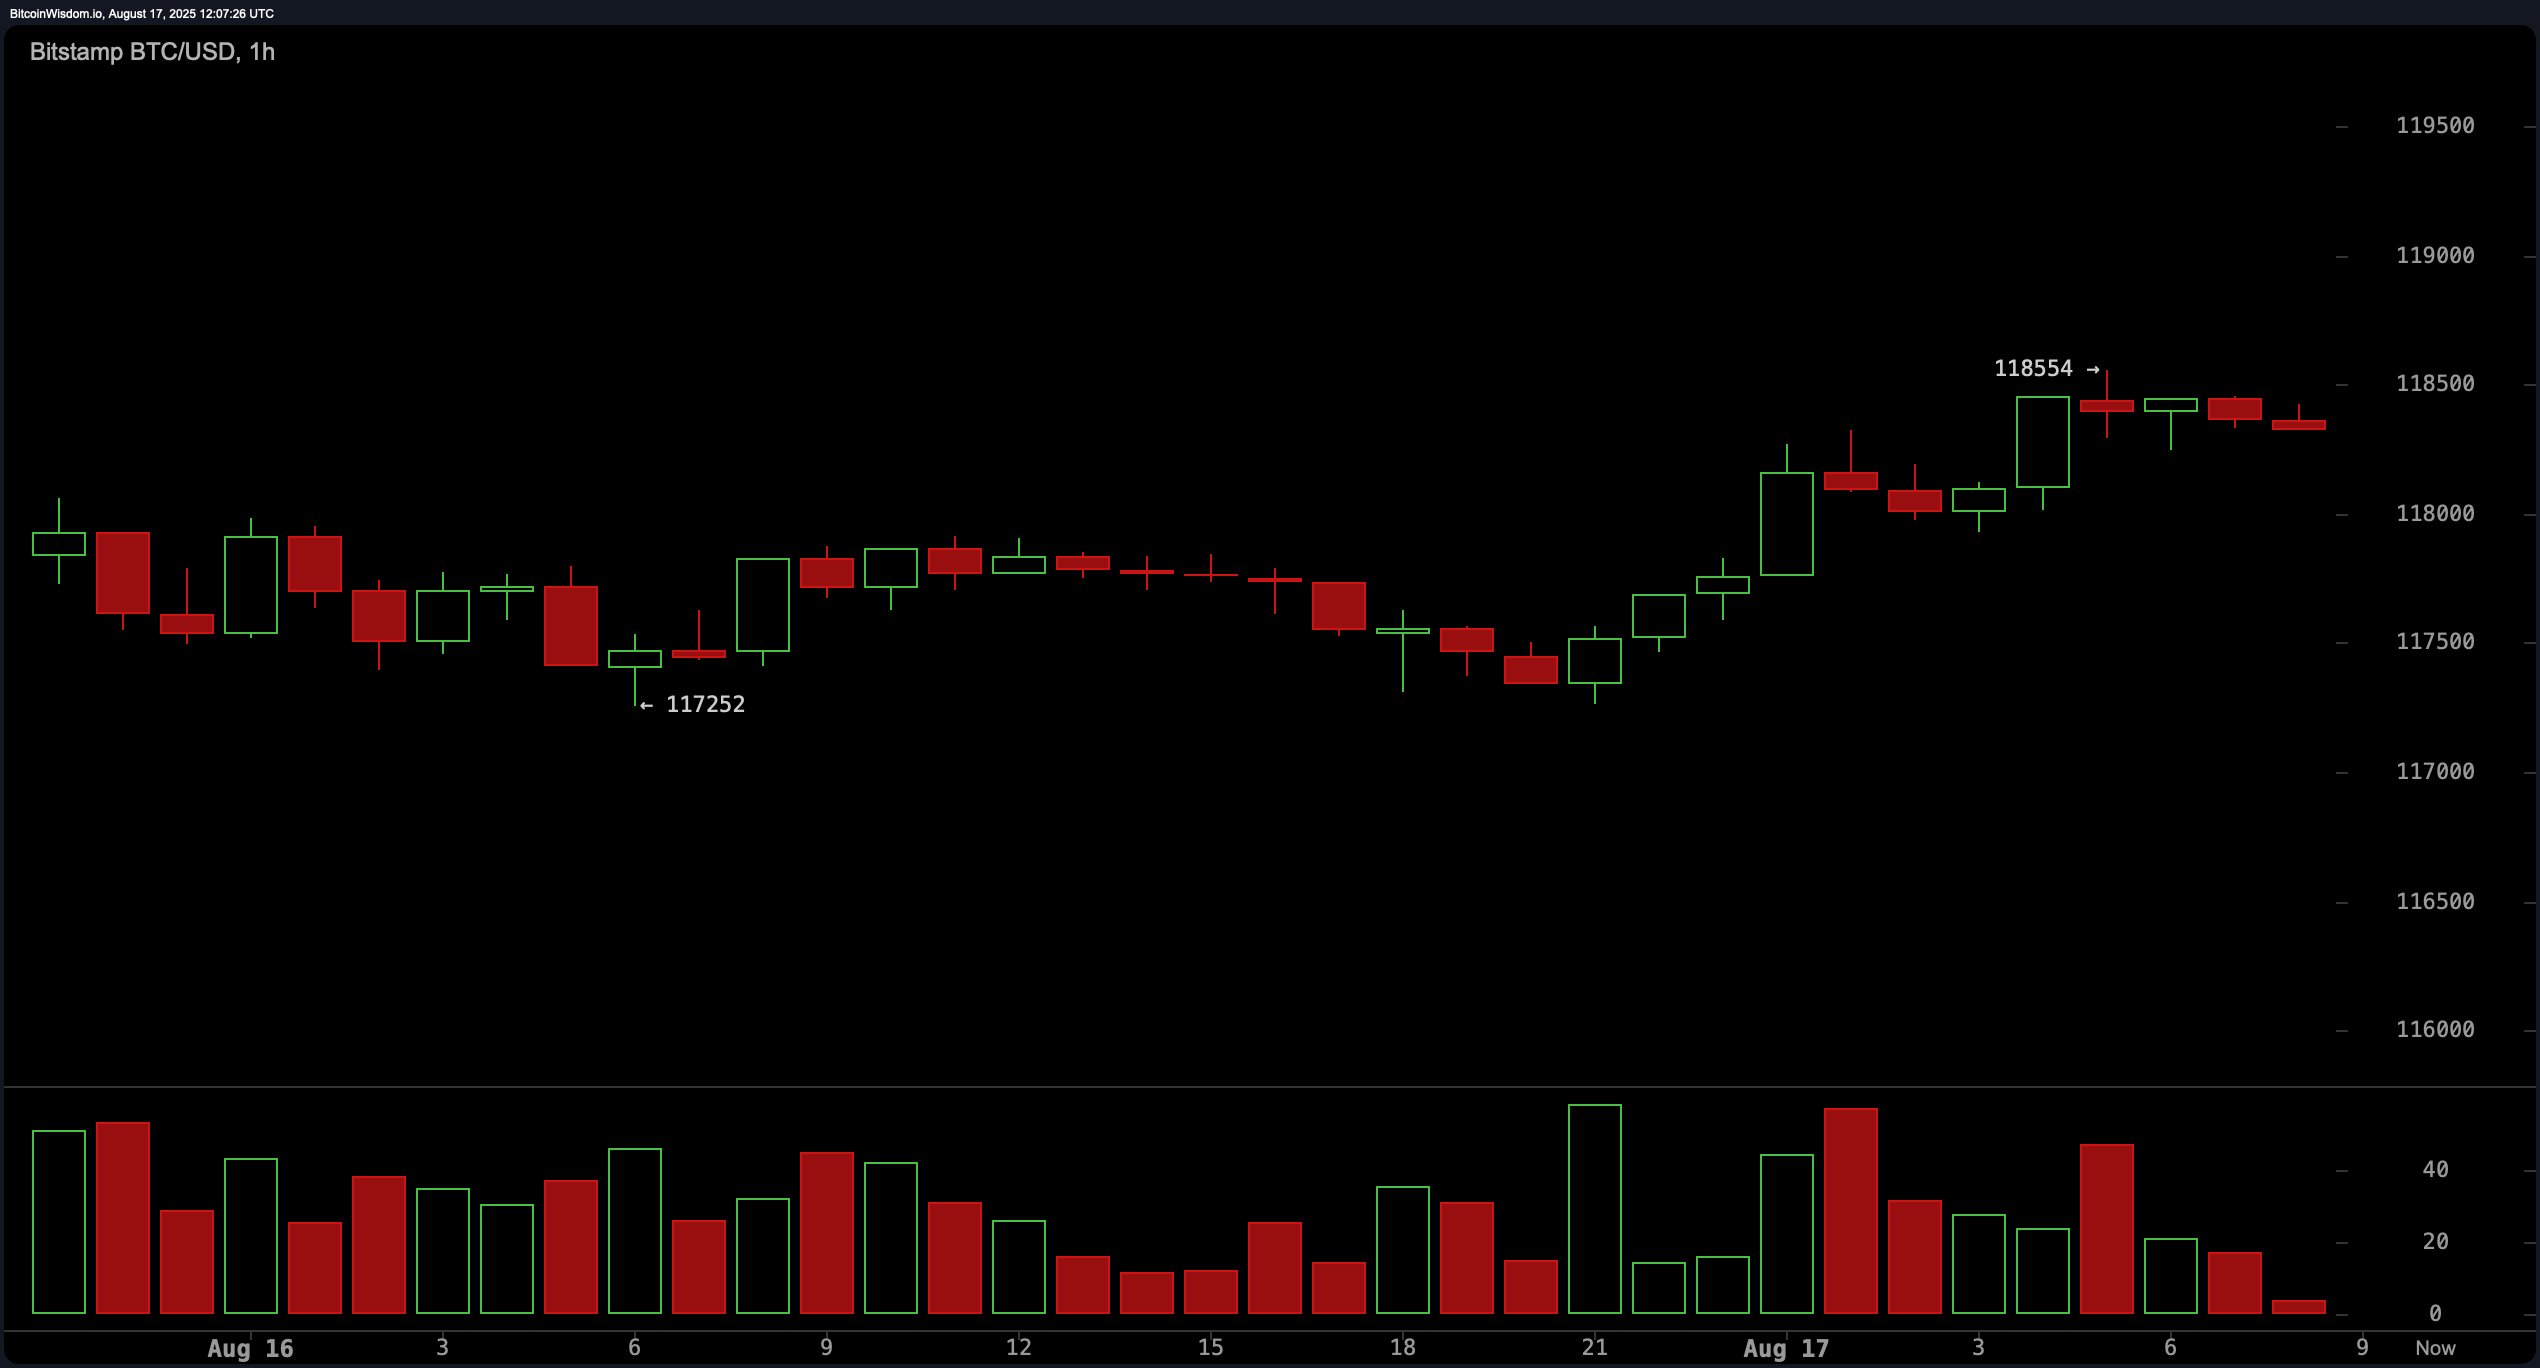
The one-hour bitcoin chart reveals short-term indecision as bitcoin fluctuates between $117,800 and $118,600. A recovery from $117,252 back to $118,554 has given way to choppy sideways action, reflecting low momentum. Volume has declined, raising the likelihood of an imminent volatility spike. Traders are watching for a decisive breakout: a surge above $118,600 could target $119,500, while a breakdown under $117,800 could trigger a move toward $116,500. This intraday range makes for potential scalp opportunities but requires tight risk management.

BTC/USD 1-hour chart via Bitstamp on Aug. 17, 2025.
Oscillator readings indicate a mixed market environment. The relative strength index (RSI) at 53 is neutral, as are the Stochastic, commodity channel index (CCI), average directional index (ADX), and Awesome oscillator. Momentum at 873 and the moving average convergence divergence (MACD) level at 906 both flash bearish signals, highlighting weak underlying strength. Overall, oscillators suggest bitcoin lacks a clear directional bias, aligning with the consolidation seen across timeframes.
Moving averages (MAs) present a more constructive outlook. The exponential moving averages (EMAs) for 10, 20, 30, 50, 100, and 200 periods all signal bullish optimism, reflecting longer-term trend support. Simple moving averages (SMAs) are more mixed, with the 10-period showing sell but the 20 through 200 periods aligned with positive signals. This divergence highlights near-term uncertainty against a broader bullish foundation. As long as bitcoin holds above the 200-period averages—currently at $102,850 (EMA) and $100,297 (SMA)—the longer-term uptrend remains intact, though short-term volatility could disrupt momentum.
Bull Verdict:
If bitcoin sustains support above $117,500 and breaks through the $119,000–$119,500 resistance band with volume, the path opens toward $121,000–$122,500 in the near term. Strong buy signals from the longer-term moving averages reinforce the broader uptrend, suggesting that current consolidation could be a launching pad for another leg higher.
Bear Verdict:
Failure to hold $117,000 and a breakdown below the $116,500 level would likely confirm a bearish continuation, exposing downside targets at $114,615 and potentially the swing low at $111,919. Oscillator weakness and sell signals from momentum and the moving average convergence divergence (MACD) highlight the risk that bulls may struggle to defend current levels.
免责声明:本文章仅代表作者个人观点,不代表本平台的立场和观点。本文章仅供信息分享,不构成对任何人的任何投资建议。用户与作者之间的任何争议,与本平台无关。如网页中刊载的文章或图片涉及侵权,请提供相关的权利证明和身份证明发送邮件到support@aicoin.com,本平台相关工作人员将会进行核查。


