The XRP Army has drawn the line: the $3 price mark is now their battlefield. But, at the moment, traders can’t seem to decide if XRP is headed to the moon or back down towards doom.
After hot inflation data dampened jumbo rate cut hopes earlier this week, XRP dropped 6.4%—right down to that pivotal $3.00 mark that could define the crypto asset’s next major move.
On Myriad, a prediction market created by Decrypt’s parent company Dastan, traders remain slightly bullish despite the correction. Myriad users give XRP a 63.7% chance of reaching $4 or higher (the moon scenario) versus 36.3% odds of crashing back down to $2 or below (doom).
So who’s right?
XRP price: The technical puzzle
XRP, the cryptocurrency created by the founders of payments company Ripple, presents a technical puzzle that explains why traders are currently so divided.
For reference, even at just $3, XRP commands a market capitalization of $181 billion, good for third-largest behind only Bitcoin and Ethereum. And it’s coming off a very recent all-time high of $3.65, which the coin hit less than a month ago. So where is it going next?
For starters, the distance from its current price (the white line in the chart below) to the moon (the green line) and its distance towards doom (the red line) is basically the same: 33.33%. So, odds based on the percentage leap required to hit either scenario is not really a factor right now. It’s going to require a little further digging.
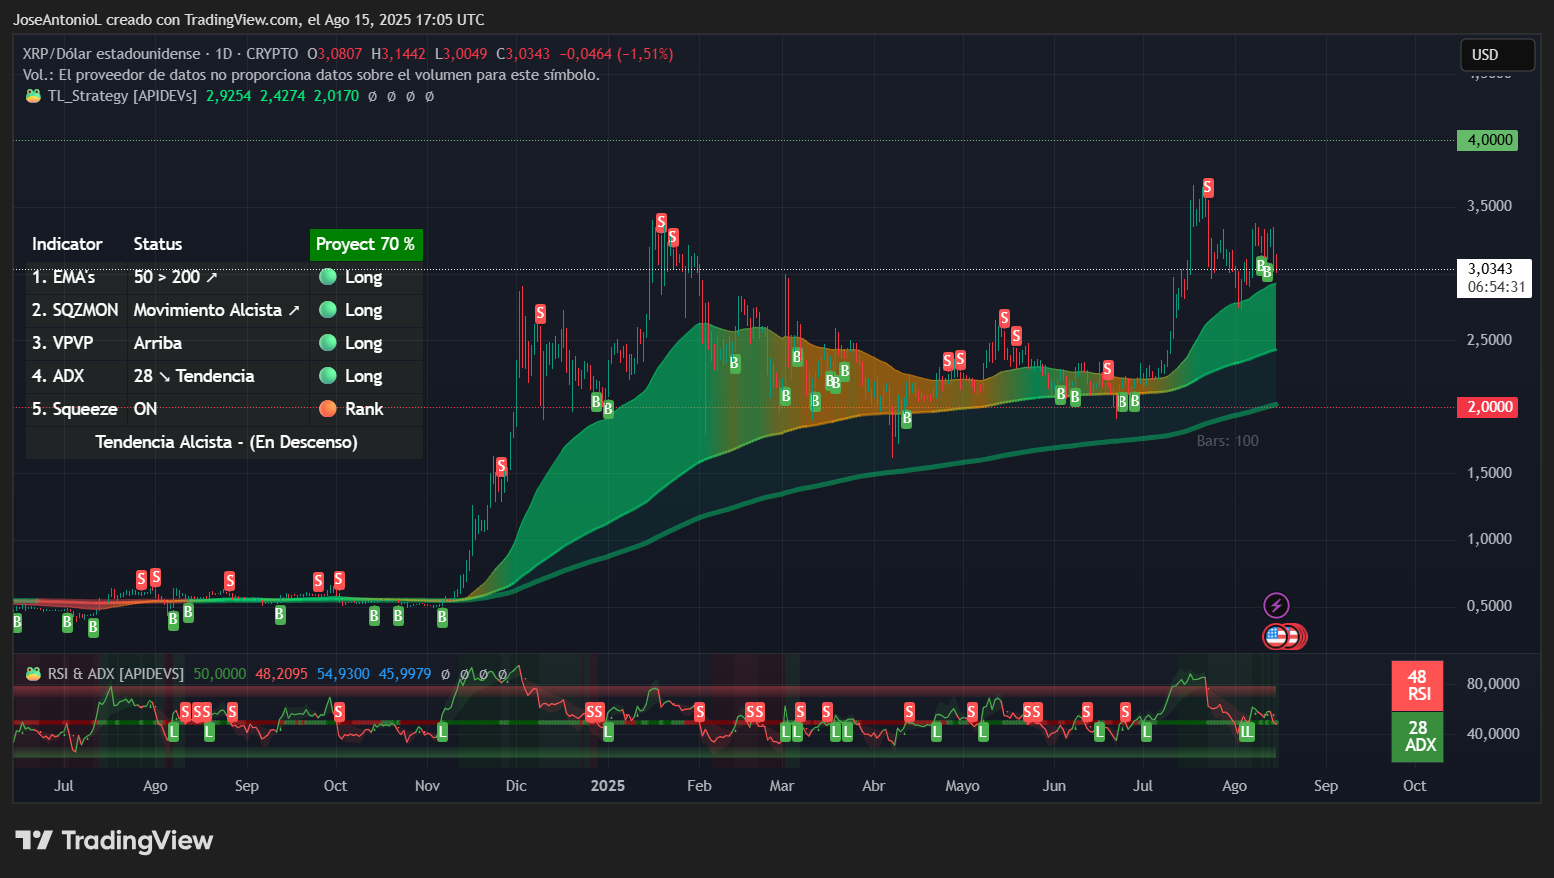
XRP price data. Image: Tradingview
One classic indicator for traders is the Relative Strength Index, or RSI. For XRP, this sits right at 48, just shy of the neutral 50 mark.
RSI measures momentum on a scale of 0-100, where readings above 70 signal overbought conditions (time to sell) and below 30 indicate oversold (time to buy). At 48, we're in no-man's land—slightly bearish but not enough to panic. This is what traders call the "decision zone," where markets pick their next direction.
Going off RSI, under current conditions, market forces are in equilibrium. However, the overall trend is bullish, so this would signal to traders that prices are more likely to maintain momentum and speed unless something else affects the trend.
The Average Directional Index, or ADX, at 28 tells a more decisive story. ADX measures trend strength regardless of direction. Think of it as a speedometer that doesn't care if you're going forwards or backwards. Readings above 25 confirm a strong trend exists, and at 28, XRP is definitely trending. This signals to traders that XRP’s upward movement is likely to continue, even if slowly. And, of course, the more the price goes up, the less likely a $2 “doom” scenario becomes.
Another key indicator is the exponential moving average, which measures the average price of an asset over a certain amount of time. For XRP, the 50-day EMA sits comfortably above the 200-day EMA, creating what traders call a "bullish stack."
This means the average price of XRP in the short-term is trading above the average price over the long-term, and that typically means buyers will keep stepping in at higher prices. It’s a vote of confidence in the uptrend. This setup usually favors continuation higher unless something breaks.
For XRP to correct down to the “doom” zone, it would need to switch momentum entirely and, likely, enter a death cross formation.
The only indicator that is not bullish for XRP right now seems to be the Squeeze Momentum Indicator, which shows a price consolidation zone as the Ripple-linked token struggles to break past its recent all-time high. Think of it as the market taking a deep breath before the next sprint.
Prices can experience a stronger trend either up or down, depending on catalysts. That “squeeze” zone is considered a price compression because there are a large number of orders fighting to determine the trend. If short-term traders exit those positions in search for other markets, then there could be a fast dip in the same zone as it could trigger many “stop-loss” zones. On the other hand, if there is a short squeeze, or bulls take control, it could trigger a spike based on buy orders activated too close to each other.
But technicals only tell half the story. The 30-day moving average for XRP whale inflows to exchanges jumped to 260 million tokens from 141 million tokens at July's start, with large holders offloading nearly $6 billion worth since mid-July. That's a serious distribution that historically precedes corrections, because the most logical reason to send an asset to an exchange is to sell it.
Meanwhile, the SEC and Ripple finally ended their legal battle, removing a major overhang. Add an 88% chance of spot XRP ETF approval by December according to Polymarket and nearly 60% preference over a Litecoin ETF on Myriad Markets, and you've got catalysts that could send XRP either direction—violently.
XRP bulls have the edge
Weighing all of the data, it’s clear the charts today slightly favor the XRP moon scenario. The combination of price respecting an upward channel, maintaining position above both key EMAs, and the Squeeze ready to fire would convince traders of a compelling bullish setup. The ADX confirming trend strength while RSI sits neutral gives XRP room to run without being overextended.
Considering indicators show traders in equilibrium during a bullish move (instead of showing such behavior when the coin is trading sideways), the ascending channel and compressed volatility suggest XRP could test $3.30 within days. A clean break above would likely trigger momentum toward $4.
But those massive whale sales keep the doom scenario very much alive. If the $2.80 support cracks, all bullish bets are off. This is crypto—and when things break, they break hard.
The views and opinions expressed by the author are for informational purposes only and do not constitute financial, investment, or other advice.
免责声明:本文章仅代表作者个人观点,不代表本平台的立场和观点。本文章仅供信息分享,不构成对任何人的任何投资建议。用户与作者之间的任何争议,与本平台无关。如网页中刊载的文章或图片涉及侵权,请提供相关的权利证明和身份证明发送邮件到support@aicoin.com,本平台相关工作人员将会进行核查。


