On the daily chart, ethereum (ETH) maintains a robust bullish trend, with the price having surged from approximately $2,112 to its recent high of $4,435. Higher highs and higher lows reinforce the upward trajectory, but small-bodied candles near the top hint at short-term indecision. The $4,000 level remains a strong support zone, while $4,435 serves as the immediate resistance. A consolidation phase or minor retracement is likely before another breakout attempt, especially as momentum indicators such as the moving average convergence divergence (MACD) level and momentum both signal buying strength.
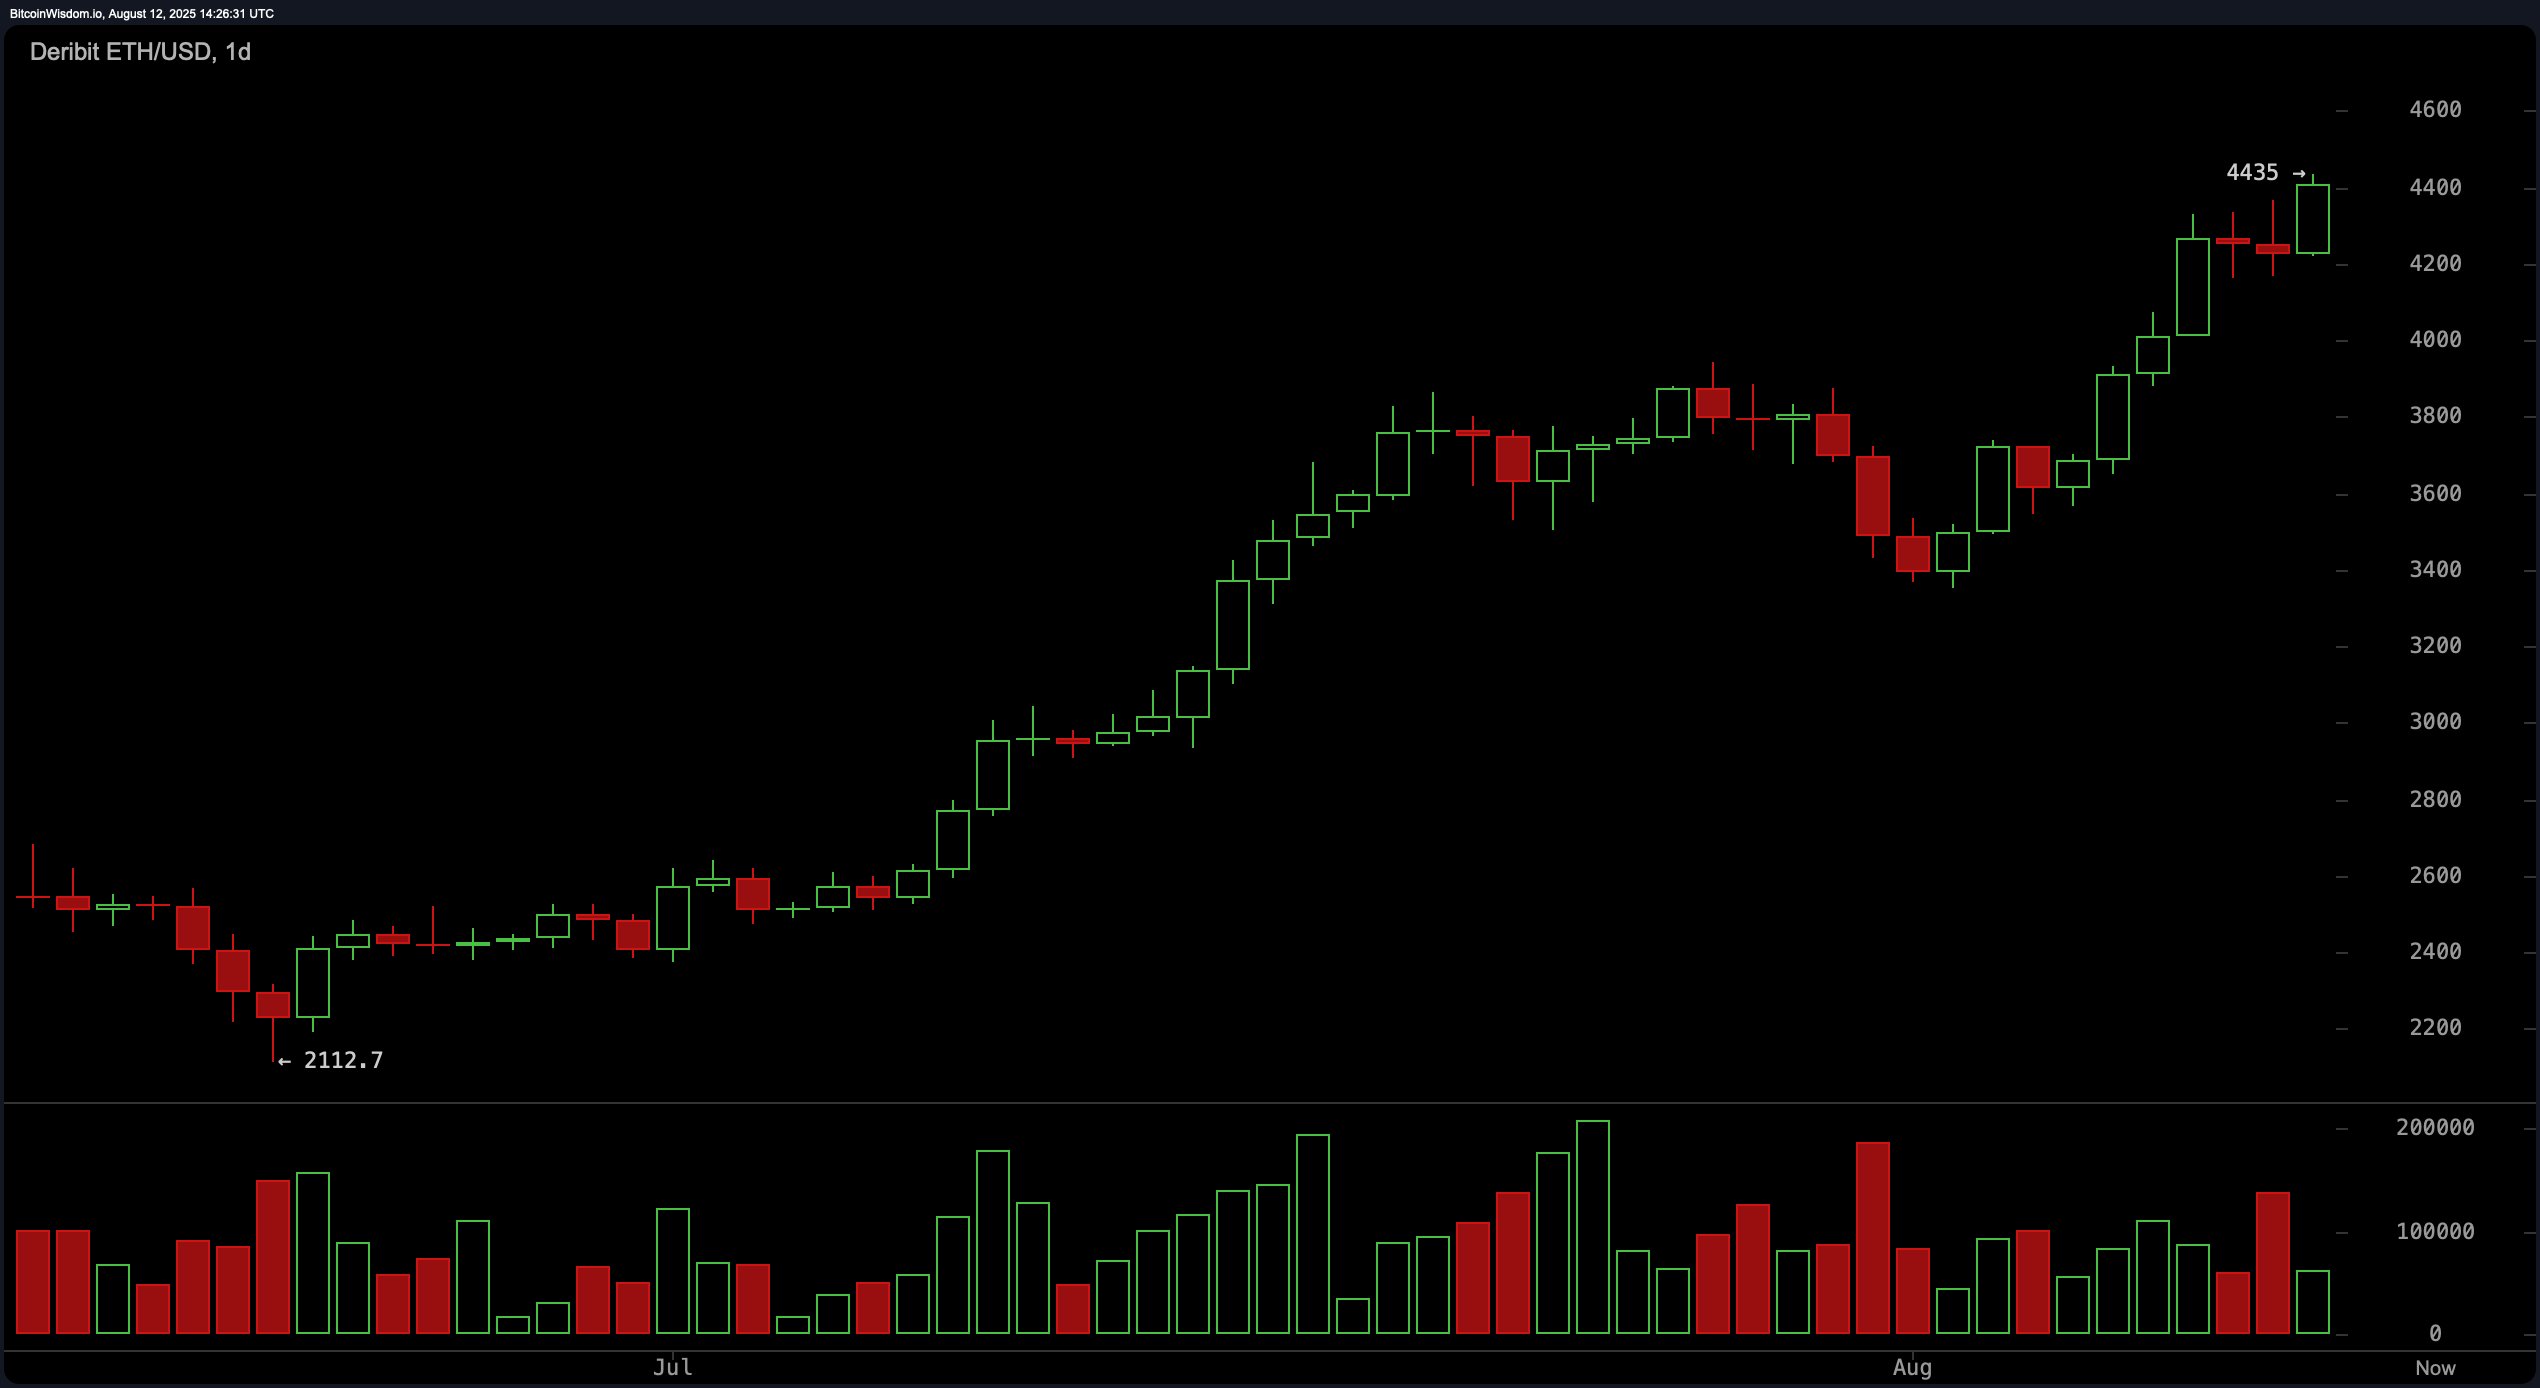
ETH/USD 1-day chart via Deribit on Aug. 12, 2025.
The 4-hour ethereum chart shows a strong rally from $3,351 to $4,435, with a critical breakout above $4,300 triggering increased buy volume. This move suggests active bullish participation, yet the price may revisit the $4,300–$4,320 range to confirm it as support. If buyers defend this area, the path toward retesting and possibly breaching $4,435 strengthens. The exponential moving averages (EMA) and simple moving averages (SMA) across all periods, from 10 to 200, remain firmly in buy territory, reinforcing the bullish bias.
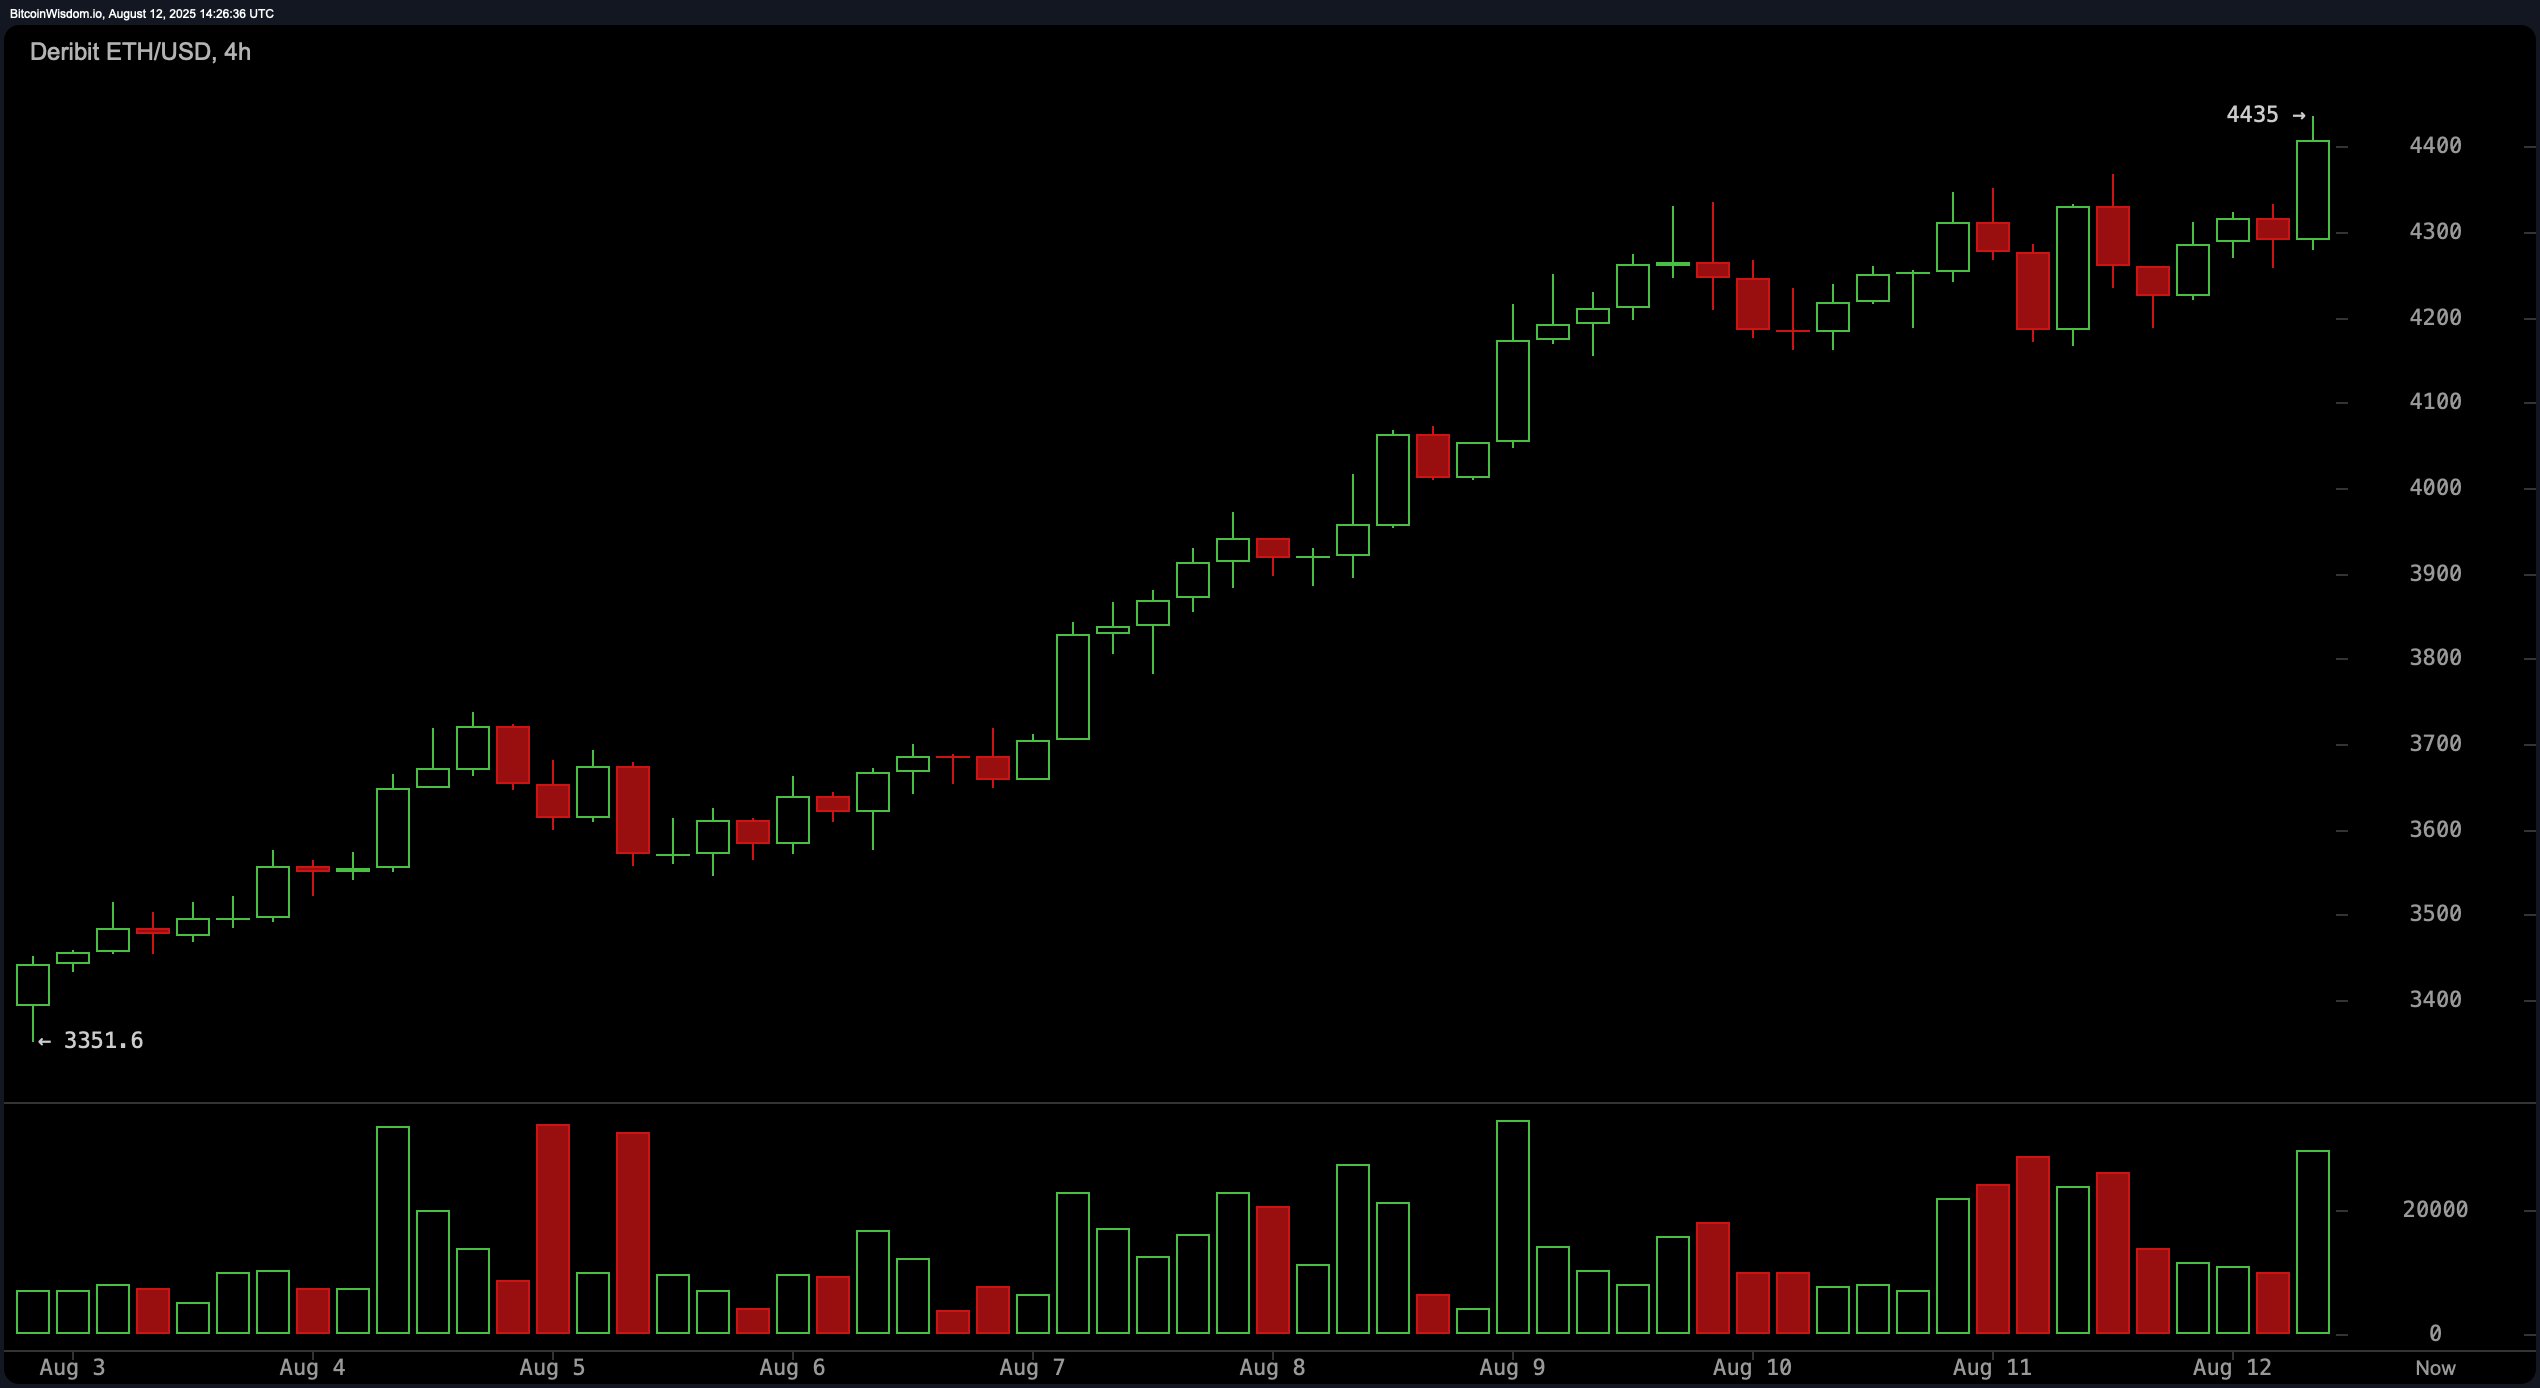
ETH/USD 4-hour chart via Deribit on Aug. 12, 2025.
On the 1-hour chart, ethereum experienced a rapid push to $4,435, followed by moderate profit-taking. A large green candle accompanied by high volume highlighted aggressive buying interest, though sellers quickly emerged at resistance. The consolidation that followed suggests intraday traders are waiting for a decisive breakout. A clean move above $4,435, backed by volume, could trigger momentum plays toward the psychological $4,500 mark, while failure to hold could prompt short-term retracements.
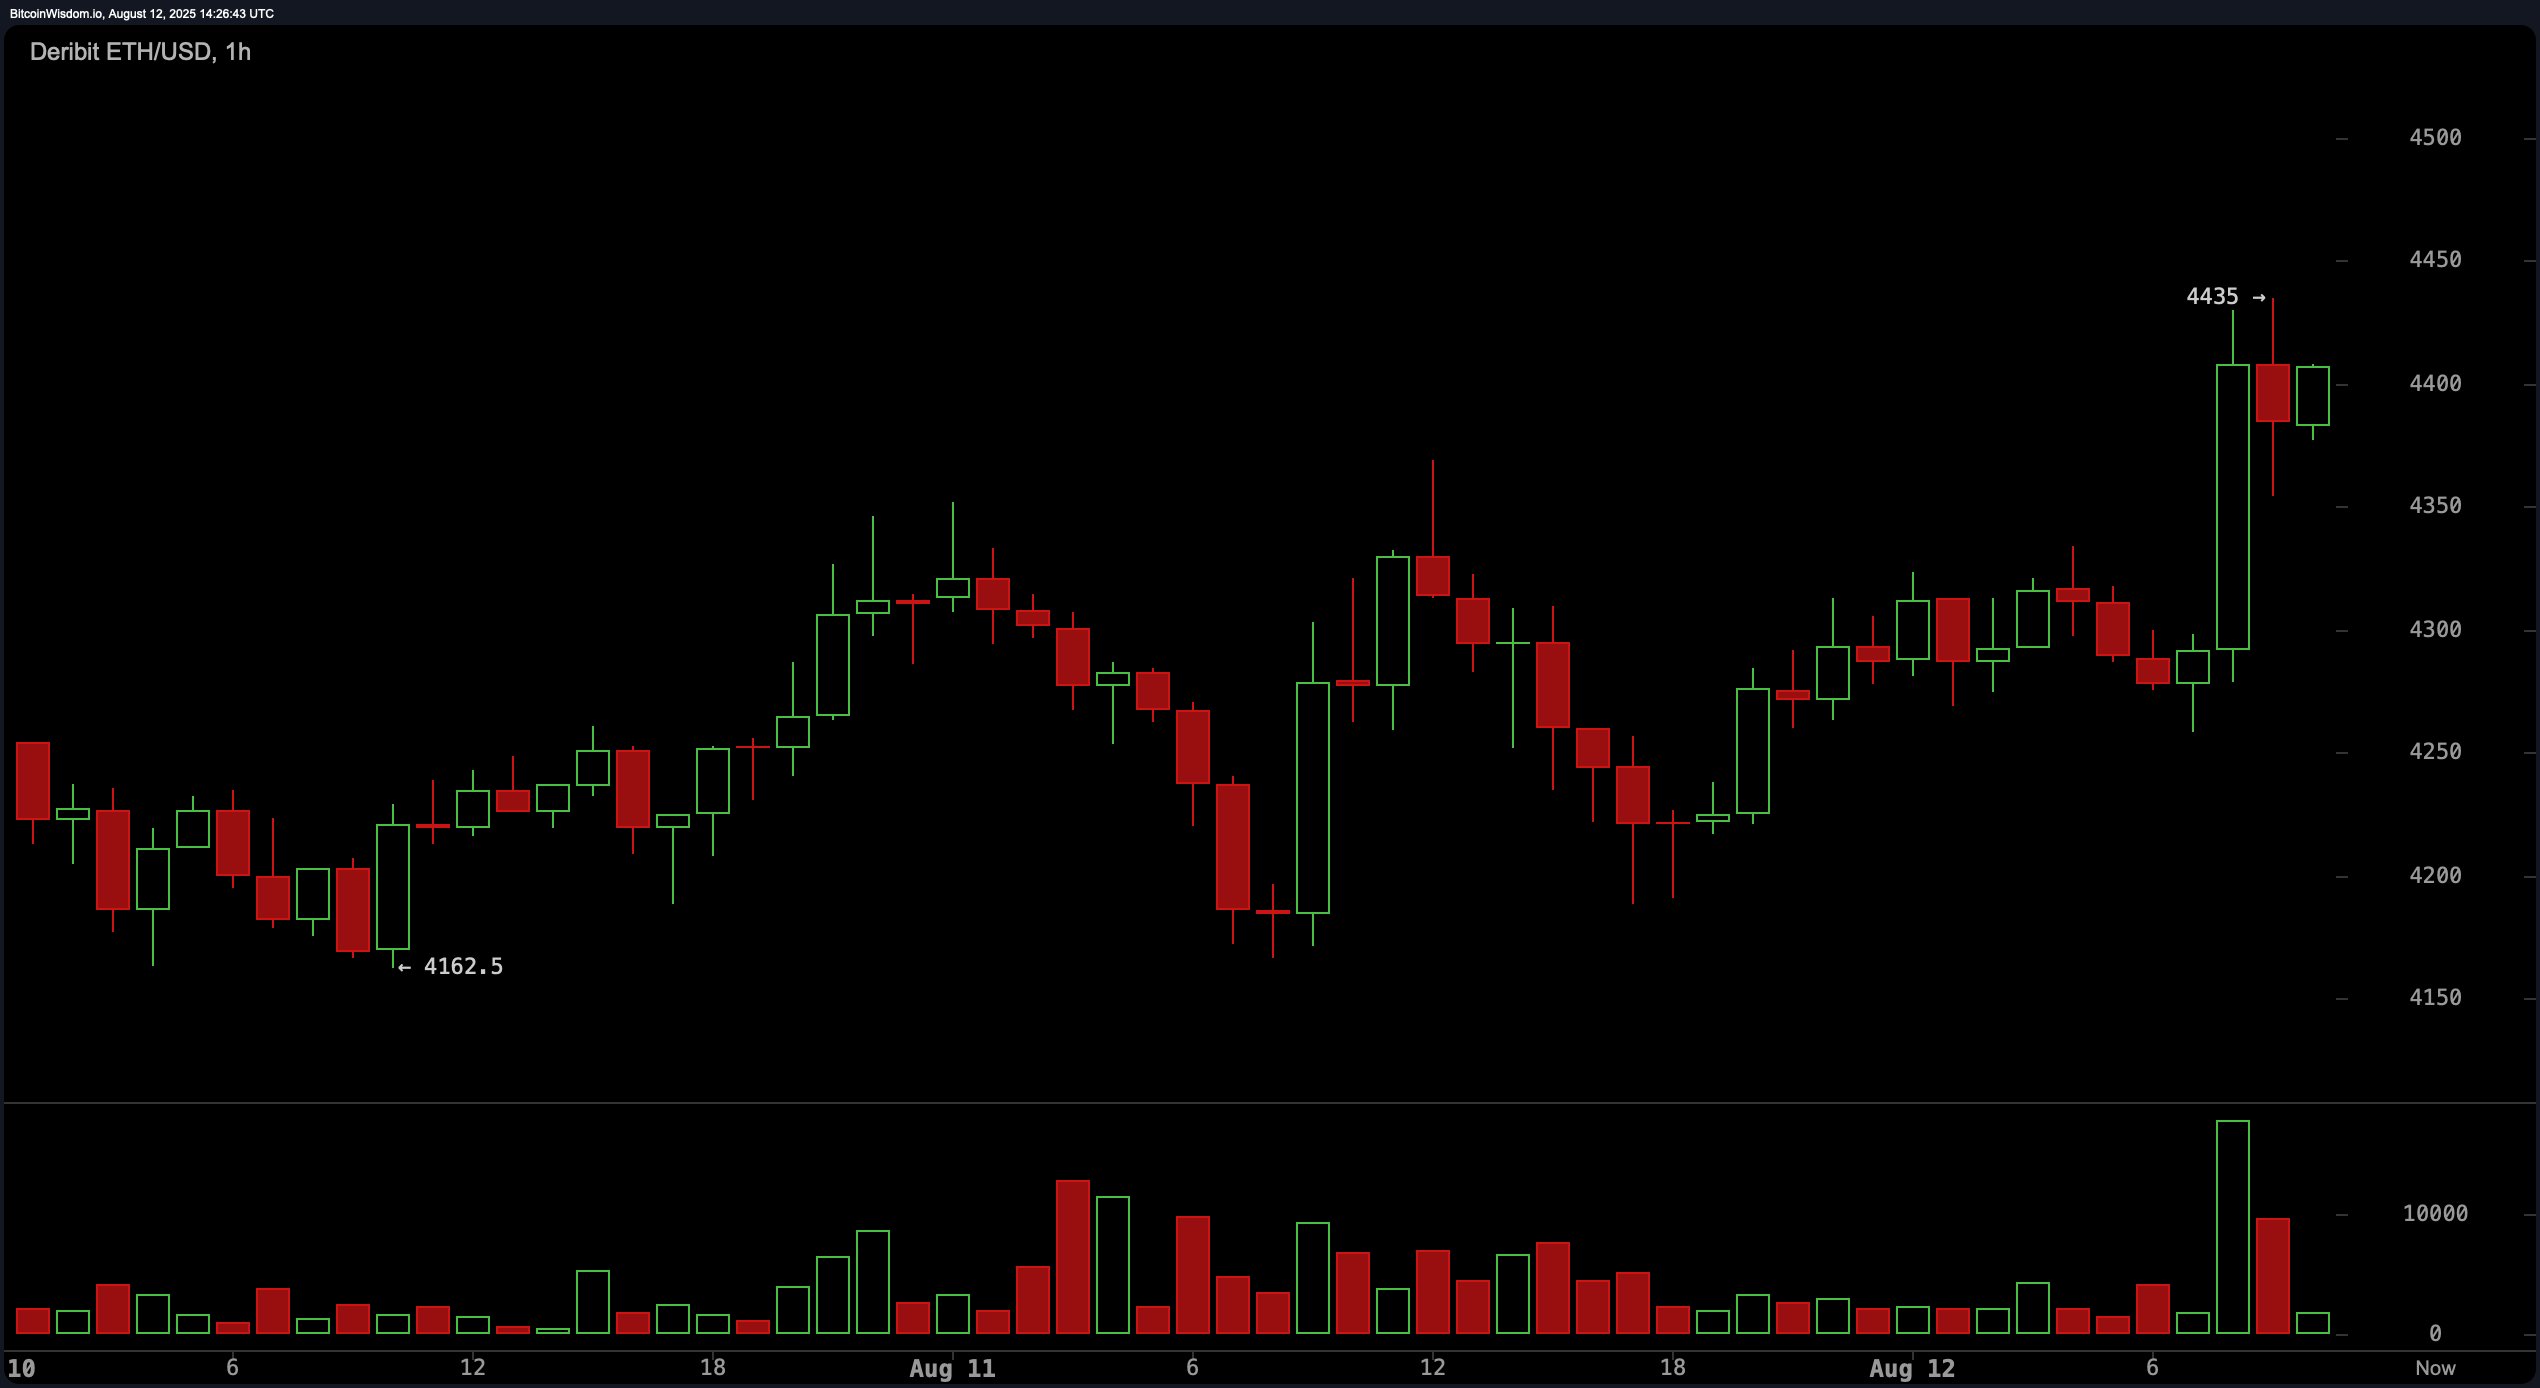
ETH/USD 1-hour chart via Deribit on Aug. 12, 2025.
Oscillators present a mixed picture. The relative strength index (RSI) at 74.8 and stochastic at 91.6 both register as neutral, reflecting an overextended but not yet exhausted rally. The commodity channel index (CCI) at 178.1 signals a sell, suggesting caution in the short term, while the average directional index (ADX) at 43.8 shows a strong trend without directional clarity. Momentum at 1,007.5 and the MACD level at 254.9 both indicate buying pressure, aligning with the overarching bullish structure.
From a strategic standpoint, the bias remains upward across all timeframes, but $4,435 is a pivotal inflection point. Swing traders may look for long entries on a confirmed pullback to $4,300, while scalpers could position for rapid gains on a breakout above resistance. Risk management remains critical, with stops placed below $4,300 for swings and just under breakout lows for scalps, given the elevated volatility in the market.
Bull Verdict:
Ethereum’s multi-timeframe bullish structure, strong support at $4,300, and consistent buy signals from both exponential moving averages (EMA) and simple moving averages (SMA) suggest that the asset is well-positioned for another leg higher. A confirmed breakout above $4,435 could quickly open the path toward the $4,500 psychological level and beyond.
Bear Verdict:
Despite the prevailing uptrend, the commodity channel index (CCI) sell signal, overextended oscillators, and resistance pressure at $4,435 raise the risk of a near-term pullback. Failure to hold above $4,300 could invite deeper profit-taking toward the $4,000 support zone.
免责声明:本文章仅代表作者个人观点,不代表本平台的立场和观点。本文章仅供信息分享,不构成对任何人的任何投资建议。用户与作者之间的任何争议,与本平台无关。如网页中刊载的文章或图片涉及侵权,请提供相关的权利证明和身份证明发送邮件到support@aicoin.com,本平台相关工作人员将会进行核查。


