The fluctuations in the cryptocurrency market are like the waves in a turbulent sea, making people feel anxious. However, its charm lies in the fact that it never looks at your past report card. Stop saying "I'll enter the market when it stabilizes"; opportunities in the crypto world never lie in "stability." The real dividends always belong to those who dare to position themselves amid uncertainty. Market volatility is not a risk; not understanding the trend is the biggest risk.
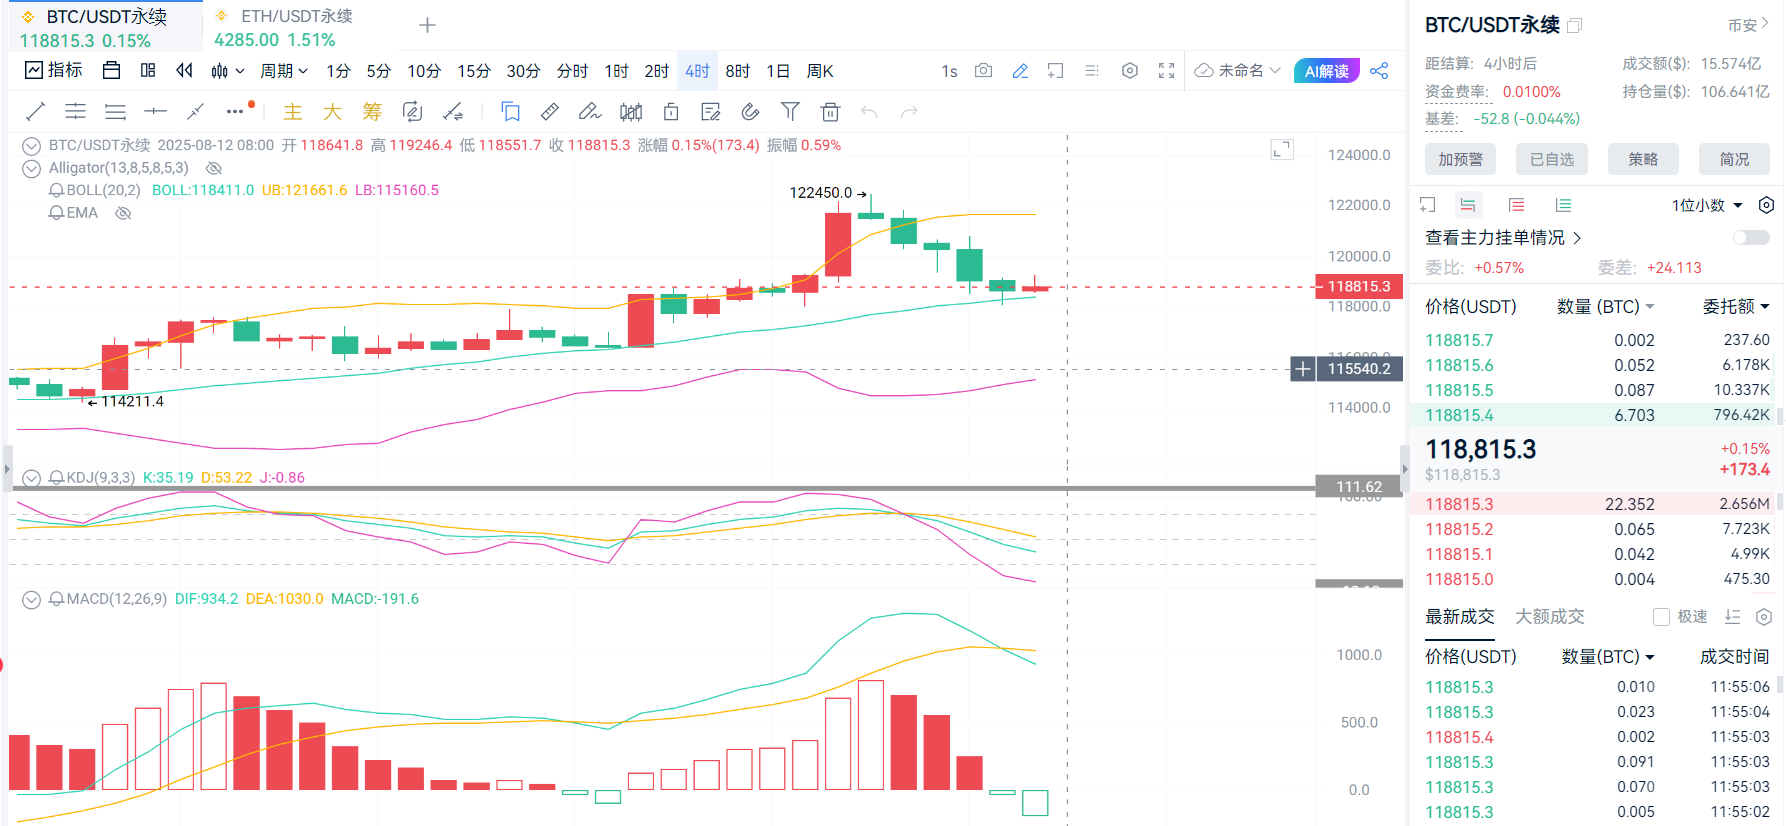
After Bitcoin surged to $122,000 during the day, it failed to form an effective breakthrough and subsequently began to fall sharply, currently reported at $118,900, with a 24-hour decline of 0.88% and a market cap of approximately $2.23 trillion. Recently, the price has risen, but trading volume has shrunk, indicating insufficient buying momentum, and caution is needed for potential pullback pressure. In the past 24 hours, the total liquidation amount across the network reached $292 million, with nearly 100,000 investors being liquidated, intensifying the long-short battle.
From the indicator information, the daily chart shows that the bullish trend remains unchanged, but the super trend indicator has issued a reversal warning, and caution is needed for a potential chain sell-off if it falls below $117,000. On the four-hour chart, after breaking through the upper Bollinger Band from yesterday's high, it has consecutively closed five bearish candles and is now near the middle Bollinger Band. The MACD has formed a death cross with expanding green bars, and the KDJ has begun to show bearish strength, indicating a possible continued downward trend in the short term. Currently, the short-term support range below is: Short-term: $117,500 (day's long-short boundary), $118,000 (daily strength and weakness watershed). Mid-term support level: $115,500 (Fibonacci retracement level), if broken, it may trigger a deep pullback to $113,000. The short-term resistance level above is: $120,500 (previous high pressure), $122,000 (psychological barrier). Breakout potential: If it stabilizes above $122,000, it may accelerate upward to $125,000-$135,000.
Short-term long position operation range suggestion: Stabilize after a pullback to $117,500-$118,000, MACD green bars shorten and KDJ forms a golden cross, stop loss at $117,000, target $119,500-$120,500.
Short-term short position operation range suggestion: Face pressure after a rebound to $120,500-$121,000, KDJ overbought (>70), stop loss at $121,500, target $119,000-$118,000.
Mid to long-term long position operation range suggestion: Build positions in batches after stabilizing above $118,000, stop loss at $115,500, target $122,000-$125,000.
Mid to long-term short position operation range suggestion: Lightly short if it falls below $117,500, stop loss at $118,500, target $115,000-$113,000.
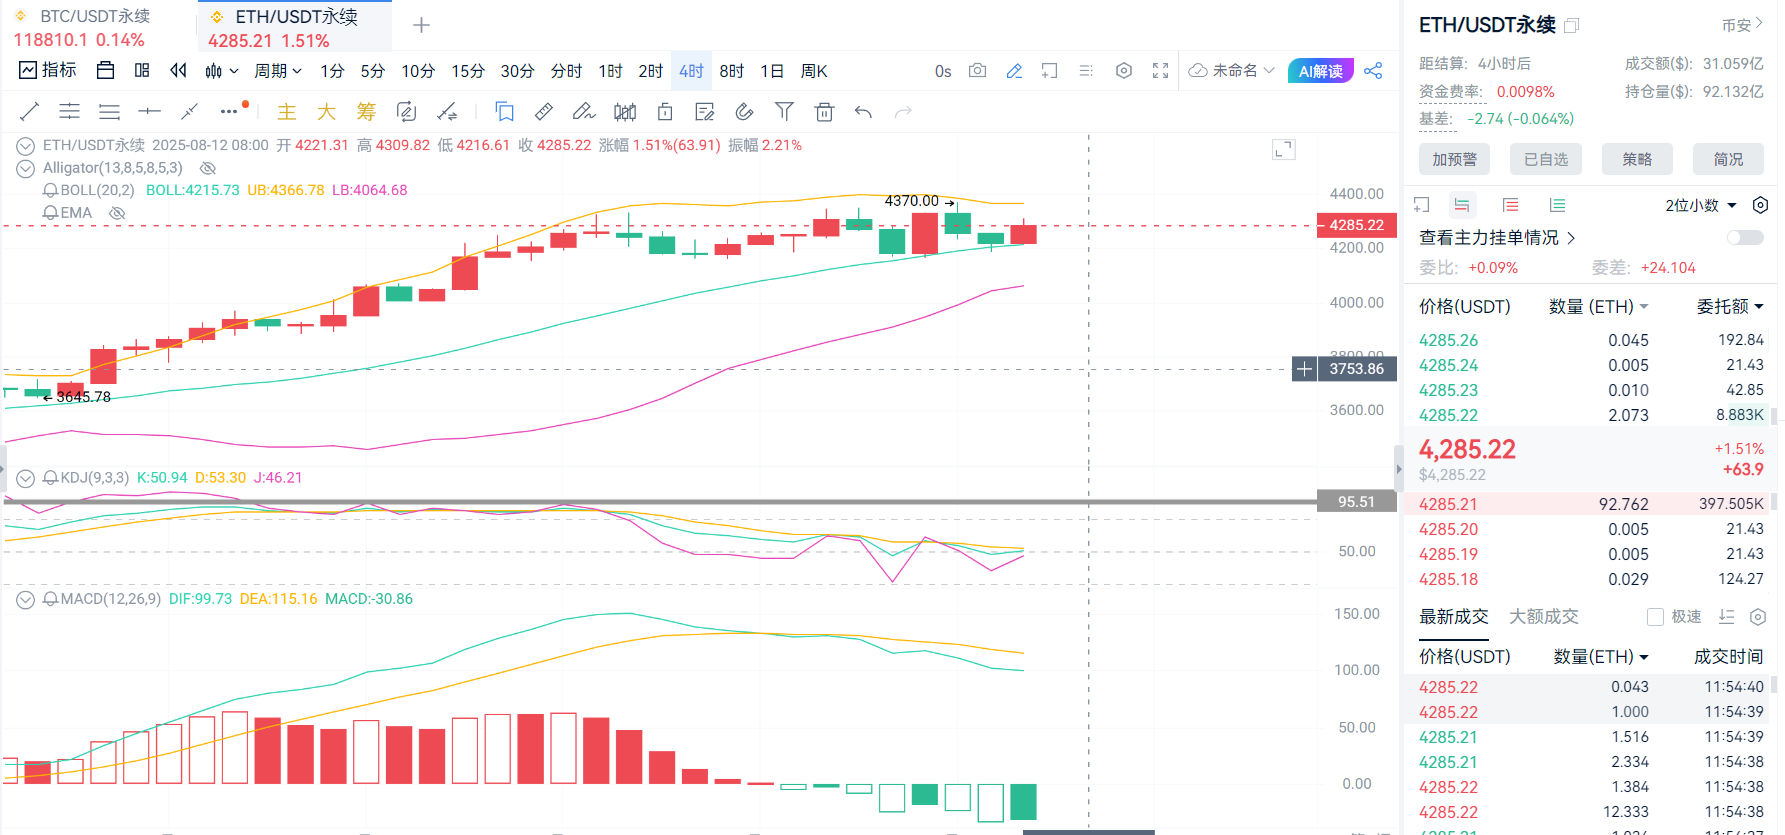
Ethereum is currently reported at $4,280, with a 24-hour decline of 0.57%, briefly falling below the $4,200 support this morning. In the past week, it has risen by 21%, with a market cap exceeding $523 billion (surpassing Mastercard). Meanwhile, recent Ethereum ETFs have attracted a total of $6.7 billion in funds, and the proportion of long positions in the derivatives market has risen to 65%, indicating market bets on upgrade expectations.
From the indicator information, the daily chart is still dominated by bulls, with daily moving averages in a bullish arrangement, MACD showing strong upward momentum, and the upper Bollinger Band pressure moving up to around $4,400. On the four-hour chart, the K-line has been operating above the middle Bollinger Band, and the KDJ is also in a bullish upward trend, with MACD green momentum starting to expand. It is expected to accumulate energy for the next surge.
Short-term long position operation range suggestion: Pull back to $4,200-$4,230 support (EMA60 + Fibonacci 61.8%), KDJ forms a golden cross at a low position, stop loss at $4,180, target $4,300-$4,350.
Short-term short position operation range suggestion: Face pressure after a rebound to $4,350-$4,380, KDJ overbought (>75), stop loss at $4,400, target $4,300-$4,250.
Mid to long-term long position operation range suggestion: Increase positions after breaking through $4,350, stop loss at $4,300, target $4,500-$4,800.
Mid to long-term short position operation range suggestion: Layout mid-term short positions if it falls below $4,200, stop loss at $4,250, target $4,000-$3,880.
Due to the timeliness of price points, there may be delays in post reviews, and specific operations should still be based on real-time market conditions. The above operation range analysis is for reference only; the cryptocurrency market is highly risky, so please make cautious decisions when investing. If you are interested in specific indicator analysis or the impact of new market dynamics on prices, feel free to scan the QR code for the public account in the article below, and you are welcome to visit.

Warm reminder: The content of the above article is original by the author, and the advertisements at the end of the article and in the comments section are unrelated to the author, please be cautious!
免责声明:本文章仅代表作者个人观点,不代表本平台的立场和观点。本文章仅供信息分享,不构成对任何人的任何投资建议。用户与作者之间的任何争议,与本平台无关。如网页中刊载的文章或图片涉及侵权,请提供相关的权利证明和身份证明发送邮件到support@aicoin.com,本平台相关工作人员将会进行核查。


