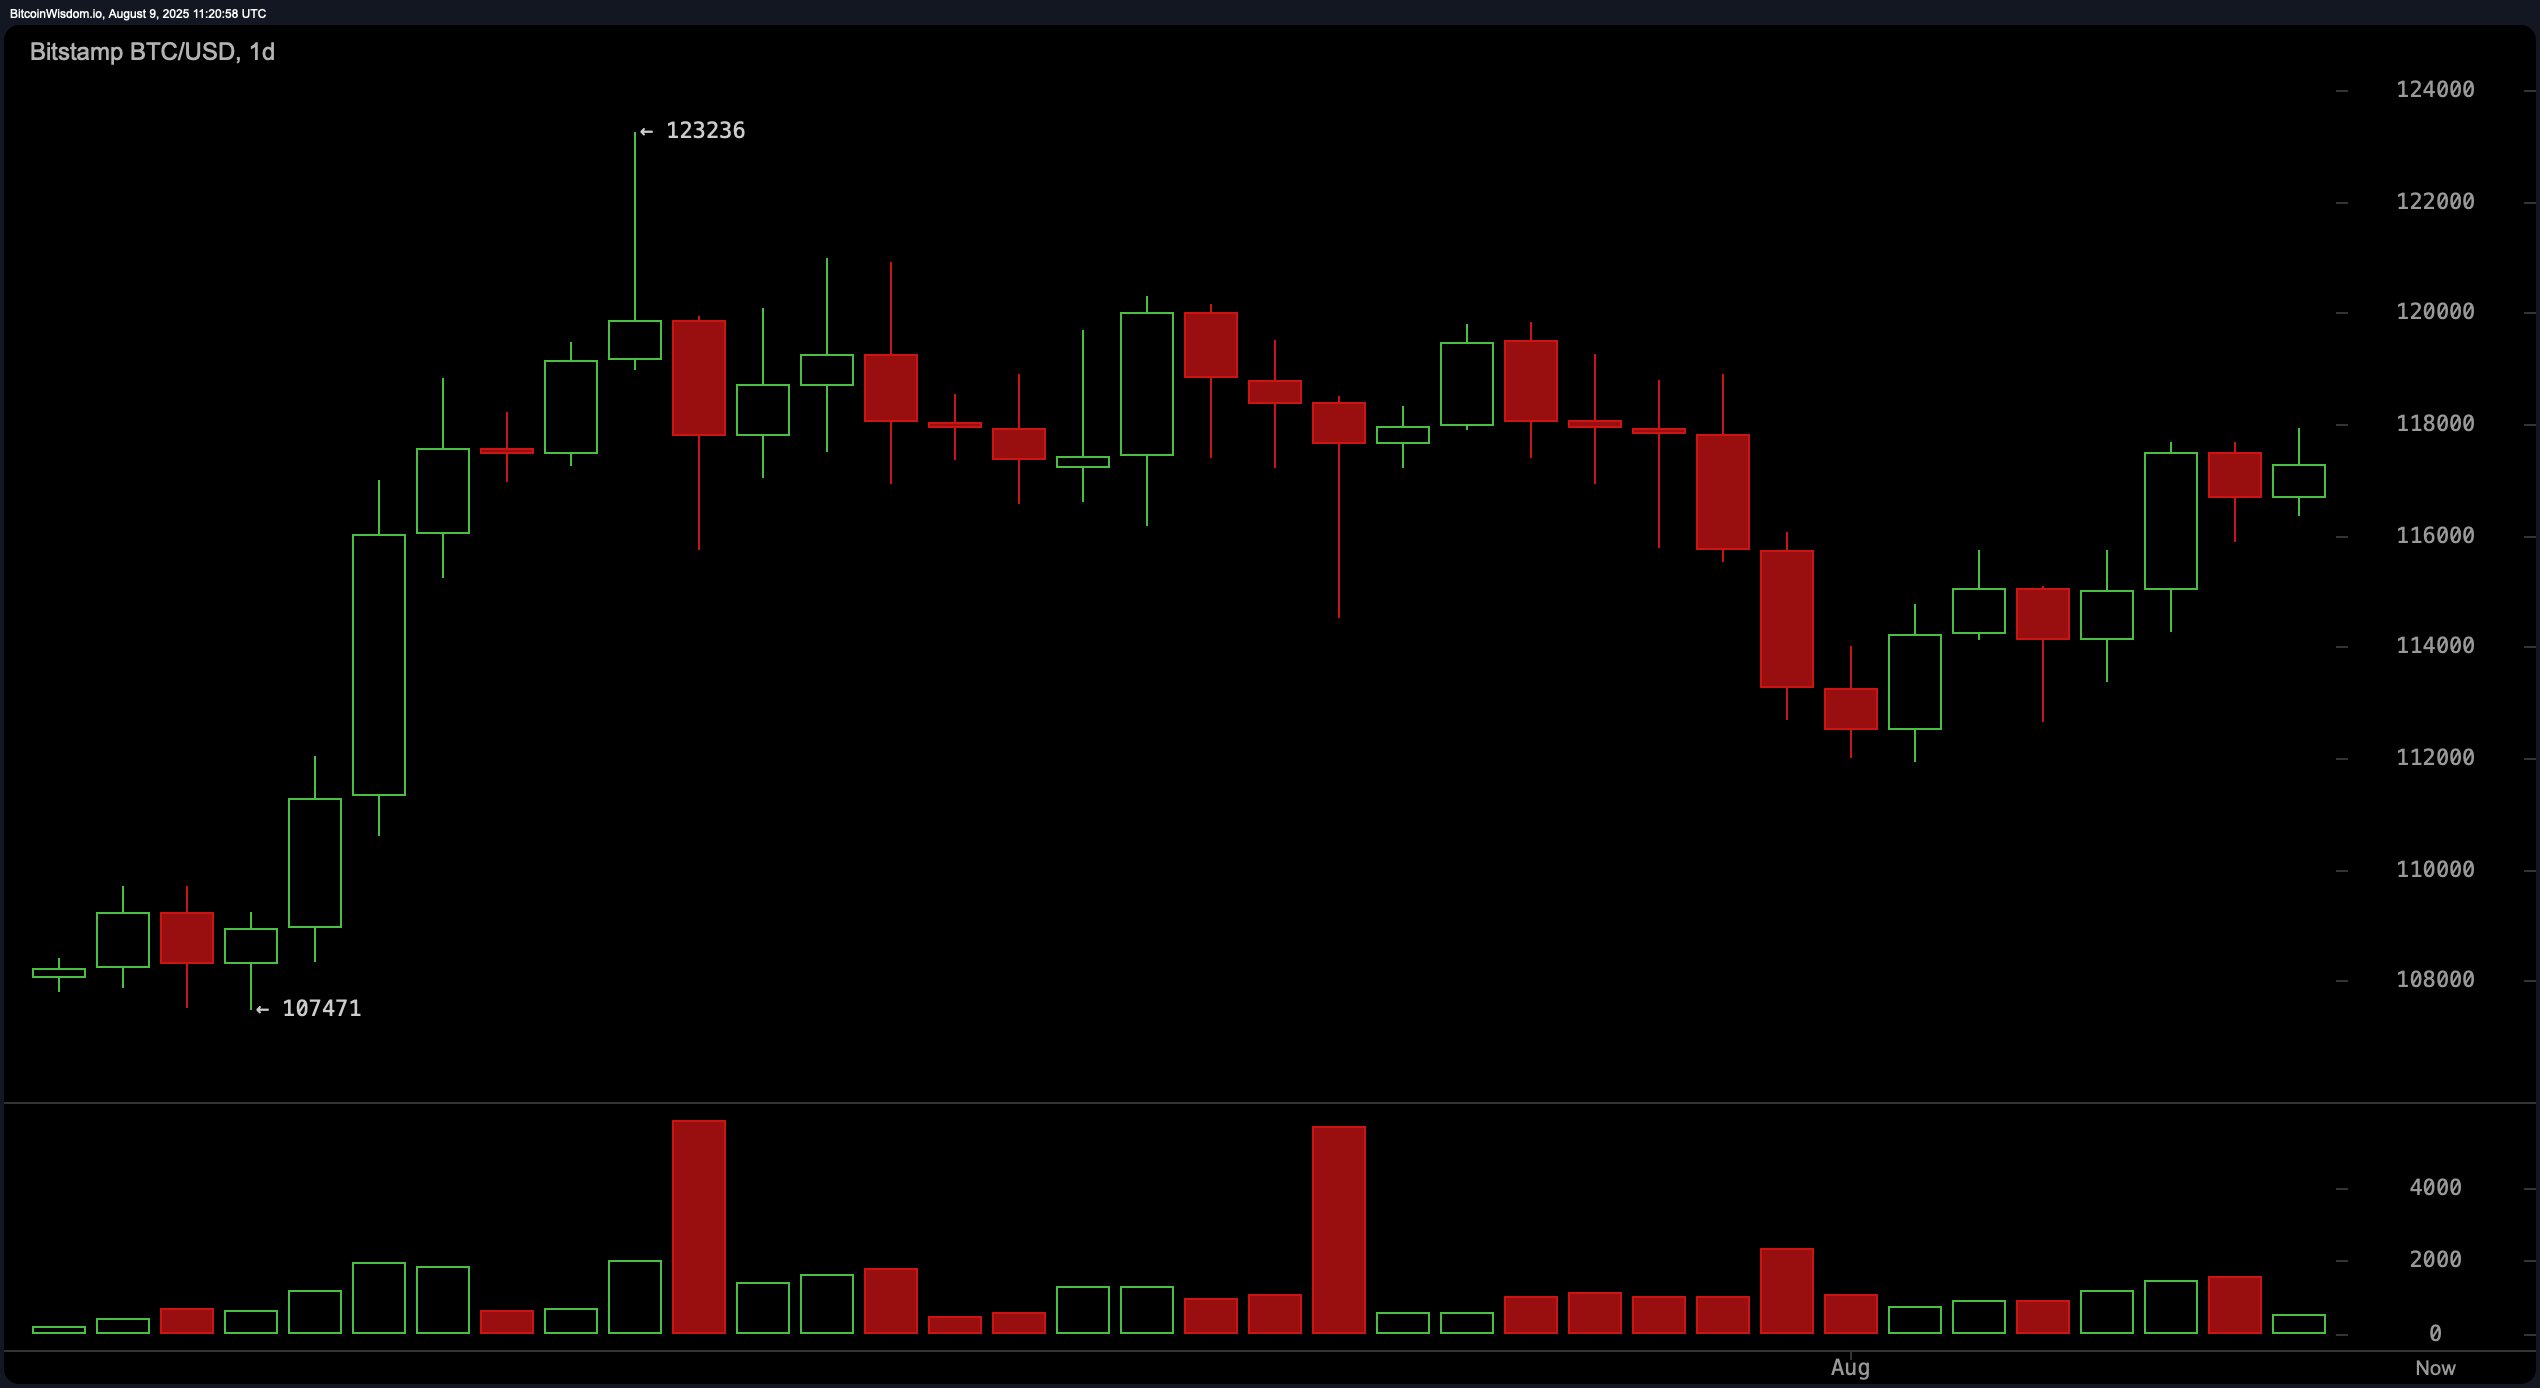
In the daily chart, bitcoin has rebounded from a recent pullback after peaking near $123,236, finding notable support in the $112,000 range. Resistance is clustered between $118,000 and $118,500, where selling pressure has repeatedly emerged. Trading volume spikes during sell-offs suggest that dips are attracting buyers, providing stability to the price floor. Short-term momentum has turned bullish after reclaiming the mid-$117,000 level, though the asset remains confined to a broader consolidation pattern. A sustained close above $118,500 could open the door to higher levels, but rejection at this area may keep bitcoin locked in range-bound trading.

BTC/USD 1-day chart via Bitstamp on Aug. 9, 2025.
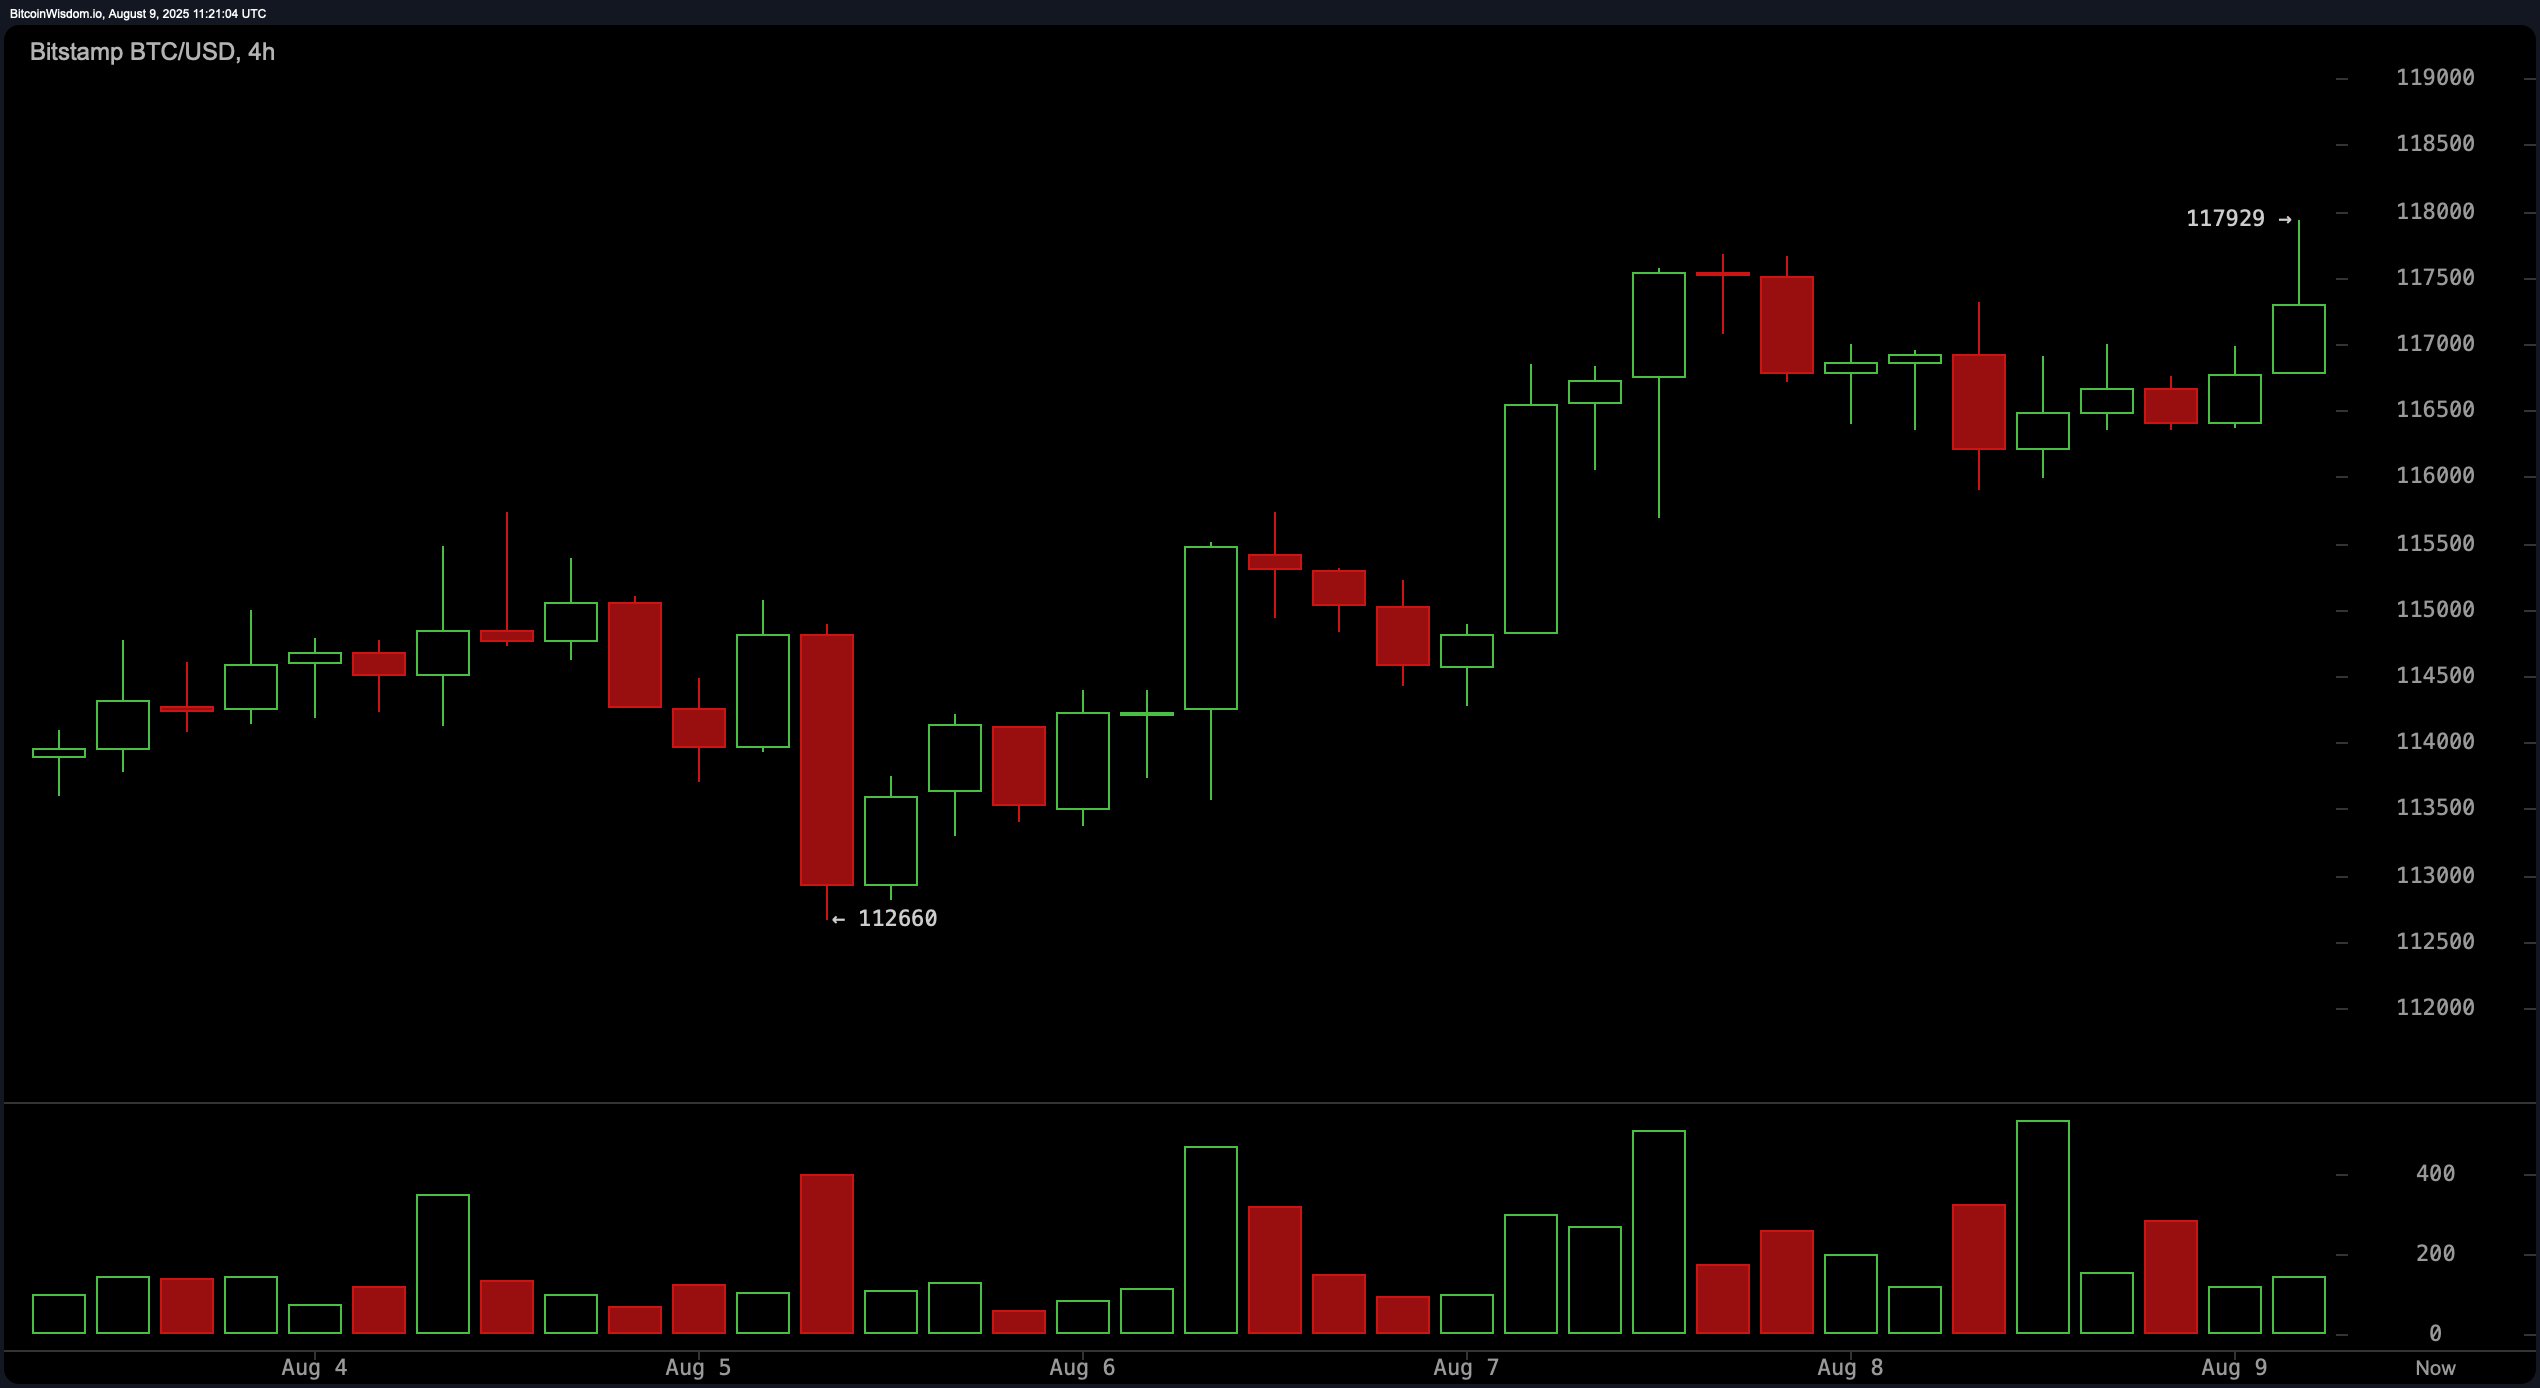
On the 4-hour chart, bitcoin has maintained a steady ascent since August 5, when prices briefly touched $112,660. The formation of higher highs and higher lows points to a healthy bullish structure, with $116,000 serving as a critical support level. Rejections around $118,000 to $118,200 indicate that sellers remain active, yet buying momentum on pullbacks has been consistent. Trading volume on this timeframe supports the accumulation thesis, and near-term sentiment remains positive unless price action closes decisively below $116,000. Traders may see strategic entry opportunities near this support zone, aiming for short-term targets just below key resistance.

BTC/USD 4-hour chart via Bitstamp on Aug. 9, 2025.
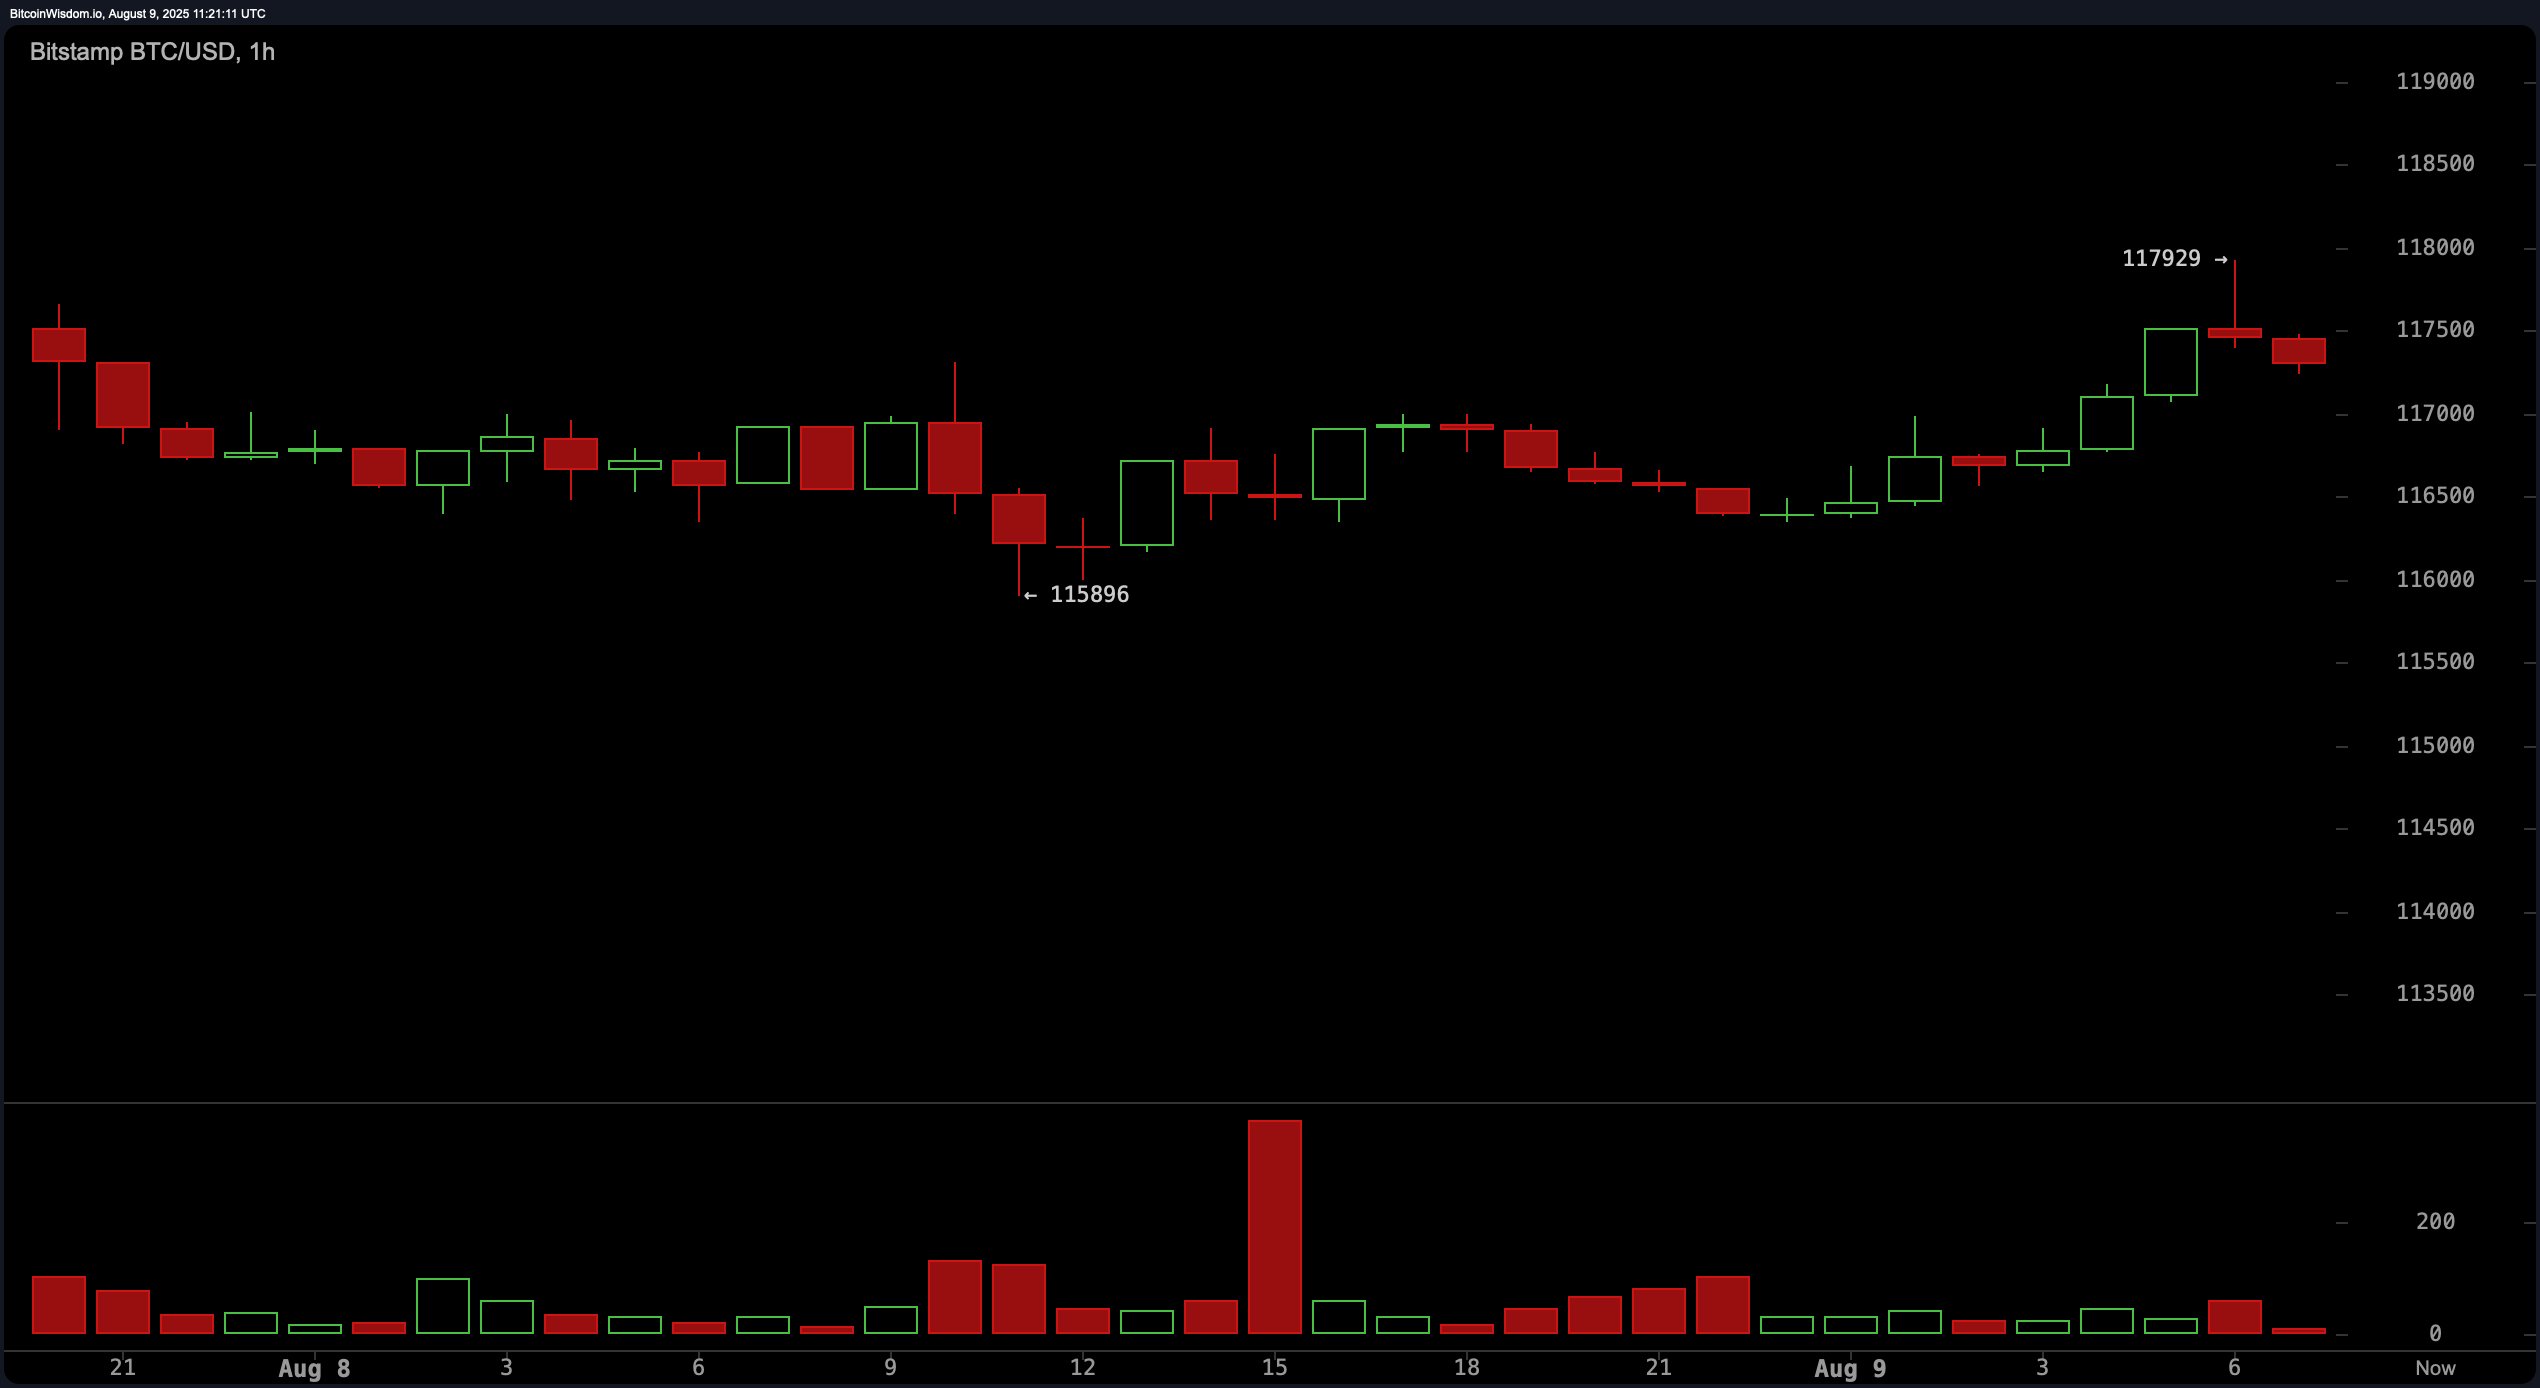
The hourly bitcoin chart reflects a more subdued environment, with BTC trading sideways but tilting slightly upward. A recent push to $117,929 faced swift rejection, reinforcing the $118,000 ceiling. Micro support has formed between $116,800 and $117,000, with low volume suggesting market indecision at these levels. Price action appears confined to a tight range, favoring short-term scalping strategies where entries are taken at support and exits at resistance. A confirmed breakout above $118,000 could provide the momentum needed for a push higher, while a breakdown may retest lower 1-hour support zones.

BTC/USD 1-hour chart via Bitstamp on Aug. 9, 2025.
Oscillators show a largely neutral stance. The relative strength index (RSI) stands at 56, stochastic at 66, and commodity channel index (CCI) at 23—all neutral readings. The average directional index (ADX) at 16 also points to a lack of strong trend momentum. The awesome oscillator is slightly negative at −721 but neutral in bias, while momentum at −538 issues a bullish signal. Notably, the moving average convergence divergence (MACD) level at 411 issues a bearish signal, suggesting mixed signals in shorter-term momentum versus trend continuation.
Moving averages (MAs) overwhelmingly support a bullish bias. The exponential moving average (EMA) 10 at $116,127 and simple moving average (SMA) 10 at $115,144 both signal positivity, as do the EMA 20 at $116,029, SMA 20 at $116,747, and EMA 30 at $115,436. Longer-term indicators are similarly positive, with the SMA 30 at $117,268, EMA 50 at $113,593, SMA 50 at $113,430, EMA 100 at $108,808, SMA 100 at $109,042, EMA 200 at $101,501, and SMA 200 at $99,669—all producing bullish signals. This alignment across multiple timeframes suggests that the broader trend remains upward, even as shorter-term conditions indicate consolidation.
Bull Verdict:
Bitcoin’s multi-timeframe moving averages, coupled with its consistent pattern of higher highs and higher lows on the 4-hour chart, suggest that the broader trend remains intact to the upside. If the $118,500 resistance is broken and confirmed as support, momentum could accelerate toward the $120,000 level and beyond.
Bear Verdict:
Despite underlying trend strength, persistent resistance at $118,000–$118,500 and neutral oscillator readings signal that upside progress is stalling. A break below $116,000 on higher timeframes could shift momentum toward $114,000 or lower, putting recent gains at risk.
免责声明:本文章仅代表作者个人观点,不代表本平台的立场和观点。本文章仅供信息分享,不构成对任何人的任何投资建议。用户与作者之间的任何争议,与本平台无关。如网页中刊载的文章或图片涉及侵权,请提供相关的权利证明和身份证明发送邮件到support@aicoin.com,本平台相关工作人员将会进行核查。


