Original Title: "Which Cryptocurrency Exchanges Are About to Go Public in the U.S. Stock Market, and What Are Their Valuations?"
Original Authors: Tanay Ved, Victor Ramirez, Coin Metrics
Original Translation: AididiaoJP, Foresight News
Key Points:
- With a favorable regulatory environment and clear investor interest in public market exposure to crypto assets, Kraken, Gemini, and Bullish are planning initial public offerings (IPOs).
- Coinbase's IPO in 2021 set a benchmark for the industry. At the time of its listing, Coinbase was valued at $65 billion, with 96% of its revenue coming from trading fees, while subscription and service revenue accounted for 44% by Q2 2025.
- Among the IPO candidates, Coinbase still leads with 49% of spot trading volume. Bullish and Kraken each account for 22% and are rapidly expanding new services.
- Not all reported trading volumes hold equal value. Analysis of round-trip trading reveals inflated activity on some platforms and underscores the need to assess the quality and transparency of exchanges.
Introduction
Throughout the history of the cryptocurrency industry, the U.S. government's attitude has often been lukewarm, if not hostile. However, last week saw a positive shift.
The President's Working Group on Digital Assets released a 166-page report outlining the current state of digital assets and proposing policy recommendations for establishing a comprehensive market structure. Meanwhile, SEC Chairman Gary Gensler announced the "Crypto Projects" initiative in a public speech, aiming to make the U.S. the "global crypto capital" by bringing financial markets on-chain, simplifying the cumbersome licensing regime for cryptocurrency businesses, and supporting the creation of financial "super apps" that offer a variety of services.
The primary beneficiaries of this new regulatory framework are centralized exchanges. Several private centralized exchanges, such as Kraken, Bullish, and Gemini, are seeking to take advantage of this relatively favorable environment to pursue IPOs. As these companies open up to public investment, it is essential for investors to understand their fundamental drivers. In this article, we will delve into the key metrics of these exchanges and highlight some considerations when using exchange-reported data.
The IPO Frenzy of Cryptocurrency Exchanges
Since Coinbase's IPO in April 2021, there have been very few IPOs related to the crypto industry over the past four years, primarily due to the adversarial relationship between cryptocurrency companies and the former SEC. As a result, private companies have been unable to gain liquidity from public markets, and non-accredited investors have not been able to profit from investing in these companies. With the Trump administration's commitment to a more favorable regulatory regime, a new wave of private cryptocurrency companies has announced plans to go public.
This environment, combined with renewed investor interest in public market exposure to crypto, has given rise to some of the most explosive IPOs, such as Circle's recent public offering. Gemini, Bullish, and Kraken plan to list in the U.S., hoping to seize this opportunity to position themselves as full-stack service providers for digital assets.
Coinbase's 2021 IPO
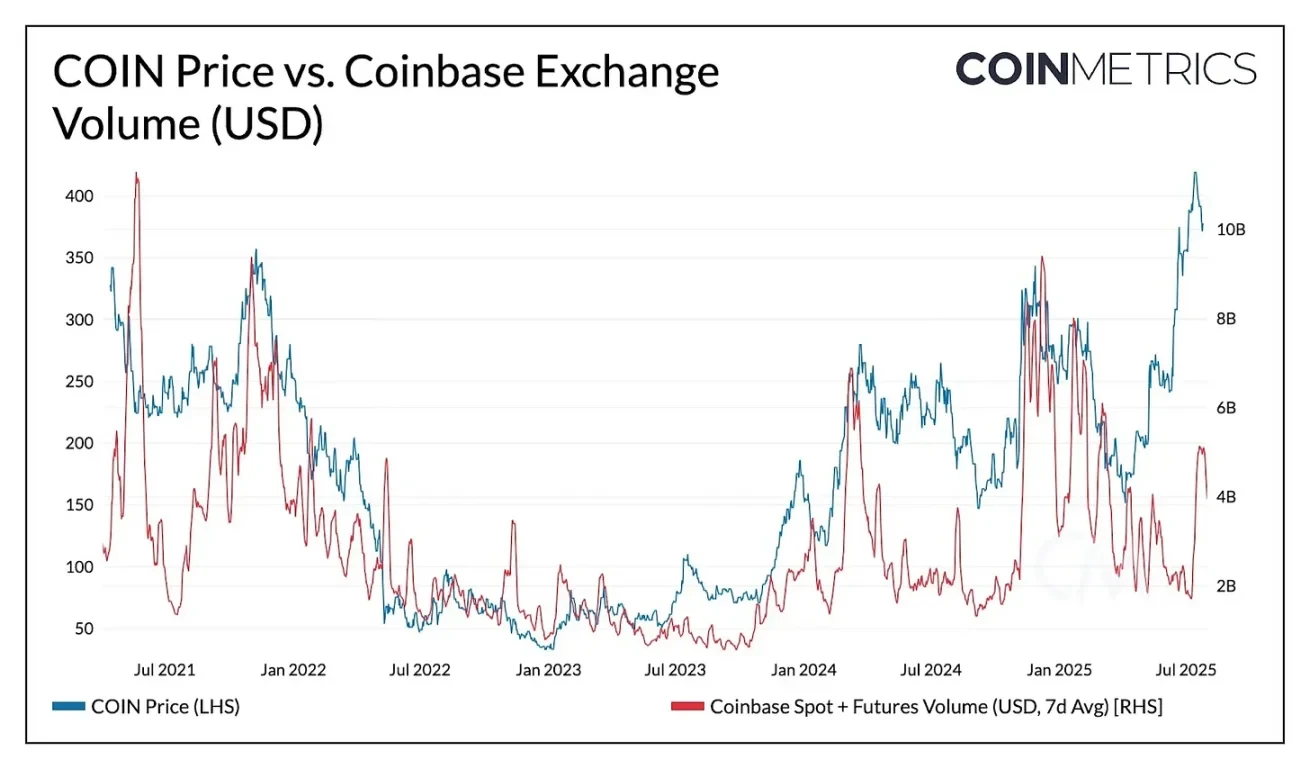
Coinbase's IPO in 2021 provides a useful benchmark for assessing the investment prospects of potential exchange IPOs. The company went public on April 14, 2021, through a direct listing on Nasdaq, with a reference price of $250 per share and a fully diluted valuation of $65 billion, opening at $381. Coinbase's listing coincided with the peak of the 2021 bull market, when Bitcoin prices were nearing $64,000 and exchange trading volumes exceeded $10 billion.
According to its S-1 filing, Coinbase's business model at the time was quite simple, with most revenue coming from trading fees:
"From our inception until December 31, 2020, we generated over $3.4 billion in total revenue, primarily from retail and institutional users based on trading volume on our platform. As of December 31, 2020, trading revenue accounted for over 96% of our net revenue. We leverage the advantages of our trading business to expand and broaden our platform, launching new products and services through an investment flywheel and expanding our ecosystem."
Source: Coin Metrics Market Data Pro and Google Finance
Today, Coinbase resembles a "full-stack exchange." While trading remains its core business, its business model has significantly expanded into the full-stack realm of cryptocurrency services. This change is beginning to reflect in the relationship between COIN price and trading volume, which were closely correlated in the early days, but as the importance of "subscription and service revenue" (including stablecoin income (USDC interest income), blockchain rewards (staking), custody income, etc.) has increased, this correlation has weakened:
Coinbase Q1 2021:
- Revenue: $1.6 billion
- Trading Revenue: $1.55 billion (96%)
- Subscription and Service Revenue: $56 million (4%)
Coinbase Q2 2025:
- Revenue: $1.5 billion
- Trading Revenue: $764 million (51%)
- Subscription and Service Revenue: $656 million (44%)
- Enterprise Interest Income: $77 million (5%)
Comparative Analysis of Upcoming IPO Exchanges
Based on this framework, we have listed estimated data on the valuations, trading volumes, and business areas of exchanges that are about to go public.
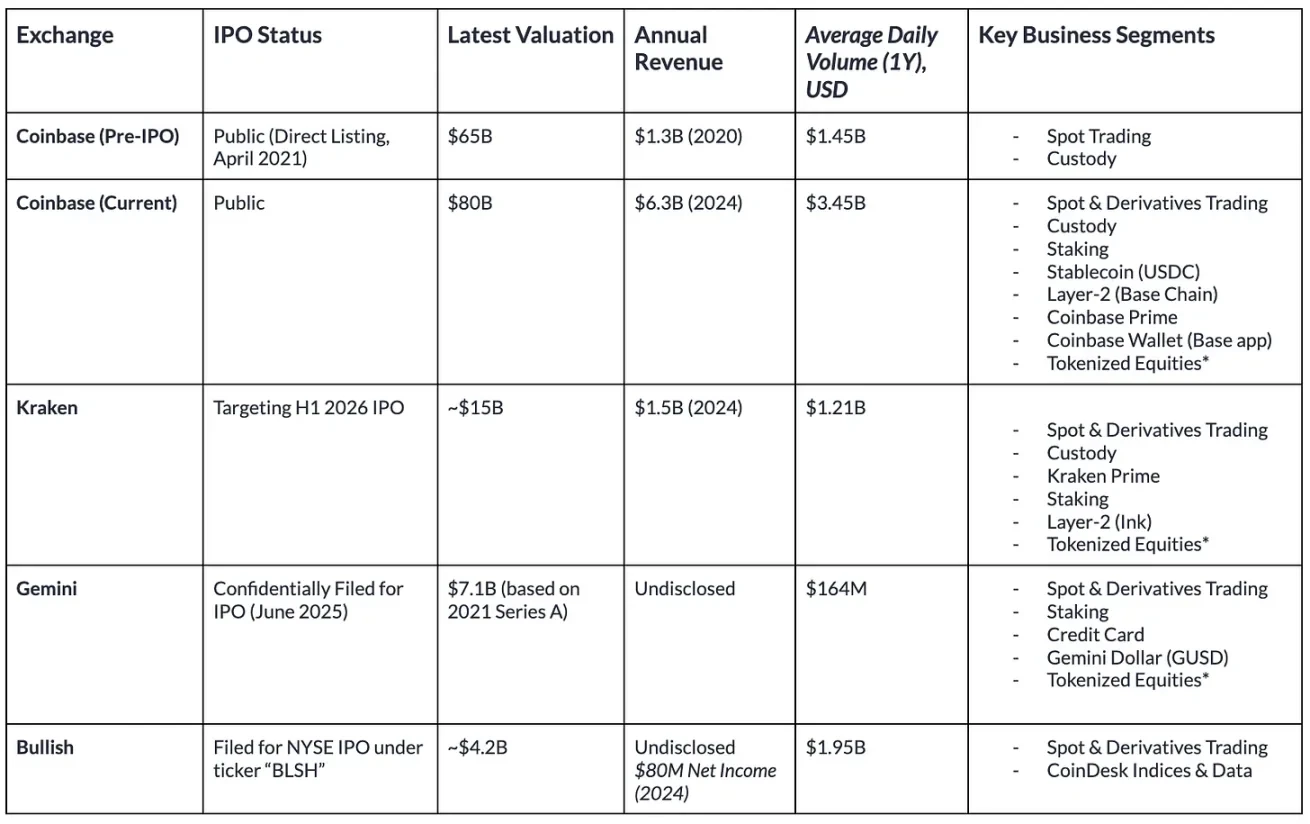
Source: Coin Metrics Market Data Pro and public company filings (data as of August 1, 2025)
Although the services offered by these exchanges tend to be consistent, there are significant differences in their market influence and the scale of trading activity.
Kraken, founded in 2013, has reached a more mature stage. The company has shown strong financial growth, with projected revenue of $1.5 billion in 2024 (a 128% increase from 2023) and $412 million in Q2 2025. Kraken is also strategically expanding into areas such as acquiring NinjaTrader, obtaining European MiCA licensing, and tokenized stocks, payments, and on-chain infrastructure (Ink). Its target valuation is approximately $15 billion, with a revenue multiple of 10 times, slightly lower than Coinbase's 12.7 times.
In contrast, Gemini is smaller in scale. Its average trading volume over the past year is $164 million, the lowest among these exchanges. Gemini's latest valuation dates back to its Series A funding in 2021 at $7.1 billion, with private market estimates at $8 billion. In addition to spot and derivatives trading, Gemini also offers staking and credit card products, providing yield on user deposits, and is the issuer of the Gemini Dollar (GUSD), although its circulating supply has dropped to $54 million.
Bullish ranks high in trading activity, with an average trading volume of $1.95 billion over the past year. Bullish Exchange is at the core of its trading and liquidity infrastructure, focusing on institutional clients and regulated in Germany, Hong Kong, and Gibraltar, while actively seeking U.S. licensing. Additionally, Bullish has expanded into information services through the acquisition of CoinDesk. According to its F-1 filing, the company has a projected net profit of $80 million in 2024, with a net loss of $349 million. Based on a canceled SPAC deal in 2022, its initial valuation was close to $9 billion, and it is currently reported to be seeking a valuation of $4.2 billion.
Trends in Exchange Trading Volume
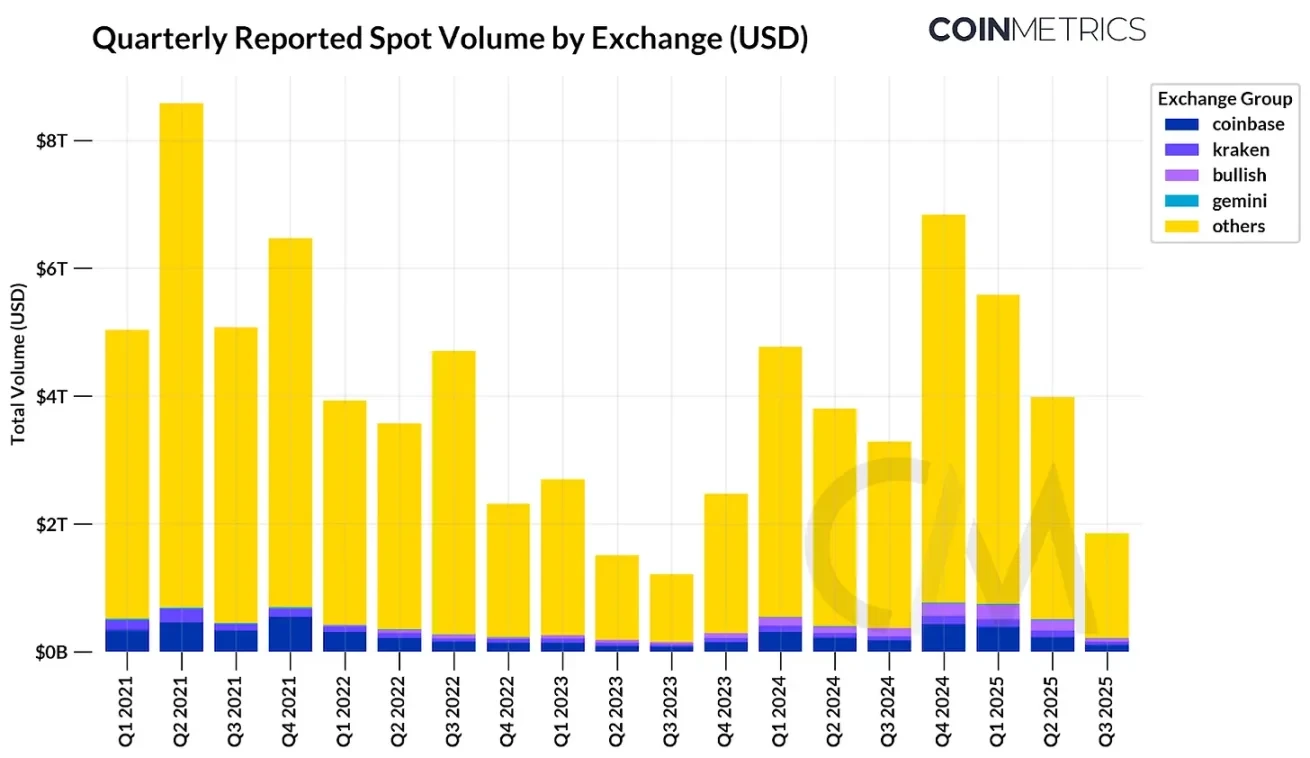
Source: Coin Metrics Market Data Pro
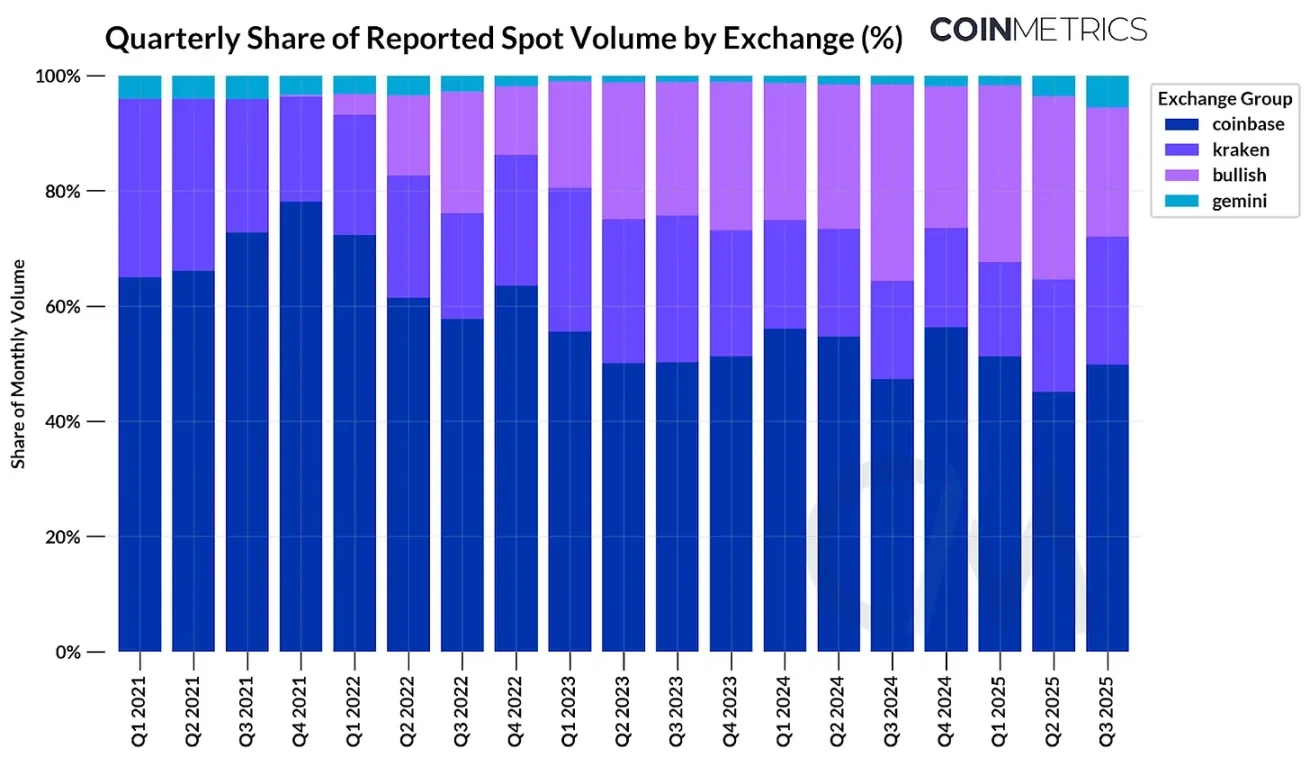
Overall, Coinbase and other upcoming IPO exchanges account for only about 11.6% of the reported spot trading volume of centralized exchanges. Binance alone accounts for 39%, while other offshore exchanges also hold significant shares. Among the exchanges of interest, Coinbase accounts for 49% of spot trading volume, while Bullish and Kraken each account for 22%. Since its launch in 2022, Bullish's share has steadily increased, while Kraken's market share has slightly decreased amid intensifying competition.
Trading on the Order Book: Analyzing Exchange Economic Activity
As mentioned, trading volume is one of the most predictive indicators for estimating valuations. However, reported trading volumes can vary by exchange, becoming a potentially misleading data point.
While most major cryptocurrency exchanges have cracked down on wash trading, some irregularities still exist. Our Trusted Exchange Framework approach details how to detect anomalous trading activity and assesses qualitative factors such as regulatory compliance.
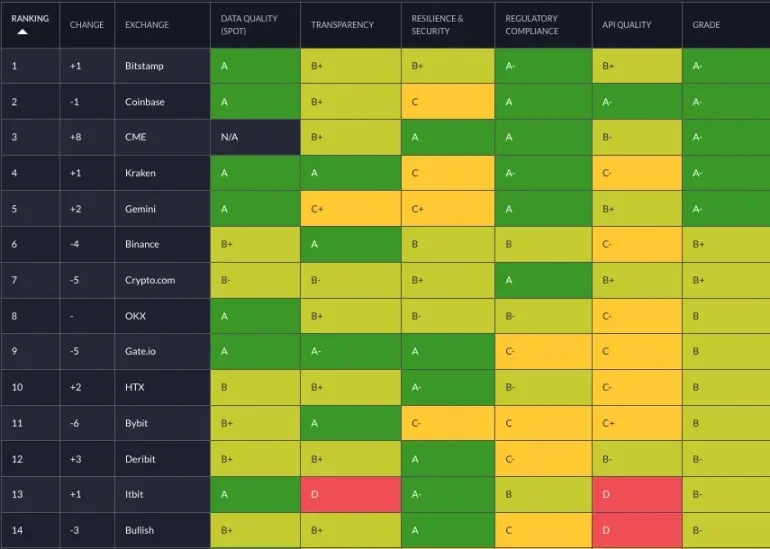
Source: Trusted Exchange Framework
A more robust signal we developed for detecting wash trading is calculating the frequency of repeat trades. Our testing methodology is as follows:
- We randomly sampled 144 five-minute periods from January to June 2025, generating nearly 20 million trades.
- For each exchange and period, one trade was selected.
- If another trade occurred within 10 trades or 5 seconds, with the opposite direction, and nearly the same amount and price (<1%), the two trades were marked as repeat trades.
- This process was repeated for each trade. If a trade was already marked as a repeat trade, it was skipped.
- The volume of trades marked as repeat trades was calculated and divided by the total volume.
In the figure below, we plotted a sample of trades from a few exchanges over a period and marked suspected round-trip trades. Each gray dot represents a normal trade, while the green and red markers represent round-trip trades.
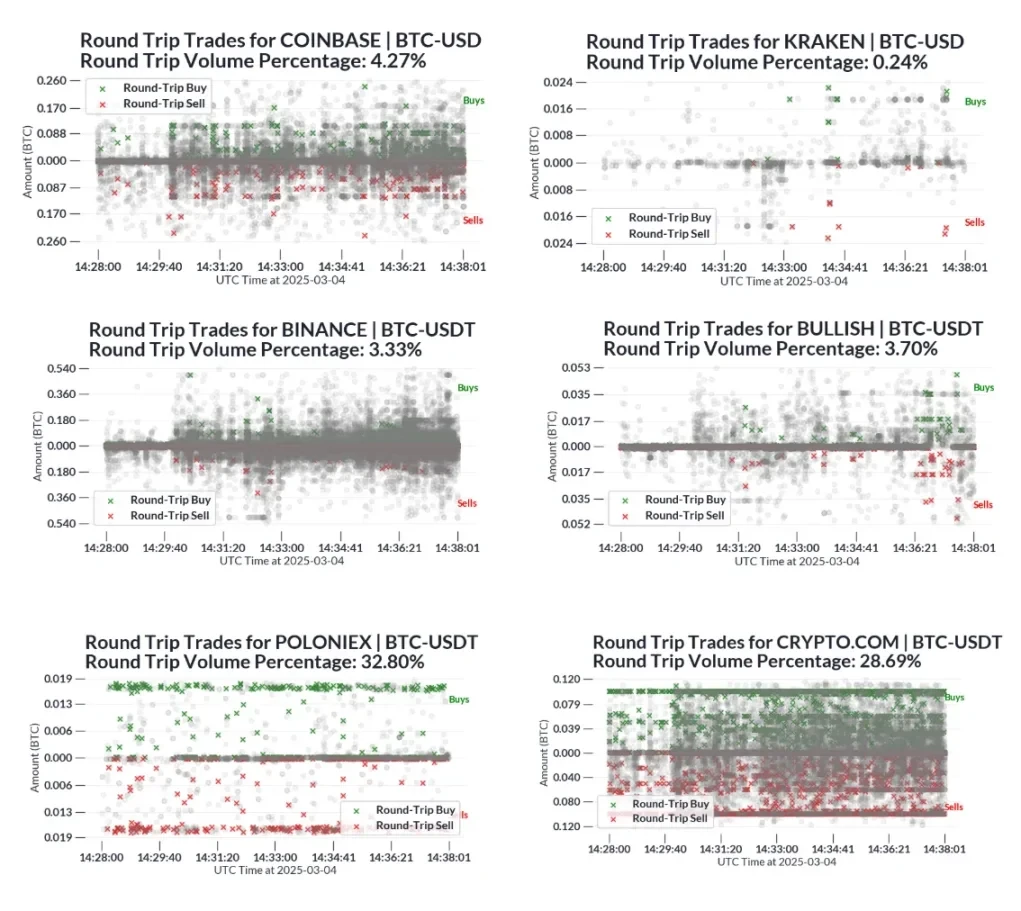
Source: Trusted Exchange Framework
Due to the approximations of this method, we expect some false positives, which are repeat trades caused by normal market activities (e.g., market makers facilitating trades by providing liquidity on both sides of the order book). However, compared to industry benchmarks like Crypto.com and Poloniex, the higher proportion of repeat trades raises concerns about the reliability of their reported trading volume data.
For example: from Q1 to Q2 2025, we estimated that Crypto.com’s trading volumes for BTC-USD ($201 billion), BTC-USDT ($192 billion), ETH-USD ($165 billion), and ETH-USDT ($160 billion) amounted to approximately $720 billion. Based on the estimated proportions mentioned above, about $160 billion of the trading volume in these pairs came from repeat trades.
Conclusion
As several cryptocurrency exchanges are about to go public, it is essential for investors to understand the relative trading volumes of these platforms. While trading volume helps estimate trading revenue (which still constitutes the majority of revenue), qualitative factors such as business diversification, the presence of repeat trades, and regulatory compliance are also important considerations in assessing the quality of exchanges. This information can assist market participants in determining whether valuations are reasonable.
Four years after its IPO, Coinbase remains in the lead, primarily due to its diversification in revenue sources such as custody, stablecoins, and Layer-2 fees. However, competition in the exchange market is intensifying. Other exchanges must diversify their revenue sources away from heavily market sentiment-dependent trading-related fees to compete. As the market structure becomes clearer, exchanges are allowed to evolve from trading venues into full-fledged super apps. How these exchanges seize this opportunity and whether they can realize their vision and replicate the success of past groundbreaking IPOs will be significant developments to watch in the coming year.
免责声明:本文章仅代表作者个人观点,不代表本平台的立场和观点。本文章仅供信息分享,不构成对任何人的任何投资建议。用户与作者之间的任何争议,与本平台无关。如网页中刊载的文章或图片涉及侵权,请提供相关的权利证明和身份证明发送邮件到support@aicoin.com,本平台相关工作人员将会进行核查。


