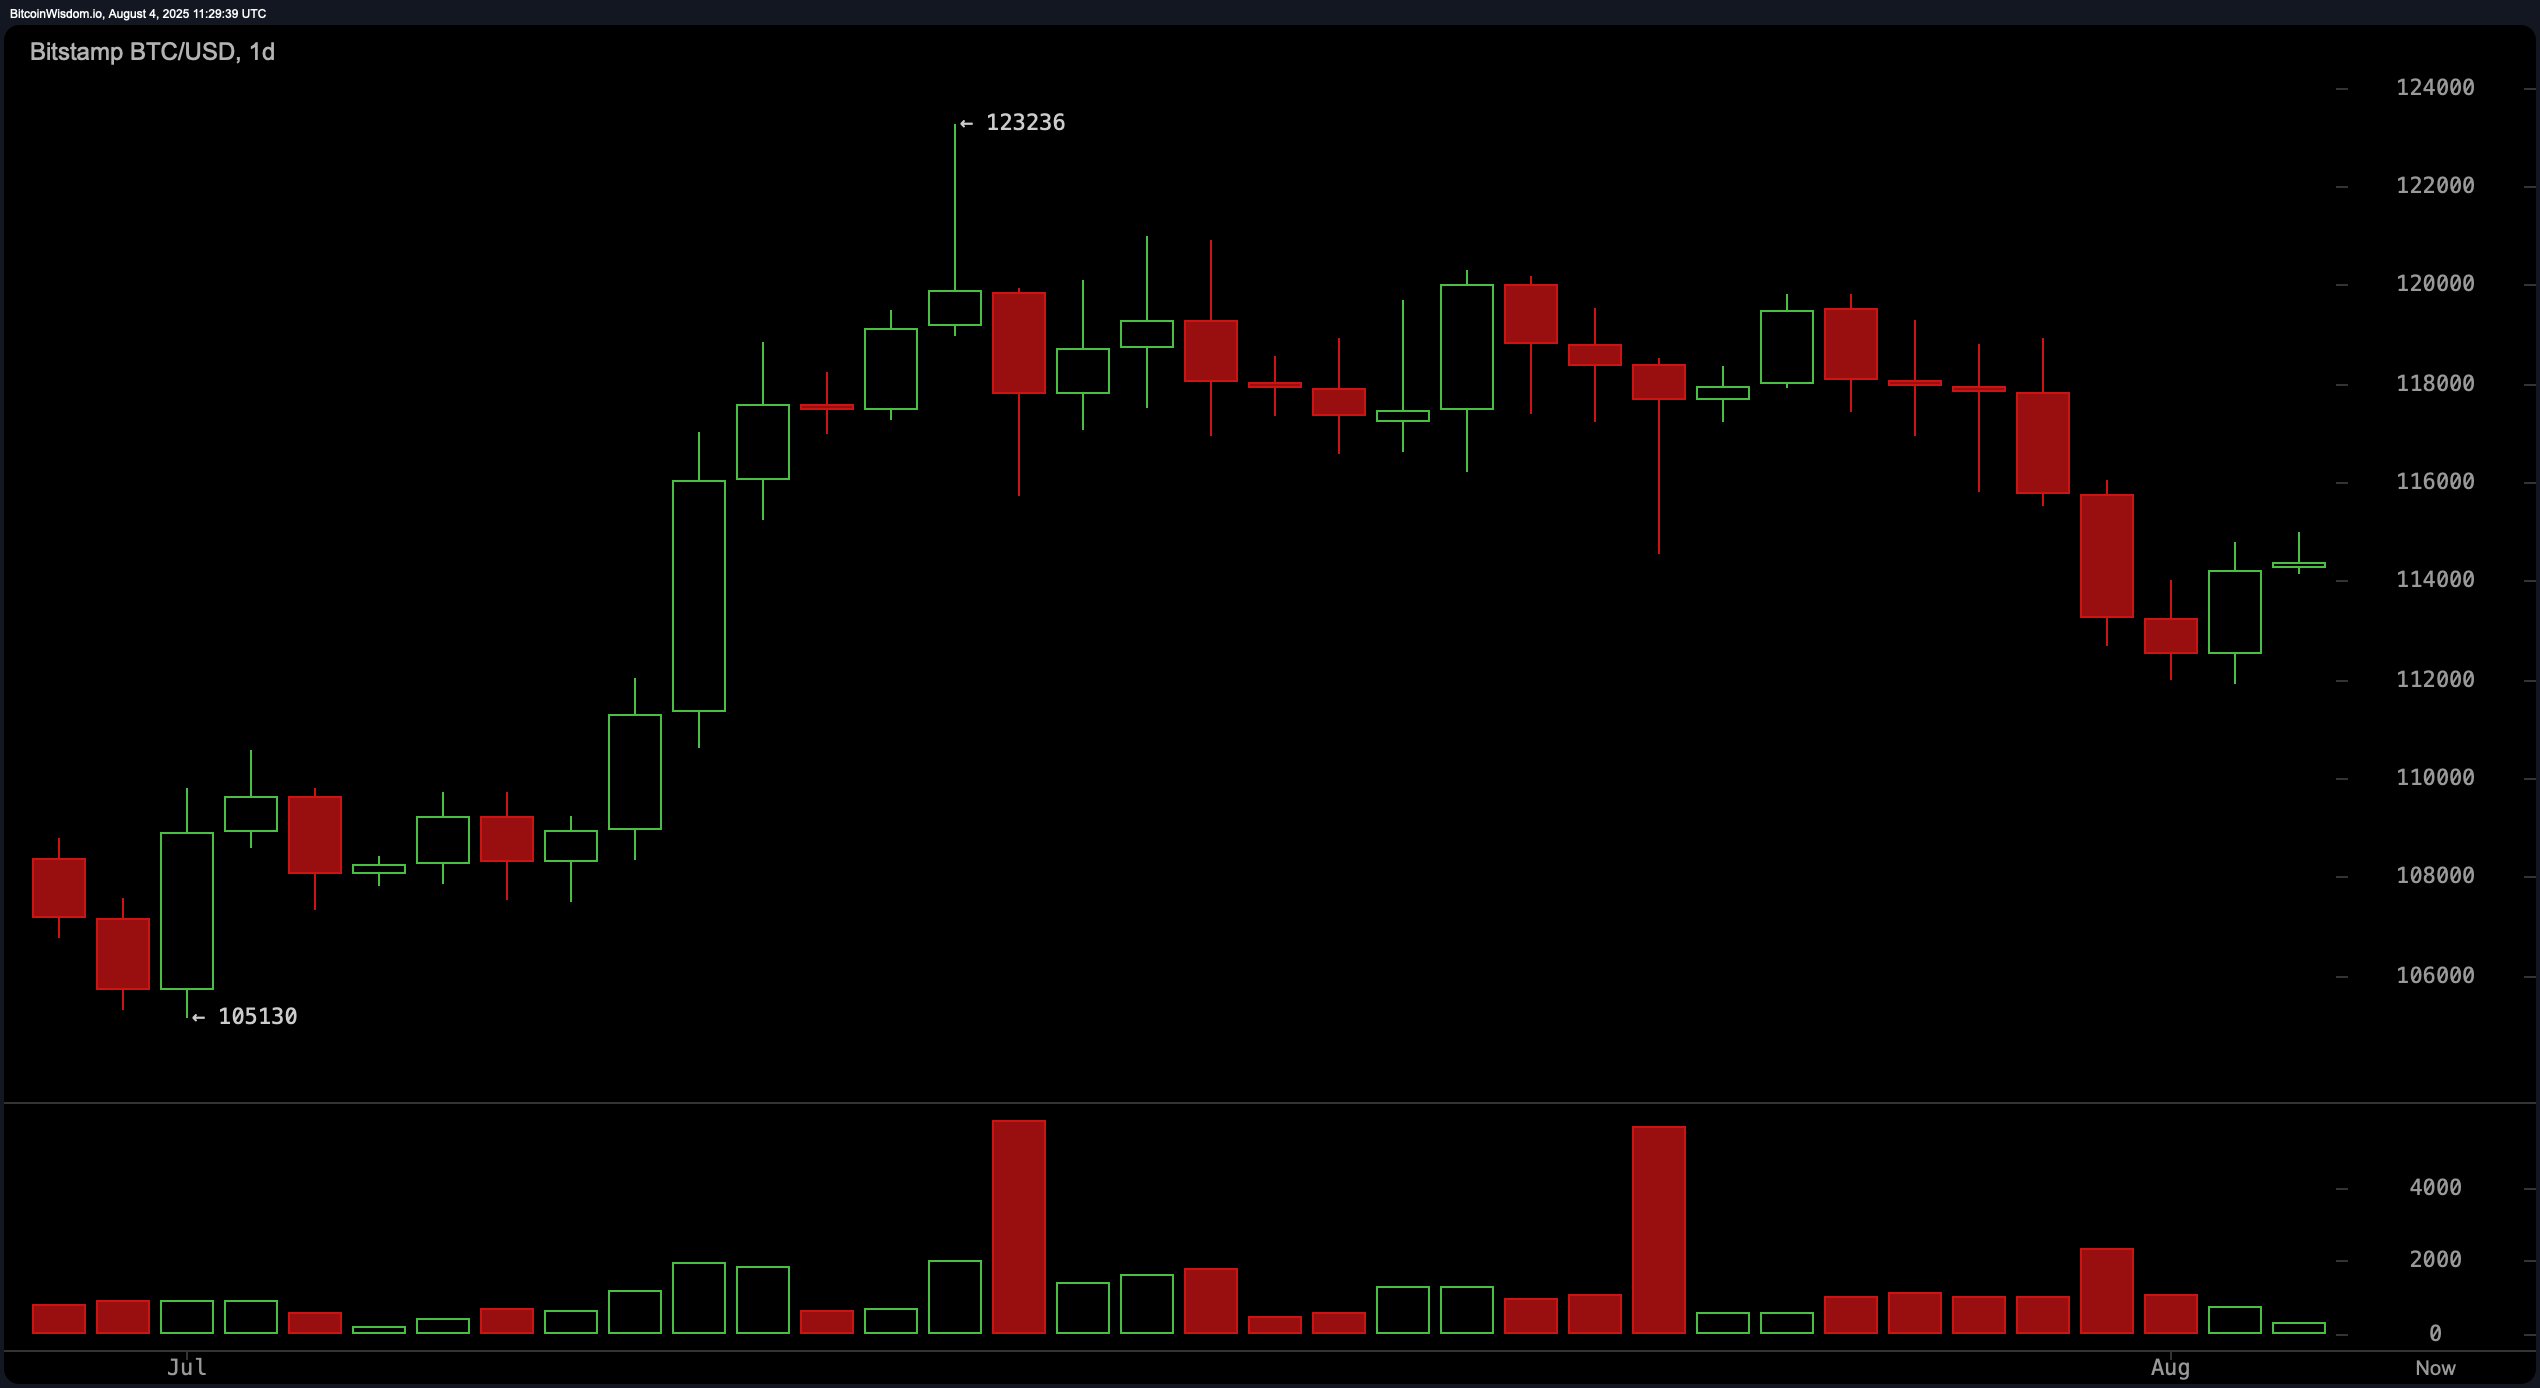
On the daily chart, bitcoin has transitioned from a strong bullish rally—rising from roughly $105,130 to about $123,236—into a corrective phase marked by lower highs and moderated buying activity. The recent decline toward the $114,000 level follows persistent but measured selling pressure. Support is currently observed near $112,000, with resistance positioned in the $118,000 to $120,000 range. This consolidation after a rally, combined with weakening momentum, suggests bulls will need to reclaim the upper resistance zone to reestablish control.

BTC/USD 1-day chart via Bitstamp on Aug. 4, 2025.
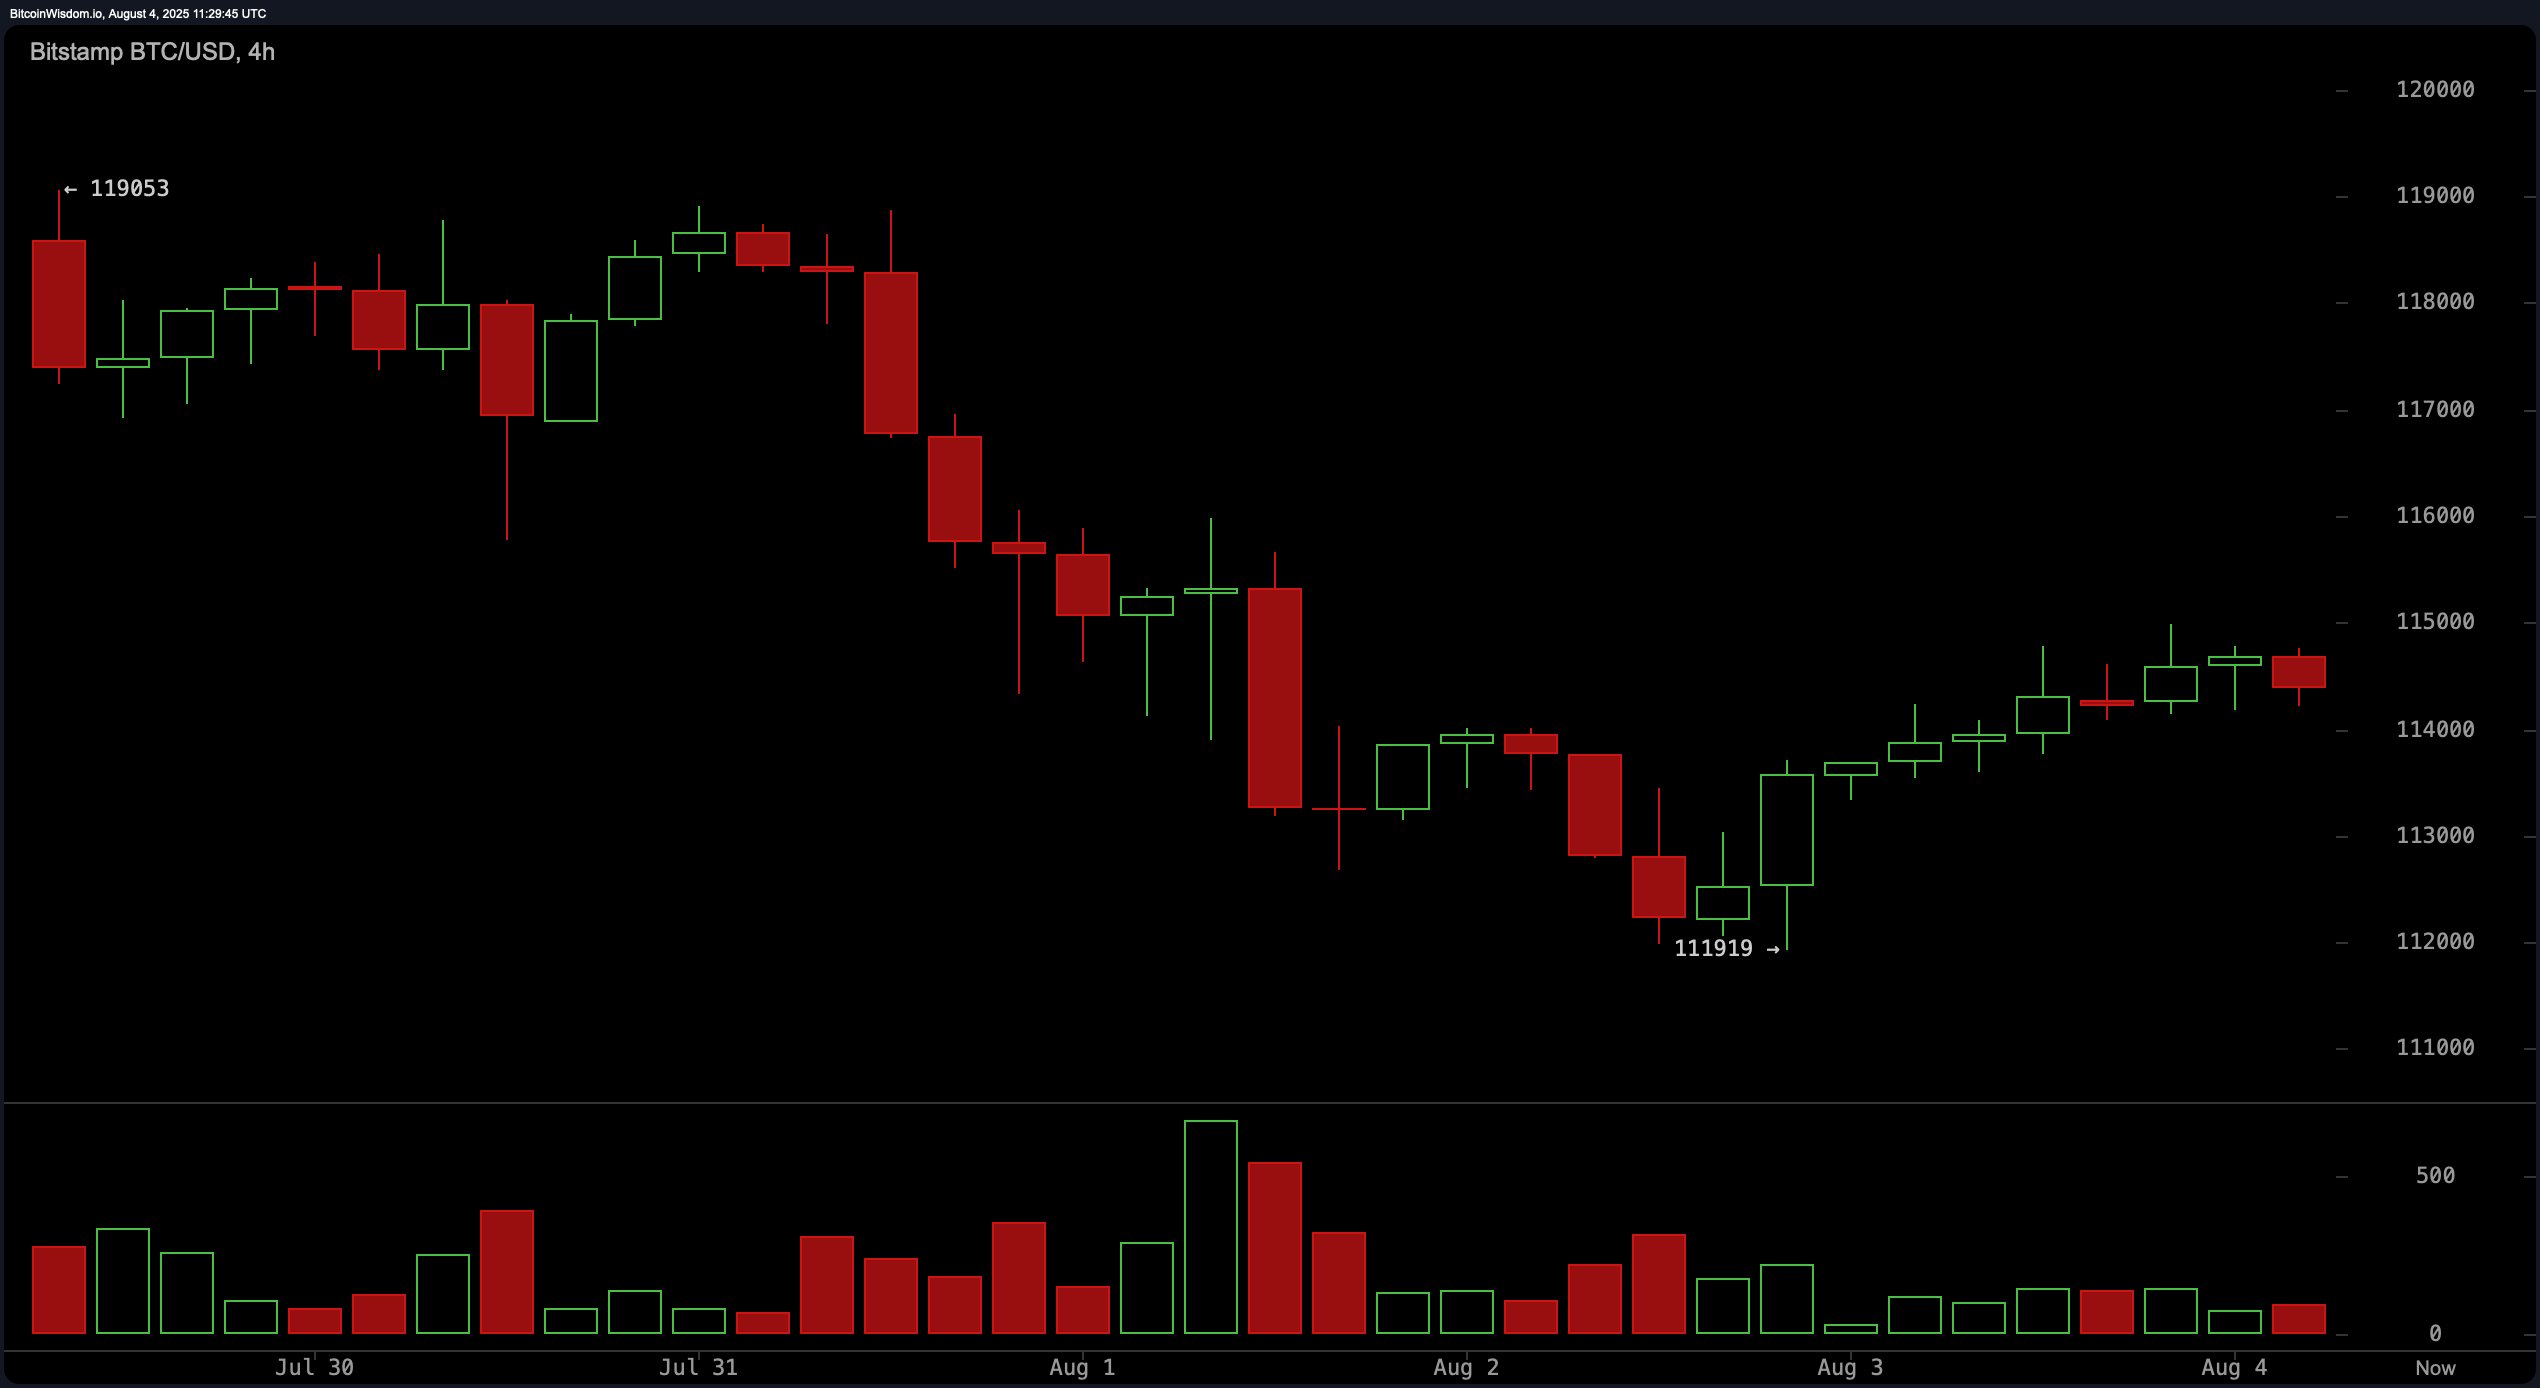
The 4-hour bitcoin chart reveals a sharper view of recent mid-term movements. Following a decline from approximately $119,000 to a low of $111,919, bitcoin has rebounded steadily. Short-term support lies near $113,000, while resistance is in the $115,500 to $116,000 range. The current rebound may be a relief rally; a failure to break above the noted resistance zone could invite another leg lower, particularly if selling volume accelerates.

BTC/USD 4-hour chart via Bitstamp on Aug. 4, 2025.
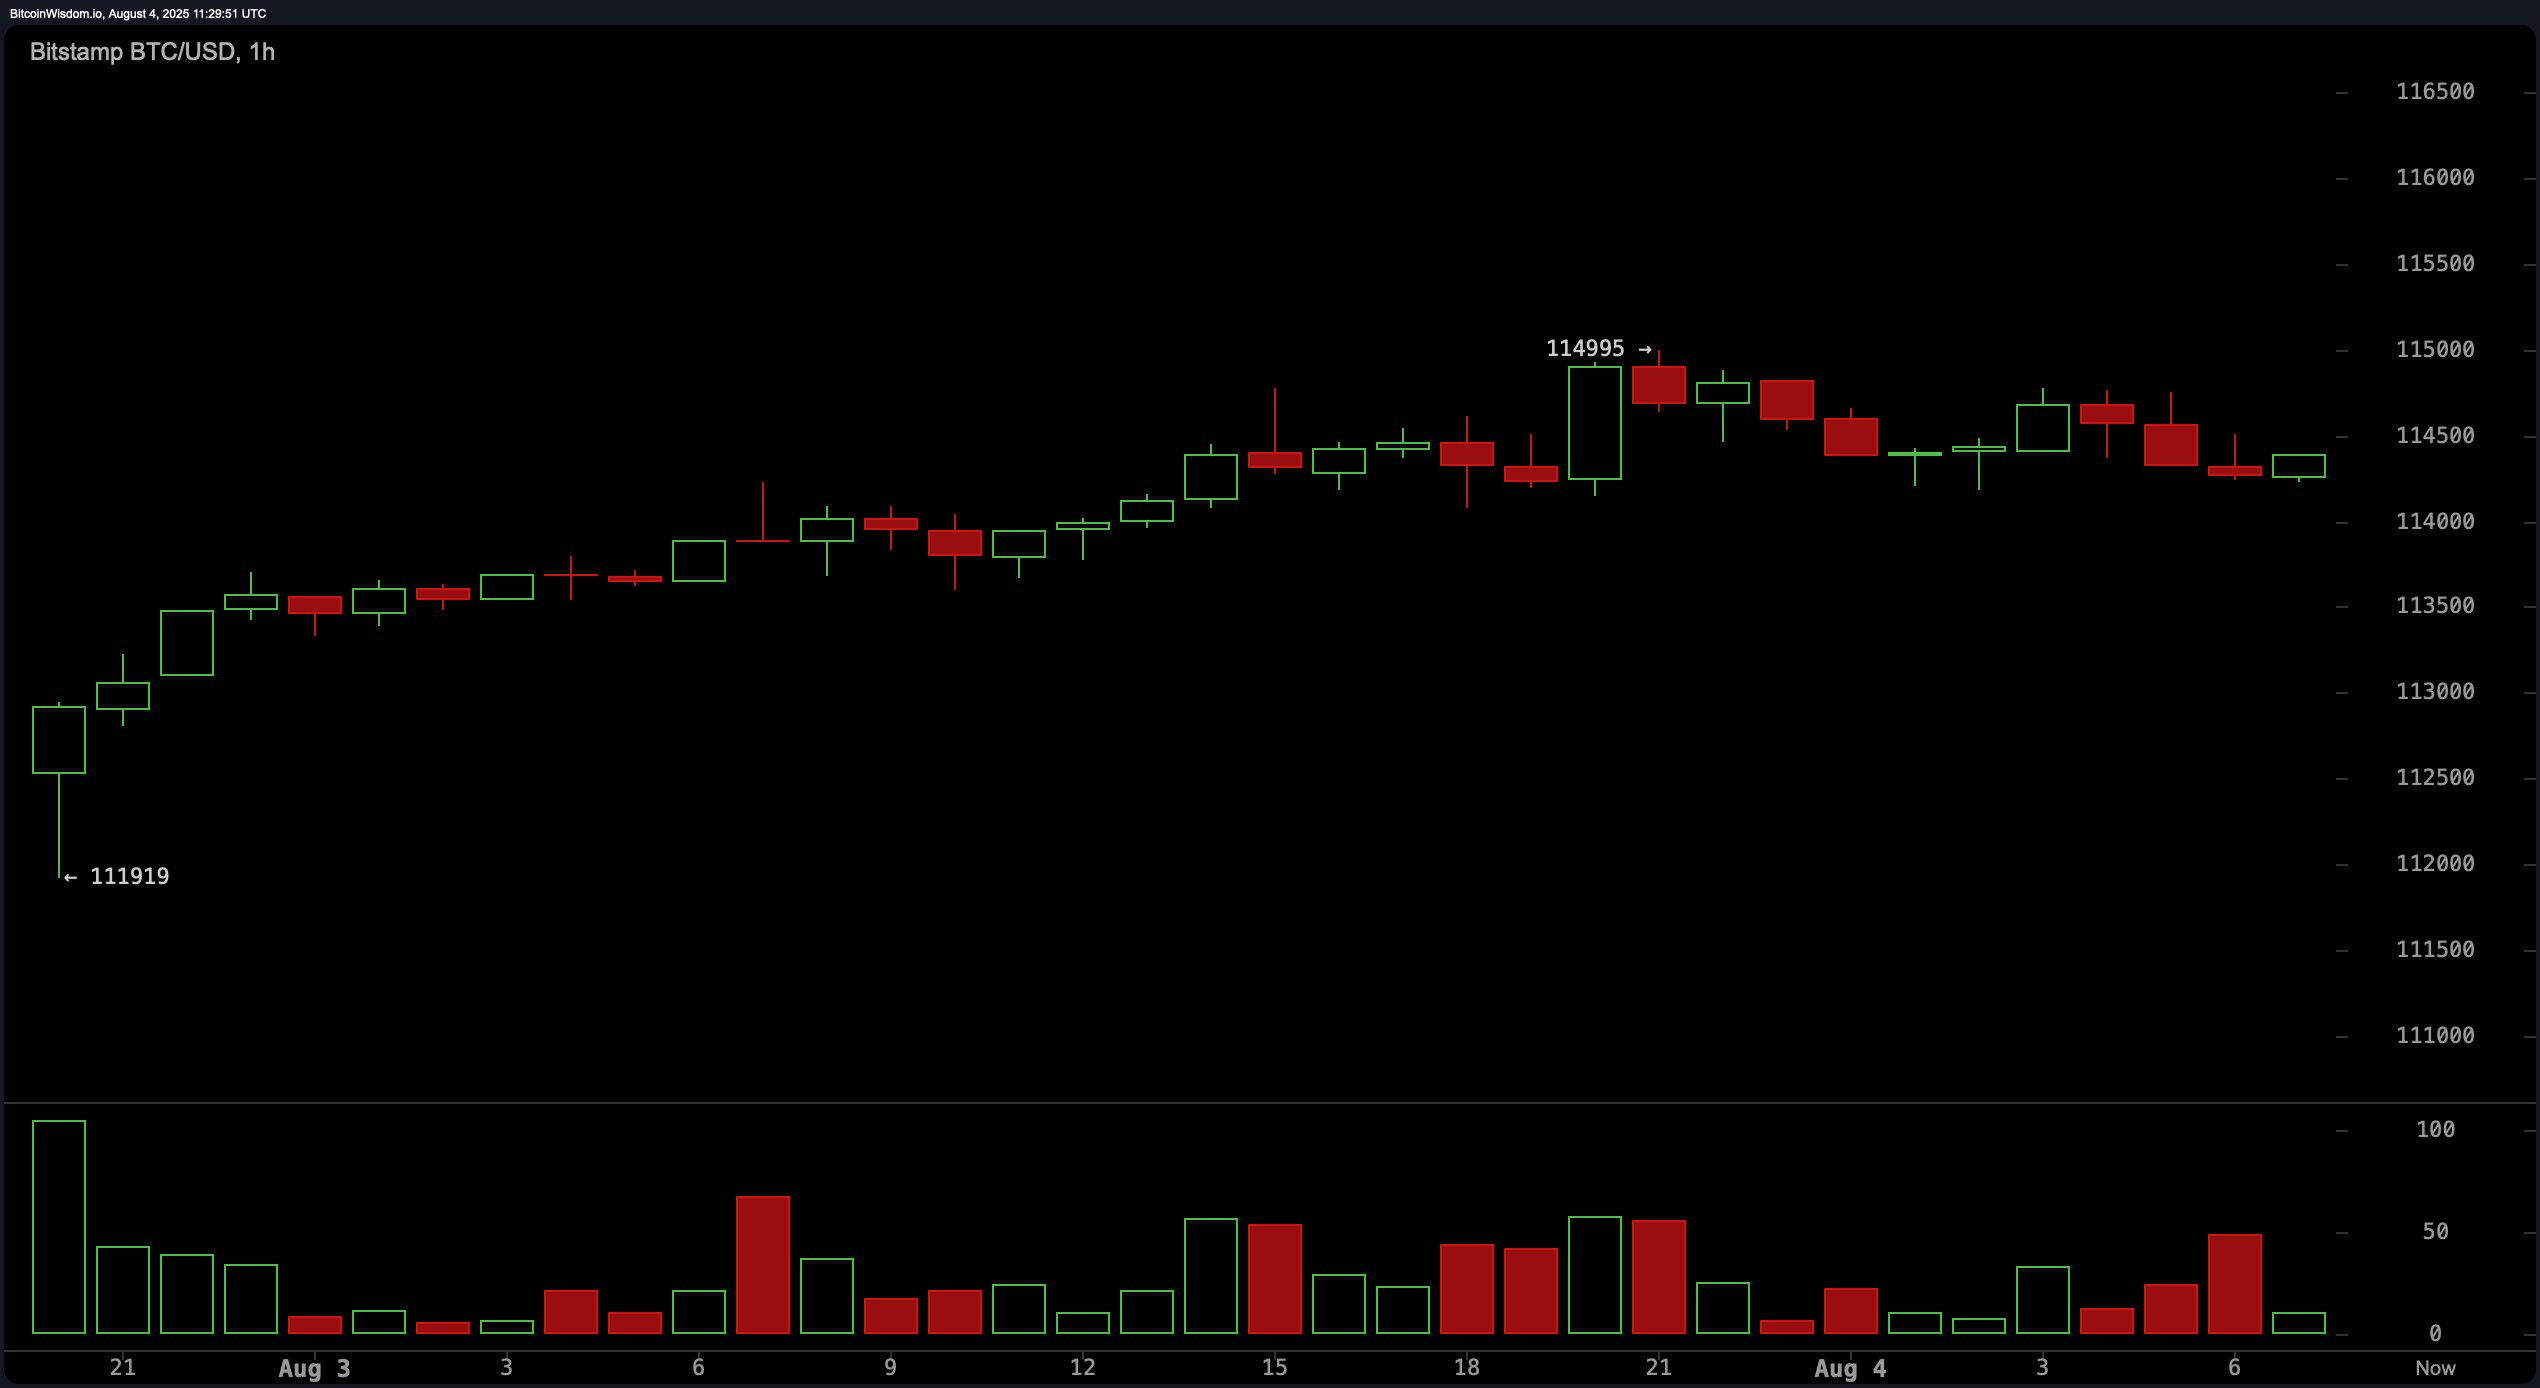
On the 1-hour bitcoin chart, the micro trend shows the recovery from $111,919 to about $114,995, with smaller pullbacks emerging. Intraday support is near $114,000, while resistance is situated around $115,000. A breakout or rejection at this level is likely to dictate the next short-term move. Notably, the latest candles are forming on lower volume, hinting at possible buying exhaustion.

BTC/USD 1-hour chart via Bitstamp on Aug. 4, 2025.
Oscillator readings present a mixed picture. The relative strength index (RSI) stands at 47 (Neutral), Stochastic at 21 (Neutral), and the commodity channel index (CCI) at −123 (Buy). The average directional index (ADX) at 20 signals a lack of strong trend, while the Awesome oscillator at −823 is neutral. Momentum at −3,275 gives a bullish indication, while the moving average convergence divergence (MACD) level at 280 signals bearish action. This combination reflects uncertainty and potential for volatile swings in either direction.
Moving averages (MAs) indicate a clear split between short-term and long-term outlooks. The exponential moving average (EMA) and simple moving average (SMA) for the 10-, 20-, and 30-periods are all in a bearish territory, with values above the current price, suggesting short-term downward pressure. Conversely, the EMA and SMA for the 50-, 100-, and 200-periods all show bullish signals, reflecting that the broader trend remains positive despite short-term weakness. This divergence underscores the importance of the $115,500 resistance—breaking above it could align the short-term momentum with the prevailing long-term trend.
Bull Verdict:
If bitcoin can break and sustain above $115,500 with increasing volume, momentum may shift back in favor of buyers, paving the way for a retest of $118,000 and potentially the $120,000 zone. The alignment of long-term moving averages in buy territory supports the argument that the broader uptrend remains intact, making this a possible continuation pattern rather than a full reversal.
Bear Verdict:
Failure to clear the $115,500 resistance, coupled with a breakdown below $114,000 on strong selling volume, could trigger a decline toward $112,000. The weakening short-term moving averages and neutral-to-bearish oscillator signals point to the risk of further downside if bulls cannot reclaim control in the near term.
免责声明:本文章仅代表作者个人观点,不代表本平台的立场和观点。本文章仅供信息分享,不构成对任何人的任何投资建议。用户与作者之间的任何争议,与本平台无关。如网页中刊载的文章或图片涉及侵权,请提供相关的权利证明和身份证明发送邮件到support@aicoin.com,本平台相关工作人员将会进行核查。


