There are two kinds of people in the crypto world: those who think Bitcoin is volatile, and those who trade meme coins.
Sure, Bitcoin is down 3% today, but it’s barely budged over the last week—moving just 2% in the last seven days, after gaining almost 5% in the last 30 days. It’s the sort of sideways action that makes degens yawn. But for those who want never-ending drama, there’s always meme coins.
Dogecoin is the worst-performing coin in the top 10 by market cap, dropping 8% in the last week after gaining 20% over the last 30 days. And if you think that’s rough, take a look down further on the top 100: Bonk is down more than 20% over the last seven days while Pepe has sunk 12%.
It puts the Bitcoin movements into perspective. And speaking of which: The broader market context shows traditional risk assets under pressure as analysts wait to assess whether recent U.S. tariffs on select imports strengthen the U.S. dollar or increase inflation as those burdens are absorbed by the general population. Also, the Federal Reserve's decision to maintain rates at 4.25%-4.5% has created a wait-and-see environment that's particularly harsh on high-beta crypto assets.
So what do the charts have to say about BTC?
Bitcoin price: A triangle pattern tested
Bitcoin's 3.5% decline to below $114,000 puts the coin below a technical support that could signal deeper corrections ahead. Selling intensified after Bitcoin broke below the $118,859 support level, accelerating downward pressure toward the next support at $112,000. BTC bears appear to be intent on pushing the price below the resistance of the symmetrical triangle pattern in place since last month.
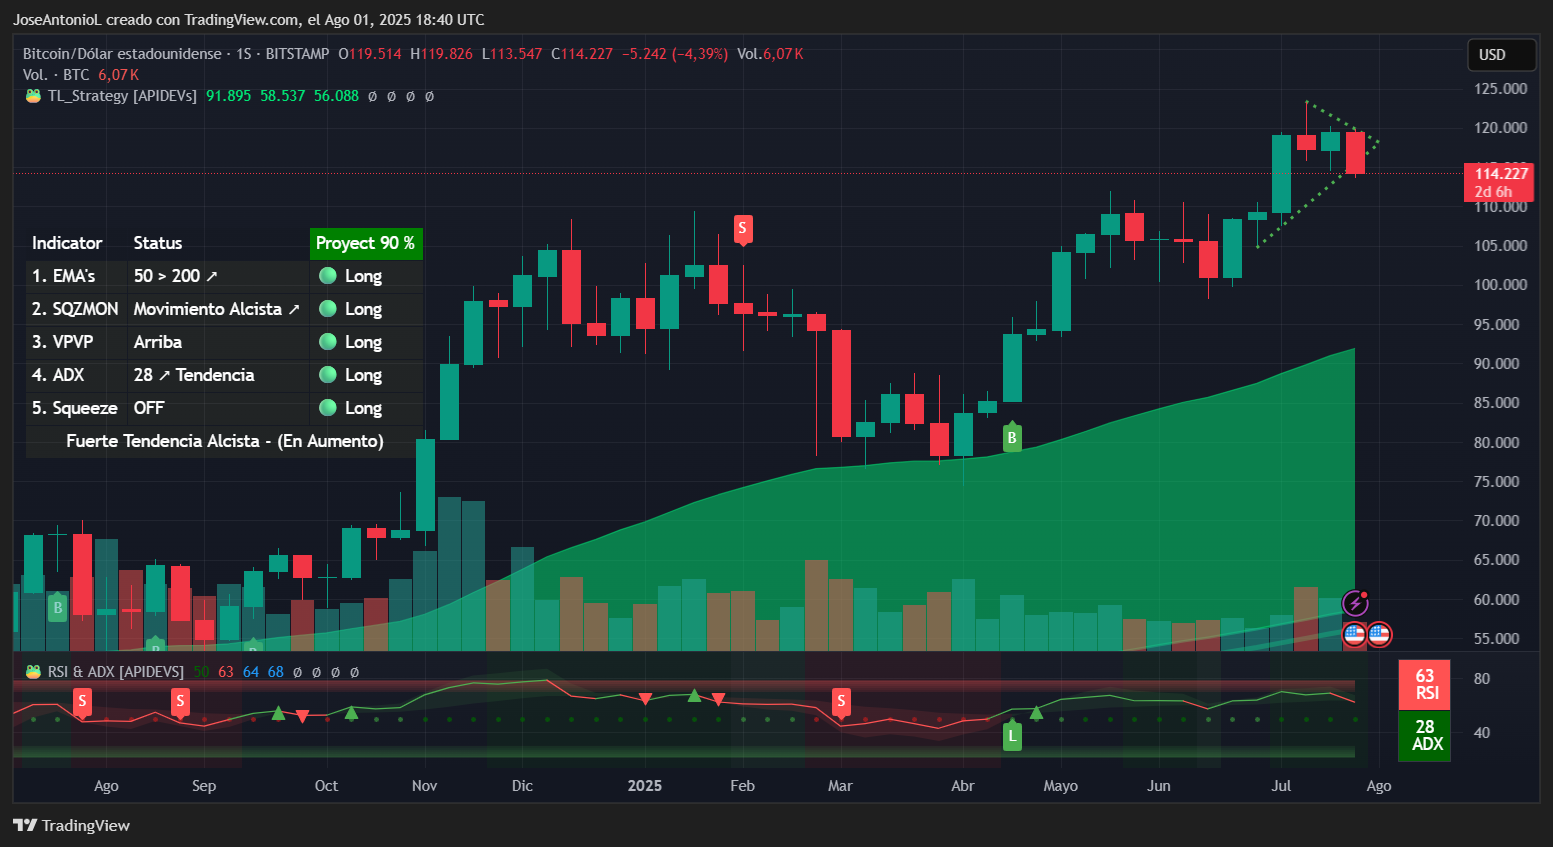
Bitcoin price data. Image: TradingView
Over on Myriad, a prediction market developed by Decrypt's parent company Dastan, traders remain bullish, with users placing the odds that BTC hits $125K before dipping back down to $105K at 55%. But those odds are on the way down, dropping from 70% just yesterday.
Overall, though, the weekly chart shows what traders would interpret as fairly strong bullish momentum, but the pattern may seem a bit concerning.
The Relative Strength Index, or RSI, for Bitcoin sits at 63, which typically indicates healthy bullish momentum. But the recent decline from overbought territory above 70 shows selling pressure is building. RSI measures how market a market might be, from 0 to 100, and usually, 63 points alone means there’s room for more bullish days without reaching overbought territory.
However, when RSI drops from high levels like this, it often signals that the preceding rally is losing steam and traders should prepare for potential mean reversion or at least a correction inside the overall bullish trend.
The Average Directional Index, or ADX, for Bitcoin stands at 28, which for traders would confirm strong trend strength. But, again, the readings are down a bit from previous weeks.
ADX measures trend strength regardless of direction. While the strong trend indicator supported Bitcoin's rally above $100,000, the same trend strength that powered the upside can amplify moves to the downside once key support levels break. Traders often see ADX above 25 as confirmation that whatever direction the market chooses, it's likely to continue with conviction. In other words, don’t expect a massive dump, but volatility after all this compression period would not be unexpected.
Bitcoin's Exponential Moving Averages, or EMAs, tell a more complex story. EMA measures the average price of an asset over a set period of time. Bitcoin’s 50-day EMA remains above the 200-day EMA, maintaining the technically bullish configuration that has supported Bitcoin's long-term uptrend. Also, the gap between the two is, at least for now, expanding—and this is good for long term hodlers, a technically minded trader would say.
Key Levels:
- Immediate support: $110,000 (psychological level and major accumulation zone)
- Immediate resistance: $118,859 (23.6% Fibonacci retracement)
- Strong resistance: $122,000 (previous all-time high area)
XRP continues its sideways drift
XRP's 6.08% decline to $3.04 continues to reflect the coin’s struggle to break out of its recent trading range, despite positive regulatory developments earlier in the year. The technical picture shows a market stuck in neutral after an extremely accelerated jump over the last year.
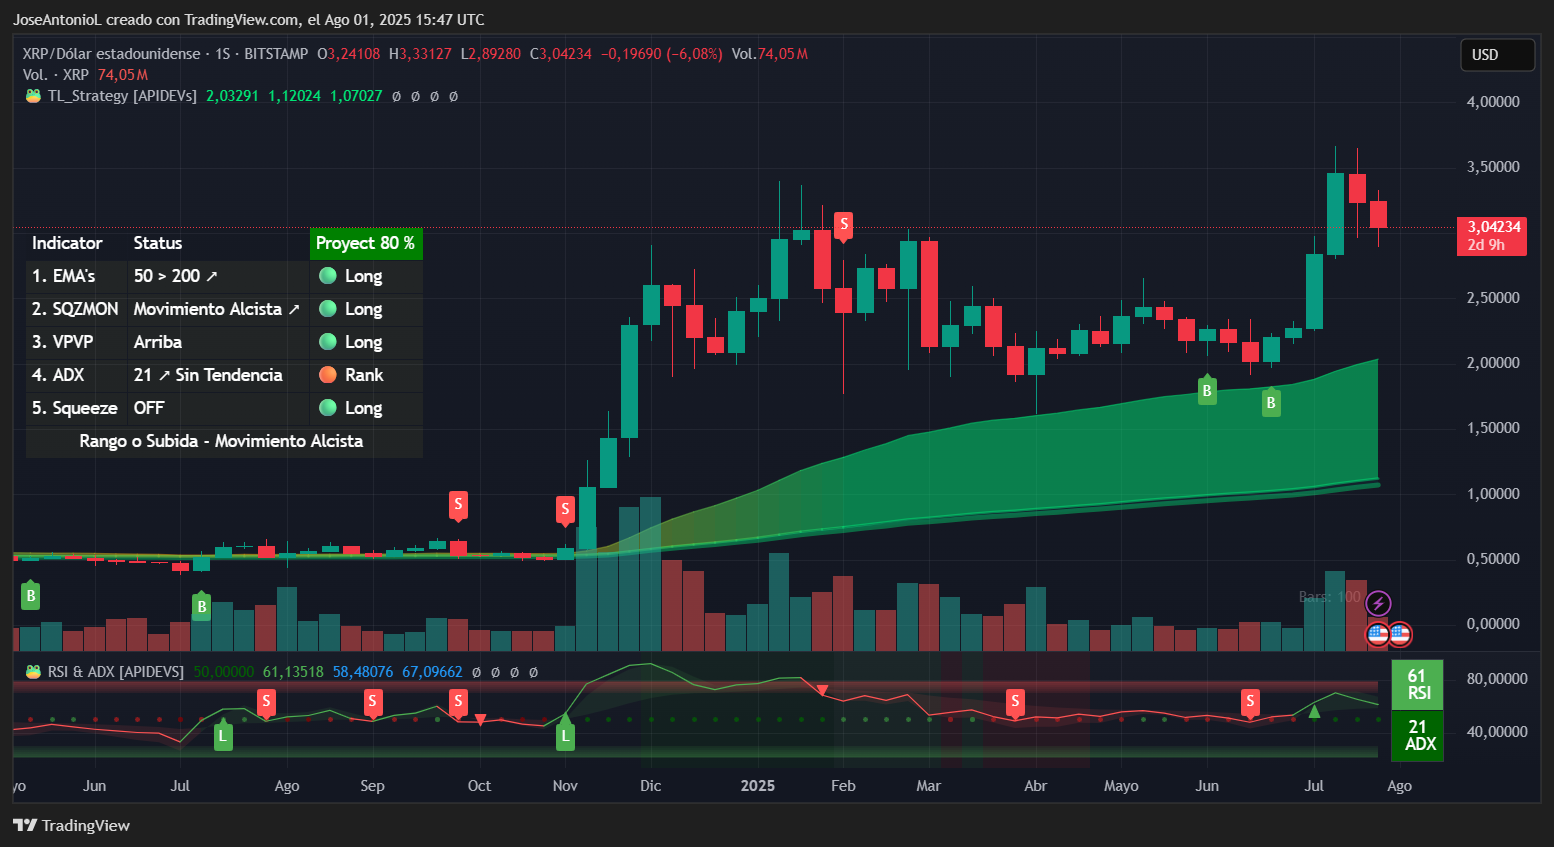
XRP price data. Image: TradingView
The RSI reading of 61 places XRP in a balanced zone with a bullish tilt—not oversold enough to trigger buying interest, but not overbought enough to justify taking profits. This reading typically suggests that the asset is fairly valued at current levels, but also indicates a lack of strong directional conviction from traders.
More telling is the Average Directional Index reading of just 21, which falls below the crucial 25 threshold that confirms trend establishment. When ADX readings stay below 25, it typically indicates that an asset is range-bound rather than trending. For XRP, this suggests the recent price action is more about consolidation than the beginning of a new directional move.
That said, the Squeeze Momentum Indicator shows a contradicting view. (It’s not unusual for two technical analysis indicators to contradict each other.) Based on the readings, there is no squeeze in play and the movement is still bullish and stable. To balance these views, and depending on how long you want to hold the coin, traders may opt to analyze shorter-term charts. This helps spot earlier switches in the trend.
The moving average configuration provides some comfort for bulls, with the 50-day EMA still trading above the 200-day EMA. However, the narrow gap between these averages indicates that this bullish setup is fragile and could reverse if selling pressure intensifies.
Key Levels:
- Immediate support: $2.90 (recent consolidation low)
- Strong support: $2.50 (major psychological level)
- Immediate resistance: $3.30 (recent rejection area)
- Strong resistance: $3.70 (multi-month high)
Dogecoin praying for bulls
Dogecoin's brutal 8% plunge to just above $0.20 is the most severe decline among major cryptocurrencies and highlights the vulnerability of meme coins in the current market environment. The technical picture has deteriorated significantly, with bearish indicators flashing warning signs across multiple timeframes.
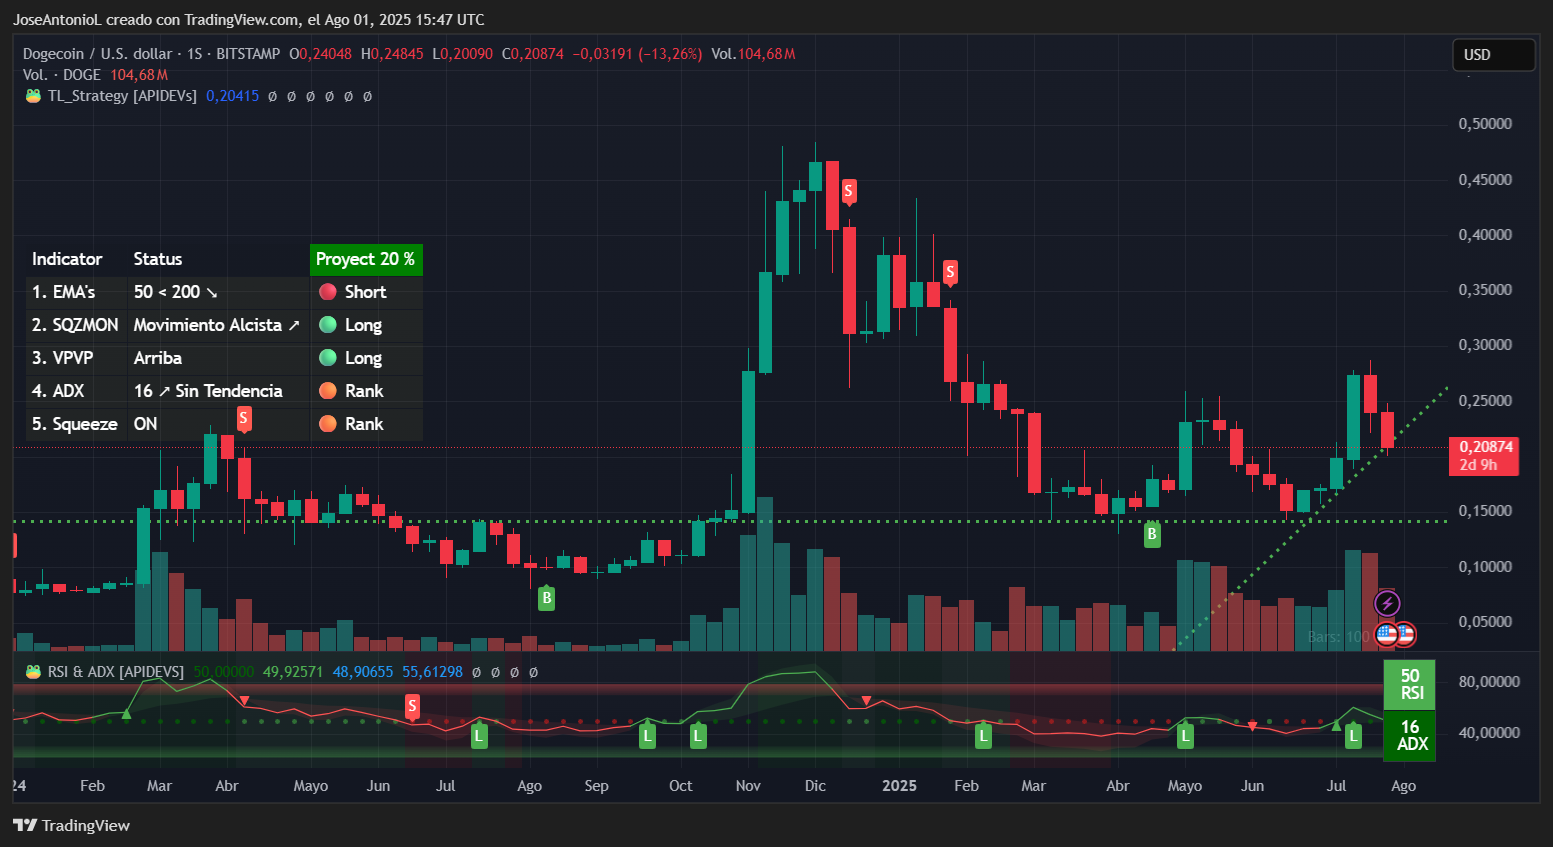
Dogecoin price data. Image: TradingView
The RSI reading of 50 sits exactly at the neutral midpoint, which might seem balanced but actually represents a loss of bullish momentum. For a meme coin like DOGE that relies heavily on retail enthusiasm and social media buzz, an RSI reading that's neither oversold nor overbought often indicates waning interest rather than equilibrium.
Perhaps most troubling is the Average Directional Index reading of just 16, well below the 25 threshold that confirms trend strength. Low ADX readings after a significant decline often indicate that selling pressure isn't strong enough to drive further downside, but it also means buying interest is insufficient to support a recovery.
The Squeeze Momentum Indicator shows "on" status, suggesting that volatility compression is building. Up until now, the coin has maintained a bullish support since June hinting at a bullish double bottom movement. However, prices ended this week just testing that zone once again. If next week remains bearish, then such a pattern may be considered a false signal and $0.15 could be again a support to test. If there’s a recovery, then the double bottom remains valid, the support remains in play, and a path towards $0.30 remains possible in the medium term
Key Levels:
- Immediate support: $0.20 (psychological level and current test)
- Strong support: $0.18 (major support from previous consolidation)
- Immediate resistance: $0.22 (broken support turned resistance)
- Strong resistance: $0.26 (major resistance area throughout the year)
The views and opinions expressed by the author are for informational purposes only and do not constitute financial, investment, or other advice.
免责声明:本文章仅代表作者个人观点,不代表本平台的立场和观点。本文章仅供信息分享,不构成对任何人的任何投资建议。用户与作者之间的任何争议,与本平台无关。如网页中刊载的文章或图片涉及侵权,请提供相关的权利证明和身份证明发送邮件到support@aicoin.com,本平台相关工作人员将会进行核查。


