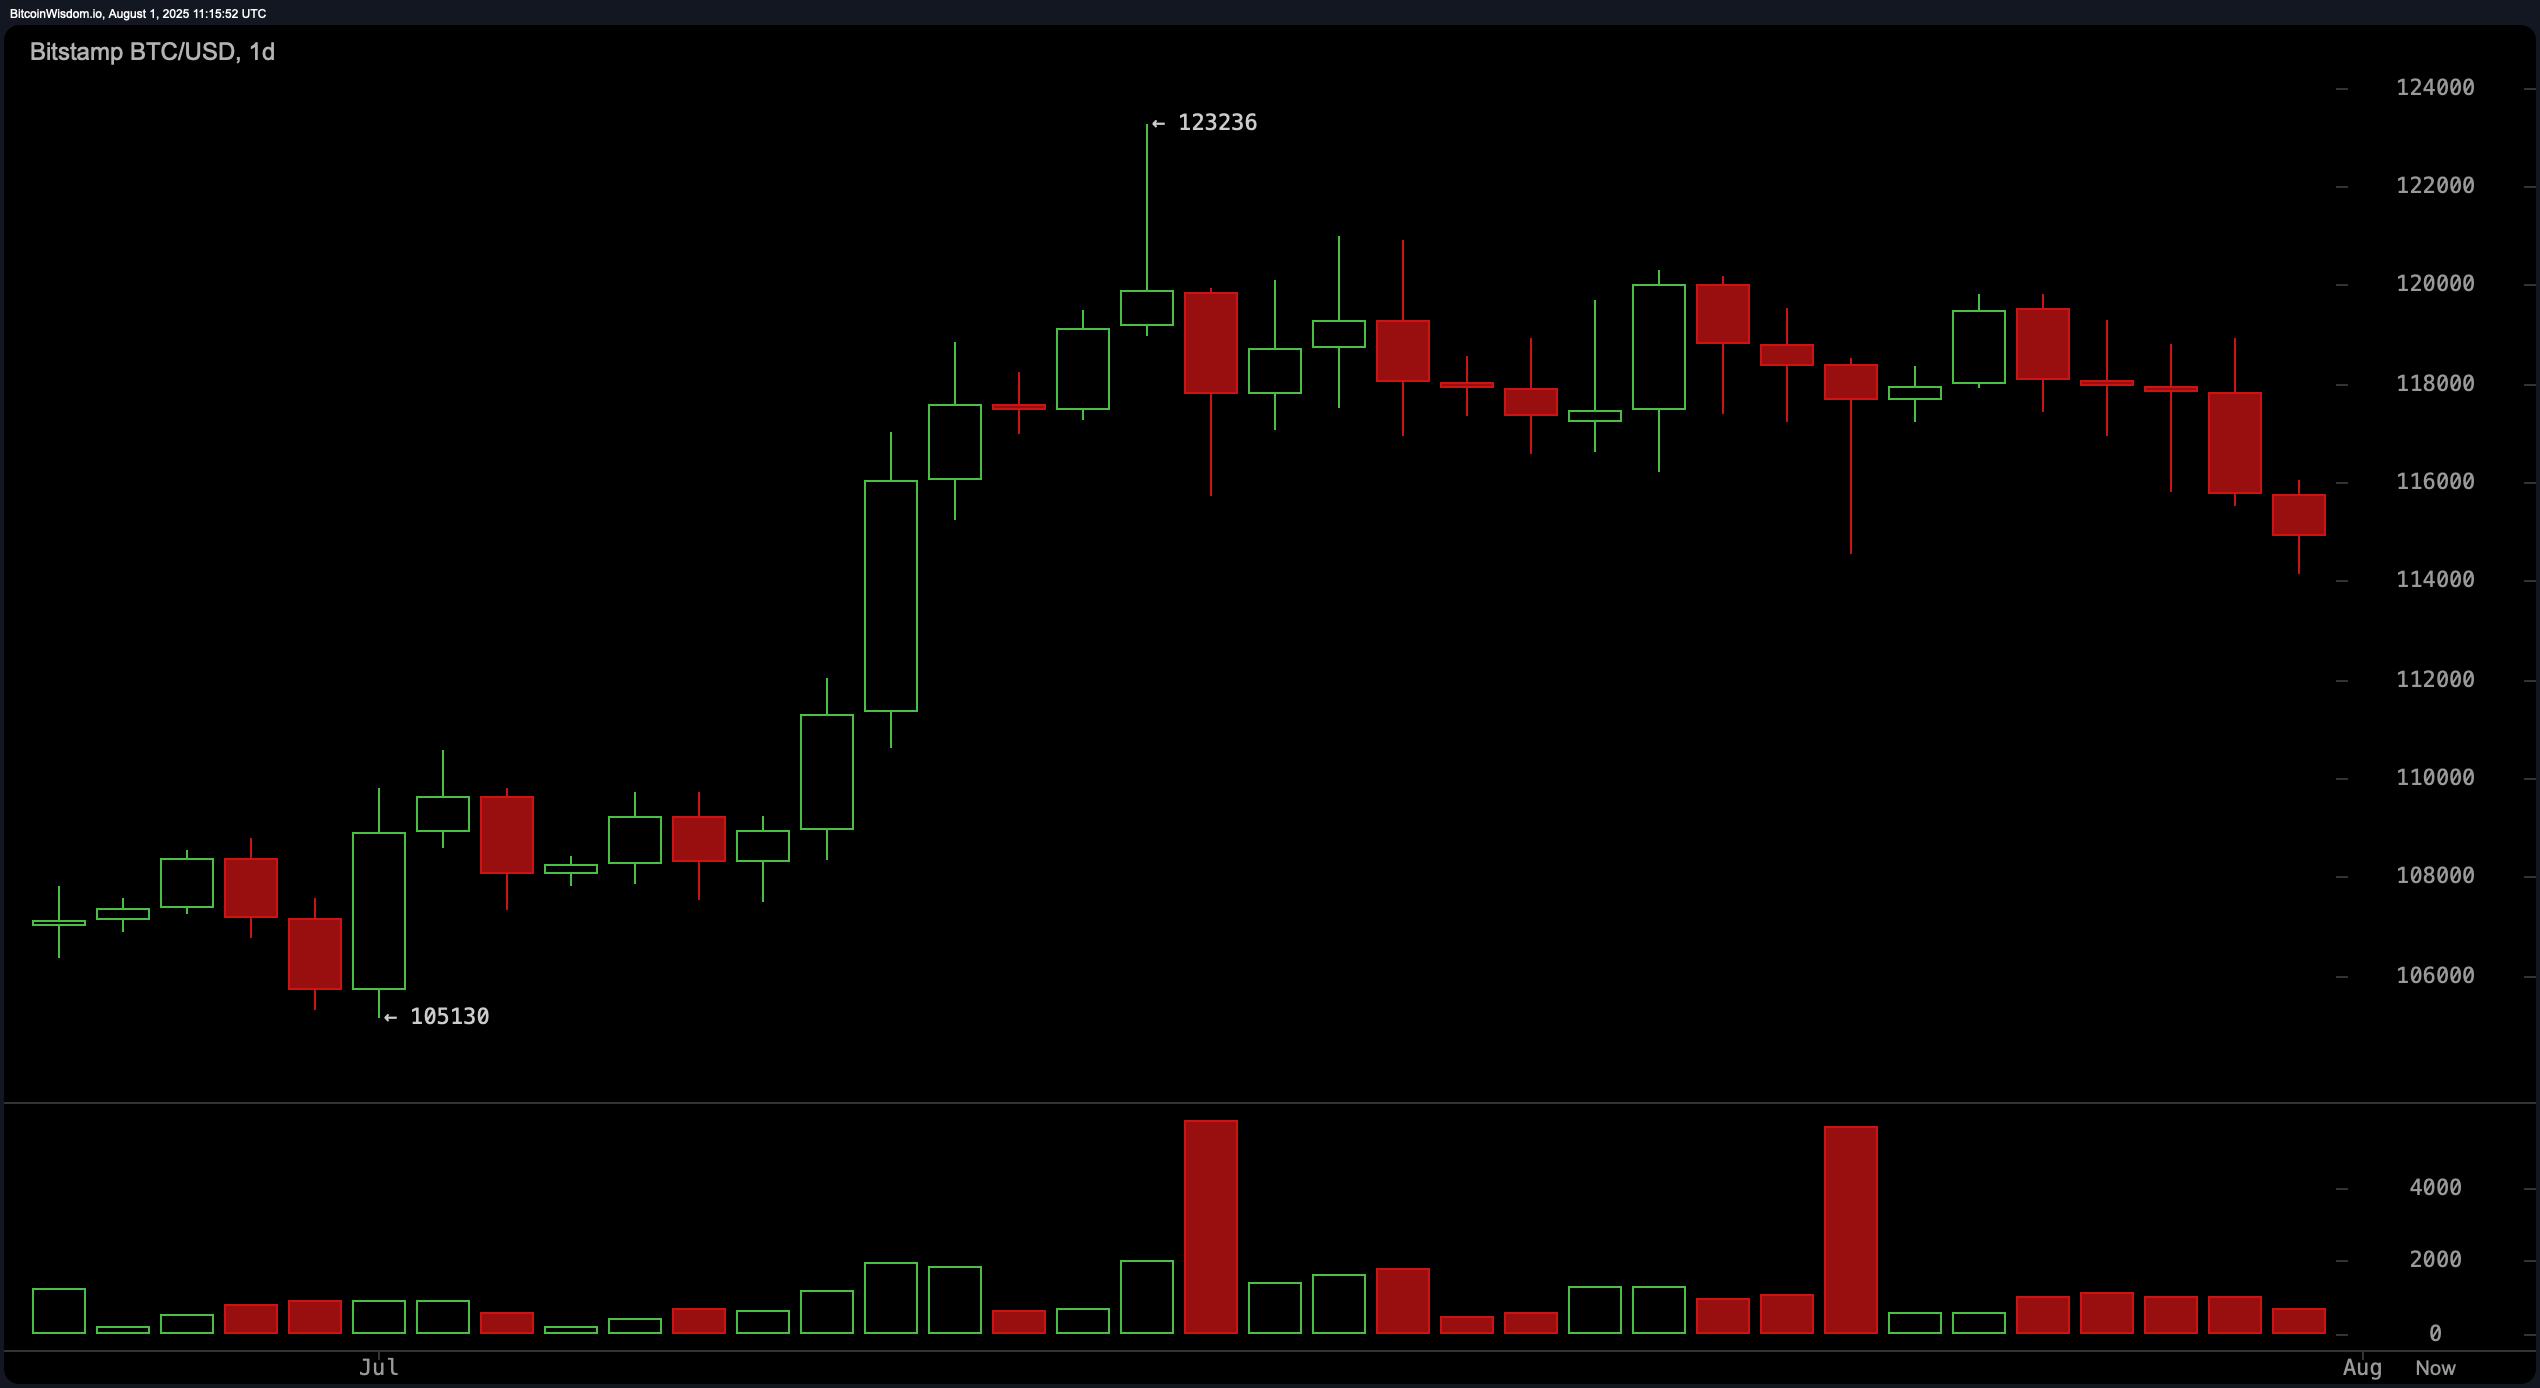
On the daily chart, bitcoin continues to exhibit a short-term downtrend following a recent peak at approximately $123,236. Price action has since retraced toward the $114,000–$115,000 support zone, currently acting as a base for potential consolidation. Despite the downward bias, declining sell volume suggests possible seller exhaustion, which could open the door to a bullish reversal. A break and close above the $118,000 resistance would strengthen bullish momentum, while a failure to hold above $114,000 may result in renewed selling pressure.

BTC/USD daily chart via Bitstamp on August 1, 2025.
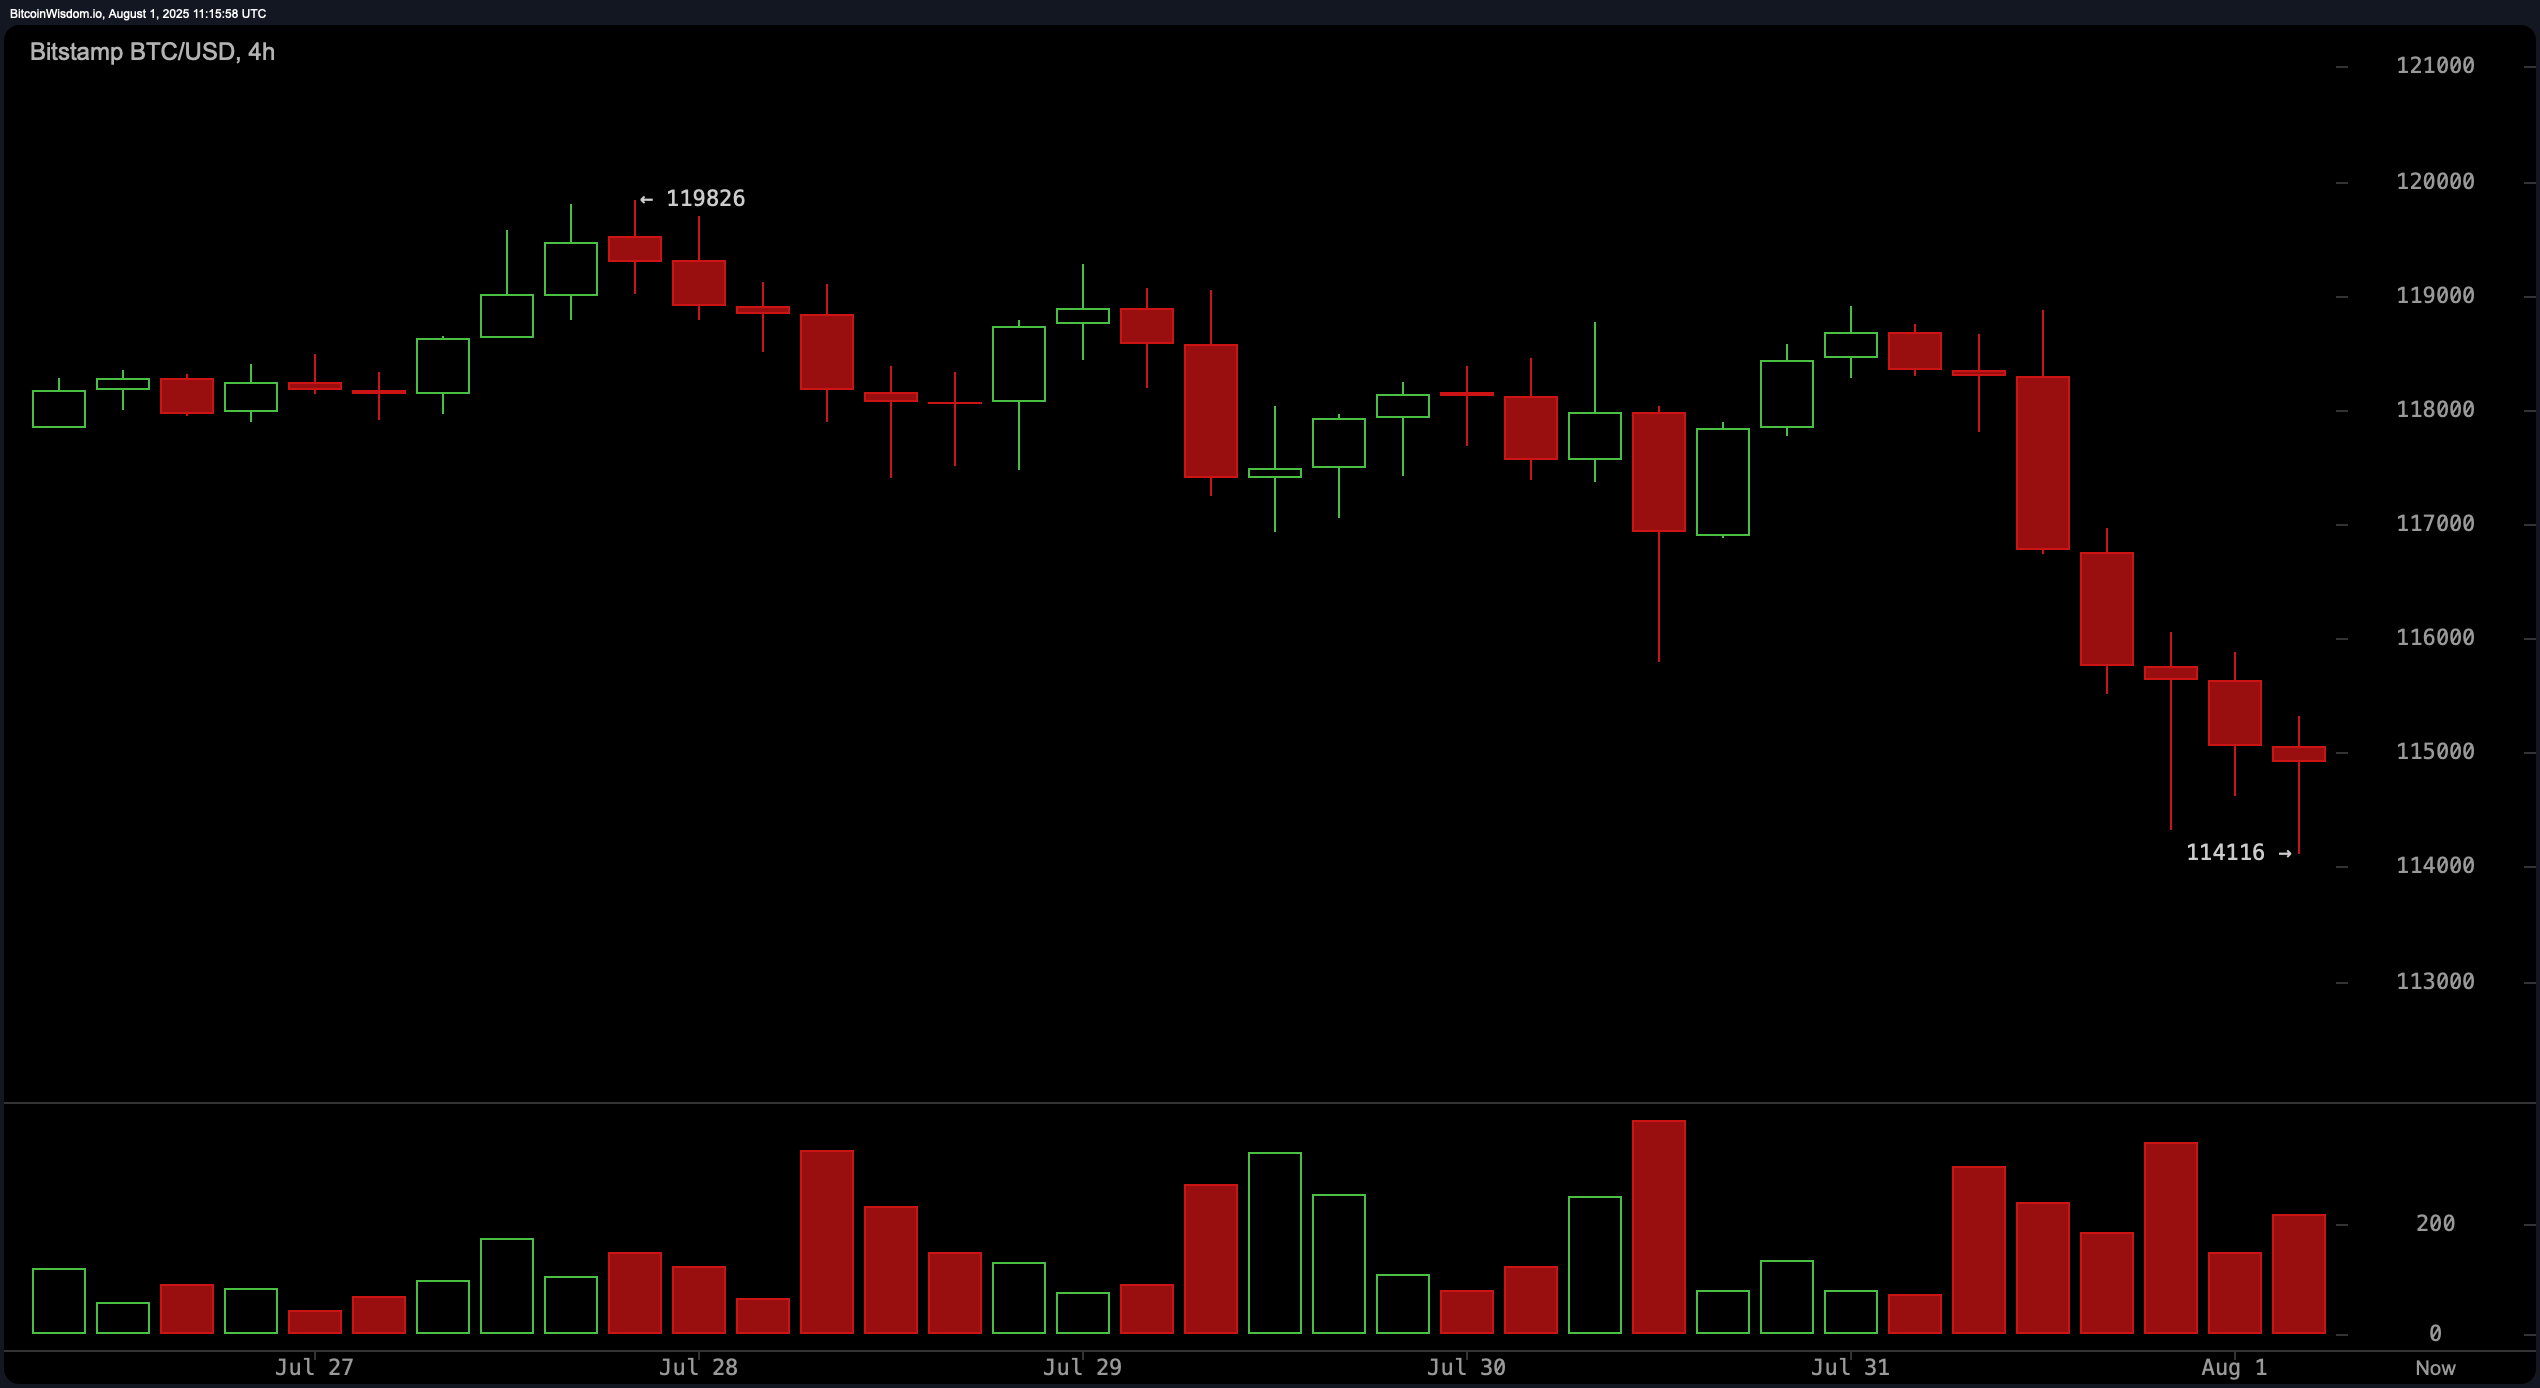
The four-hour bitcoin chart reveals a well-defined bearish market structure characterized by consistent lower highs and lower lows. Notably, red candle volume has increased, reinforcing the prevailing downward momentum. However, support at the $114,116 level is holding for now. A short entry near $117,000–$117,500 appears valid if price faces rejection, while a double bottom formation at $114,000, accompanied by bullish divergence, would provide a compelling case for a long entry.

BTC/USD 4-hour chart via Bitstamp on August 1, 2025.
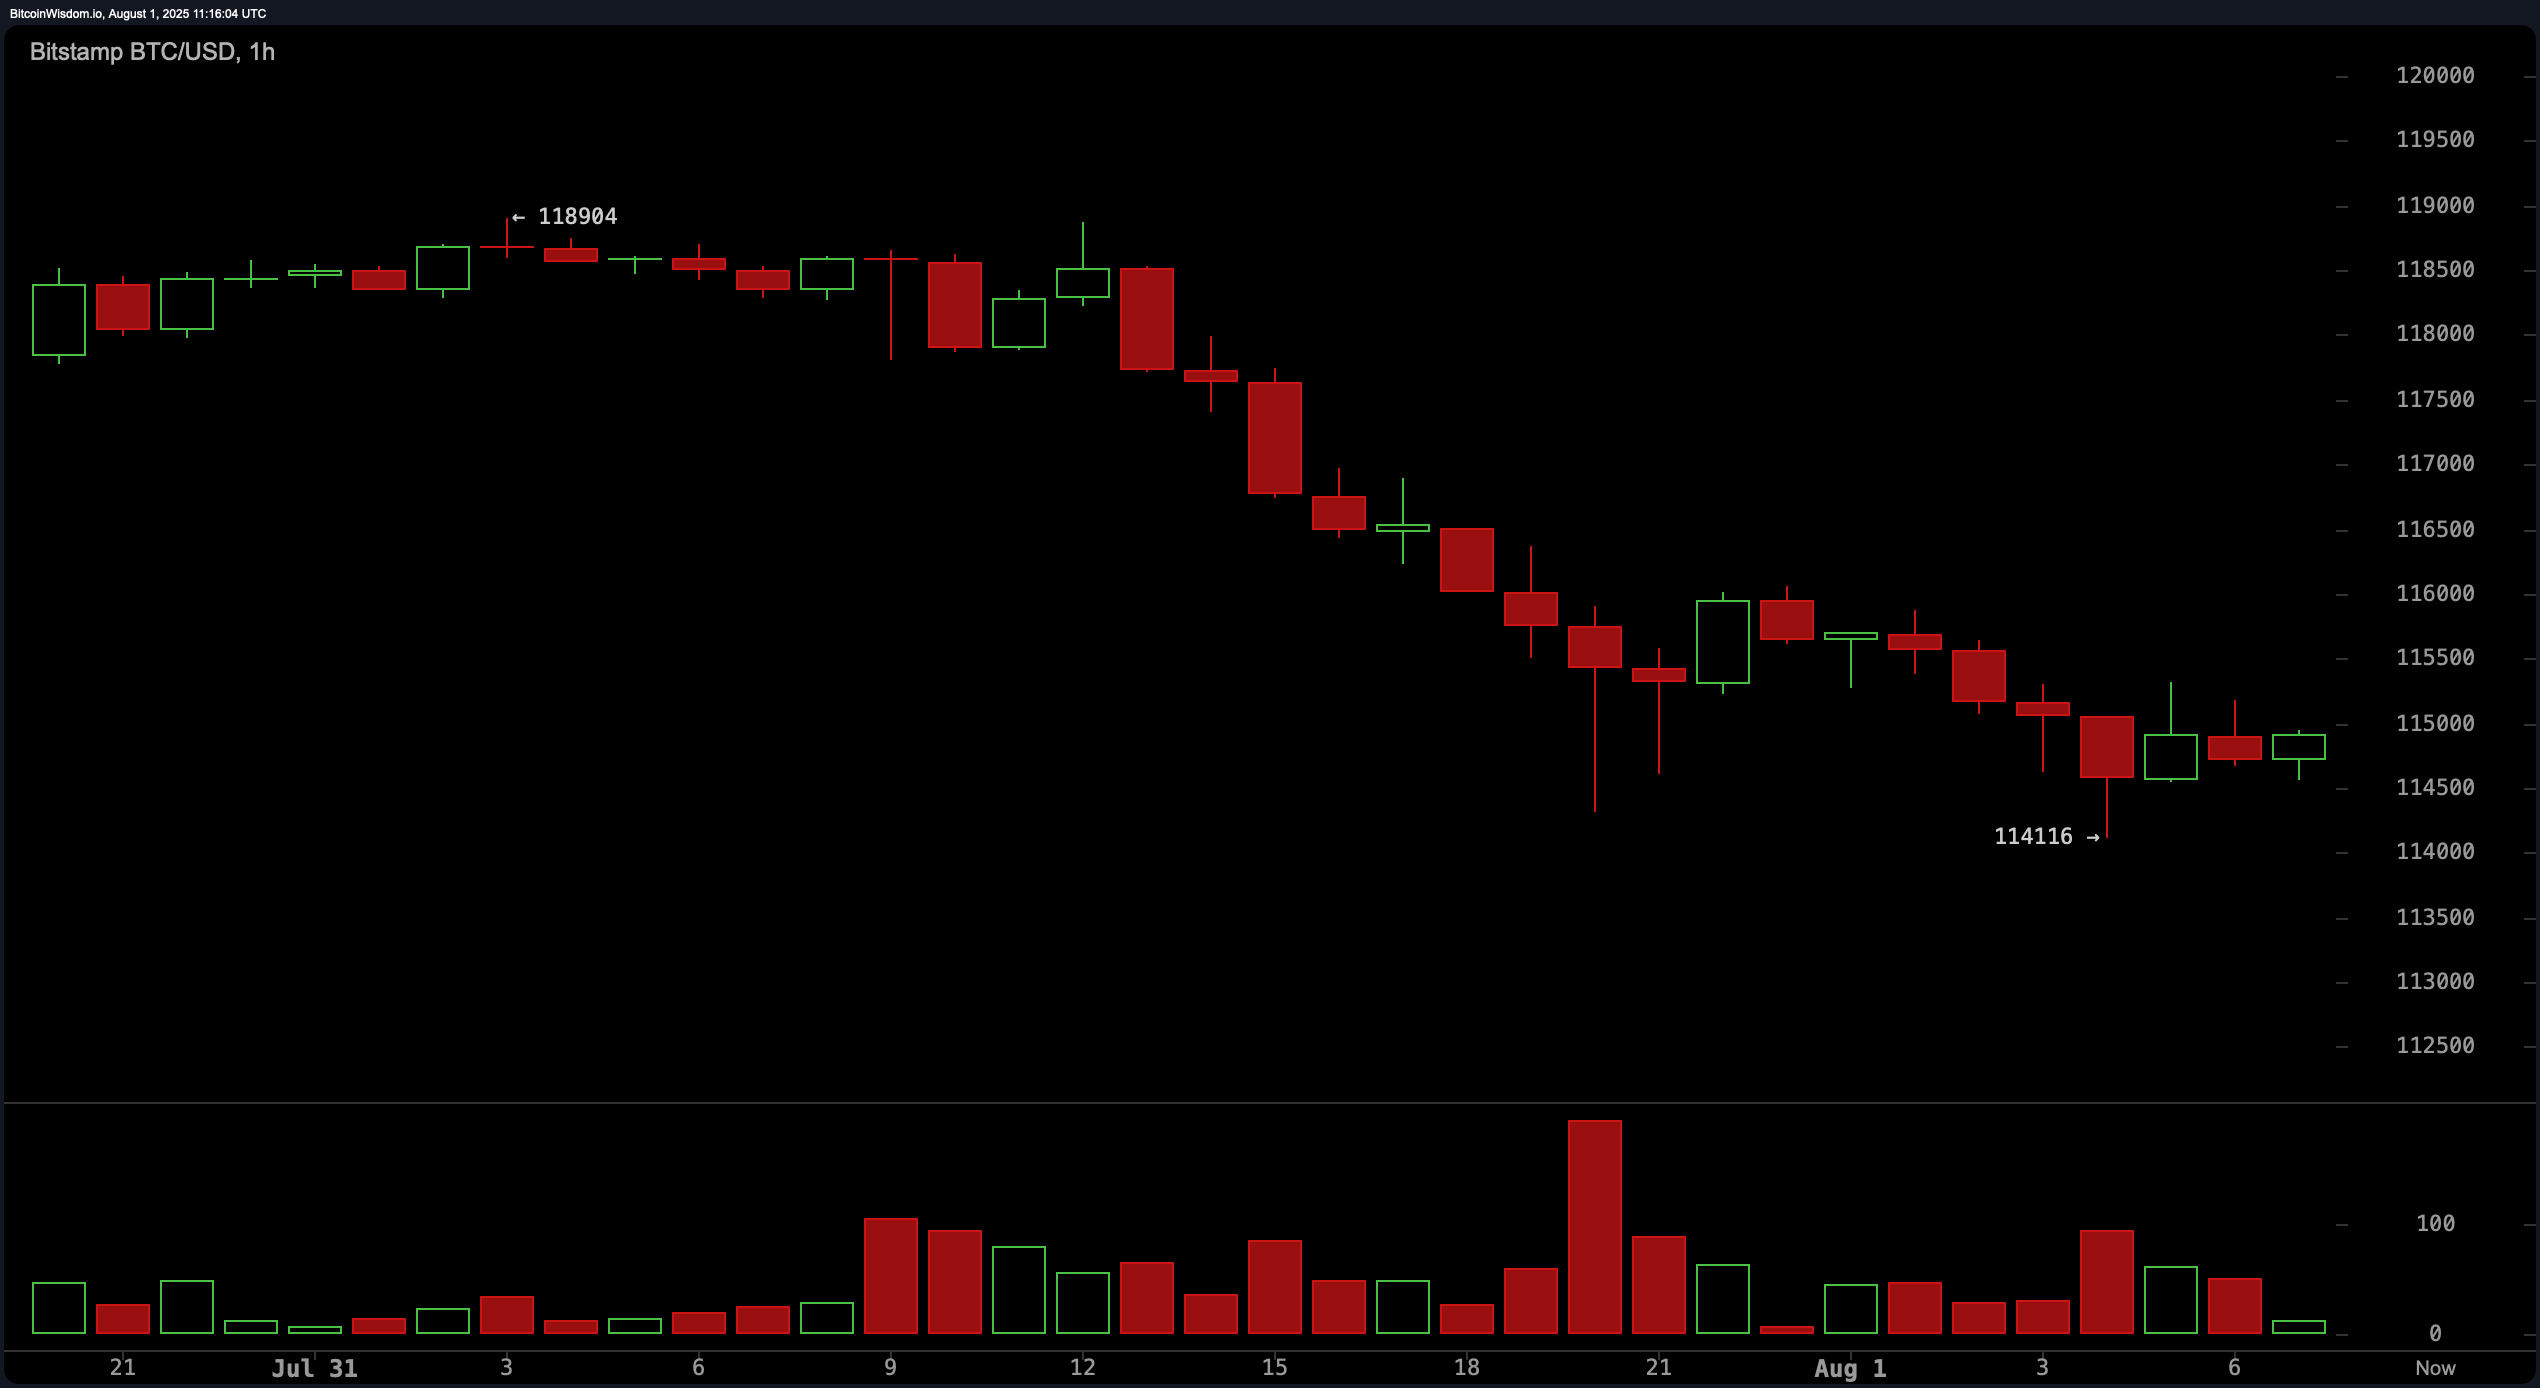
On the one-hour chart, bitcoin is trending smoothly downward, with limited upward retracements. A pronounced volume spike during the most recent decline followed by tapering volume may suggest a potential reversal point. Currently, small-bodied candles at the recent lows indicate that base-building might be underway. Scalpers may consider long entries above $114,500 if a bullish engulfing candle confirms strength, or short positions below $115,000 should rejection occur. Profit targets for these trades should remain conservative, capped at 200–300 points due to intraday volatility.

BTC/USD 1-hour chart via Bitstamp on August 1, 2025.
Oscillator readings point to the ongoing market indecision. The relative strength index (RSI) stands at 46, the Stochastic at 28, and the commodity channel index (CCI) at -258 — all indicating neutral sentiment. Meanwhile, the average directional index (ADX) at 21 and momentum at -5,123 suggest underlying bearish tendencies. The moving average convergence divergence (MACD) level is at 1,208, also reflecting intense bearish pressure.
Moving average (MA) readings reinforce this bearish outlook in the short term, with both the 10-day and 20-day exponential moving averages (EMA) and simple moving averages (SMA) triggering negative signals. However, longer-term indicators, such as the 50-day, 100-day, and 200-day EMAs and SMAs, remain supportive of the broader uptrend. This divergence between short-term and long-term averages hints at a possible bottoming structure developing if support levels hold.
Bull Verdict:
If bitcoin maintains its footing above the $114,000 support and breaks convincingly above the $118,000 resistance with increased volume, it could signal the end of the current pullback and a resumption of the broader uptrend. The convergence of long-term moving averages in buy territory supports this scenario, offering bullish traders a favorable risk-reward setup for upward continuation.
Bear Verdict:
Despite short-term consolidation, the prevailing structure across the one-hour and four-hour charts remains bearish, with key oscillators and short-term moving averages aligning with further downside risk. Should bitcoin lose the $114,000 support, momentum could accelerate toward the $113,000–$112,000 zone, invalidating bullish setups and reinforcing the current bearish trend.
免责声明:本文章仅代表作者个人观点,不代表本平台的立场和观点。本文章仅供信息分享,不构成对任何人的任何投资建议。用户与作者之间的任何争议,与本平台无关。如网页中刊载的文章或图片涉及侵权,请提供相关的权利证明和身份证明发送邮件到support@aicoin.com,本平台相关工作人员将会进行核查。


