Cryptocurrency News
Hot Topics on July 31:
1. The White House suggests taxing U.S. citizens' overseas cryptocurrency accounts.
2. Trump imposes an additional 40.00% tariff on Brazil and reaches a trade agreement with South Korea.
3. The Federal Reserve maintains interest rates for the fifth consecutive time, in line with market expectations.
4. Cboe and NYSE Arca submit rule change applications to the SEC to simplify the listing process for cryptocurrency ETFs.
5. Robinhood reports second-quarter earnings, with revenue increasing by 45% year-on-year to $989 million.
Trading Insights
Moving averages! They will give you the most direct guidance! Compare the three moving averages to three fixed stars; understanding their "actions" means grasping the lifeblood of trading.
- Moving Average Roles: Each has its segment, each performs its duty.
- ① 5-day line: Short-term "sentinel," reacts the fastest, responsible for capturing immediate rise and fall signals.
- ② 30-day line: Medium-term "judge," anchors the mid-term trend, more stable movement.
- ③ 60-day line: Long-term "stabilizer," determines the big direction, once clear, it's hard to reverse.
- Signal Interpretation: Understand the actions, execute precisely.
- When the 5-day line crosses above the 30-day and 60-day lines, it's a signal that the market is about to "exert force"; conversely, if the 5-day line crosses below, you must immediately reduce your position—don't hesitate.
- The worst scenario is when moving averages "fight"—entering when the 5-day and 30-day lines are tangled is no different from gambling. The real opportunity is when all three lines "march in step" and point in the same direction.
- In Extreme Markets, Rely on Moving Averages for Guidance.
- Cryptocurrency market surges and drops? Don't be afraid; moving average strategies are even more effective: a breakthrough of the 5-day line is an "attack order," while a turn of the 60-day line is a "retreat order." Simple to the extreme, yet frighteningly precise.
- Discipline is the Lifeline; Execution Must Be "Ruthless."
- How many people have plans written down but get flustered in sudden market movements? Moving averages never lie; they force you to be an "emotionless executor."
- Remember: you can doubt your judgment, but never doubt the collective force of moving averages—this is a rule built on real money.
LIFE IS LIKE
A JOURNEY ▲
Below are the real trading group orders from the Big White Community this week. Congratulations to the friends who followed along; if your operations are not going smoothly, you can come and test the waters.
The data is real, and each order has a screenshot from the time it was issued.
**Search for the public account: *Big White Talks About Currency*
BTC
Analysis
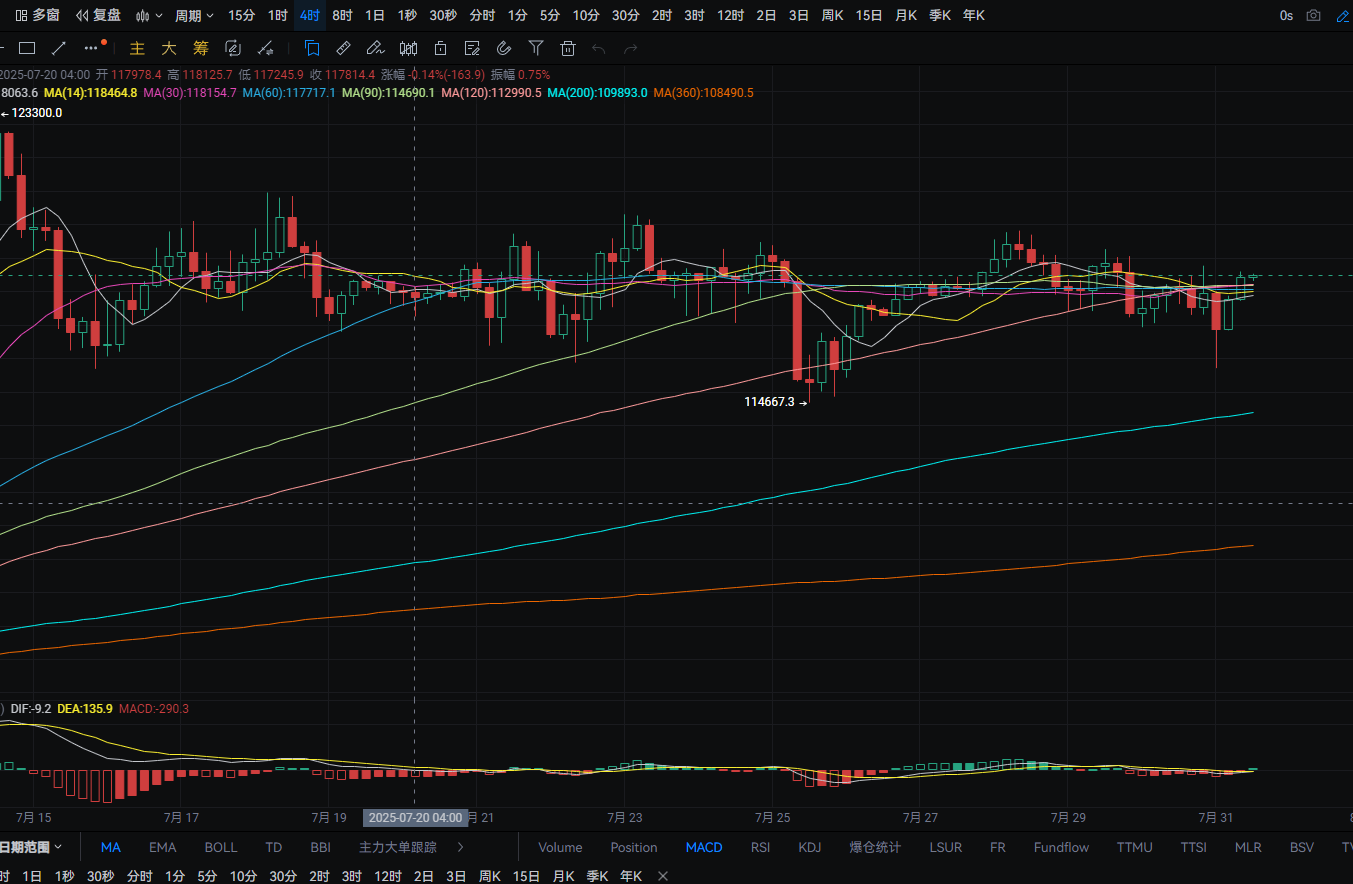
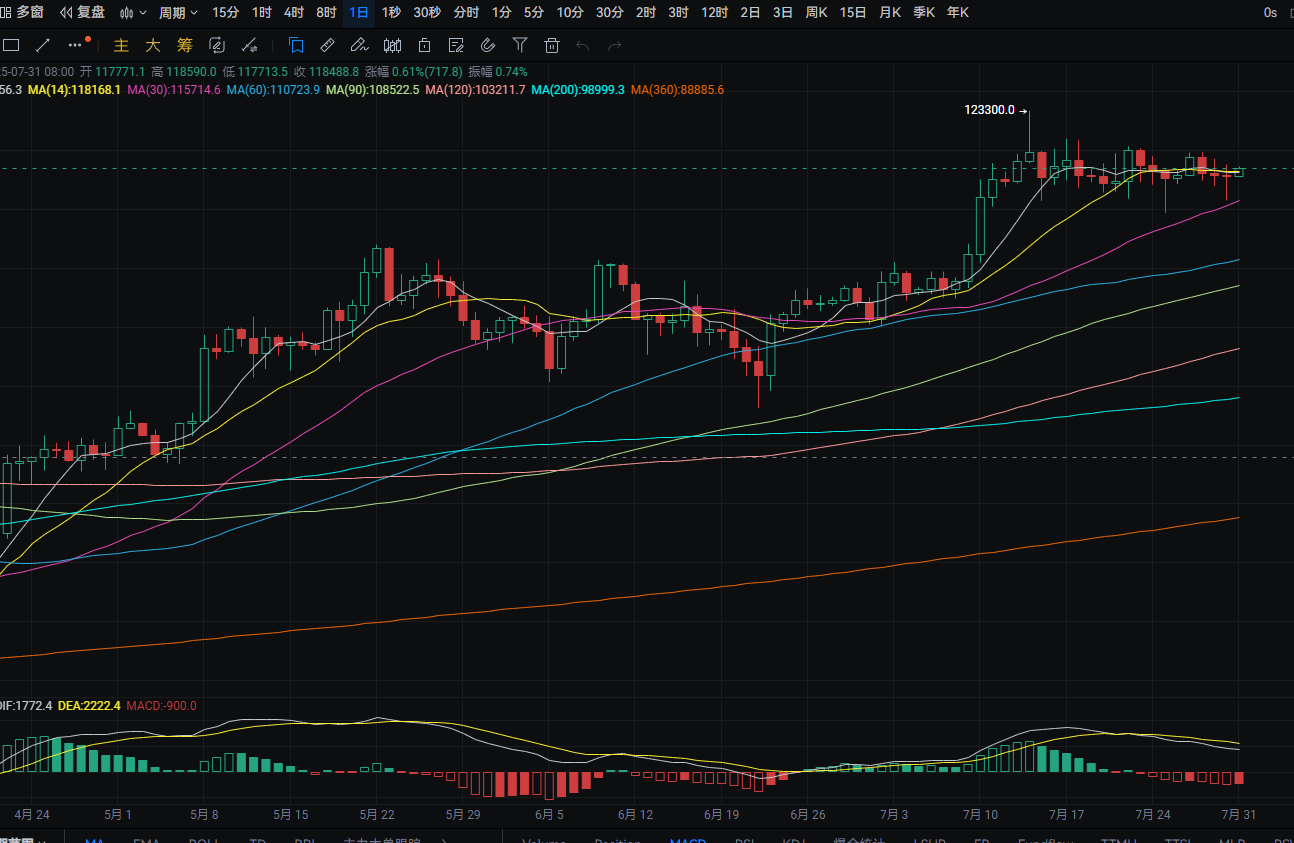
Bitcoin's daily line fell from a high of around 118,750 to a low of around 115,700 yesterday, closing around 117,800. The support level is near the MA30; if it breaks, it could drop to around 114,000. A pullback can be used to buy near this level. The resistance level is around 119,000; if it breaks, it could rise to around 120,400. A rebound to this level can be used to buy. MACD shows increasing bearish momentum. The four-hour support level is around 117,350; if it breaks, it could drop to around 116,400. A pullback can be used to buy near this level. The resistance level is around 118,900; if it breaks, it could rise to around 119,850. A rebound to this level can be used to sell. MACD is stabilizing with dual lines converging.
ETH
Analysis
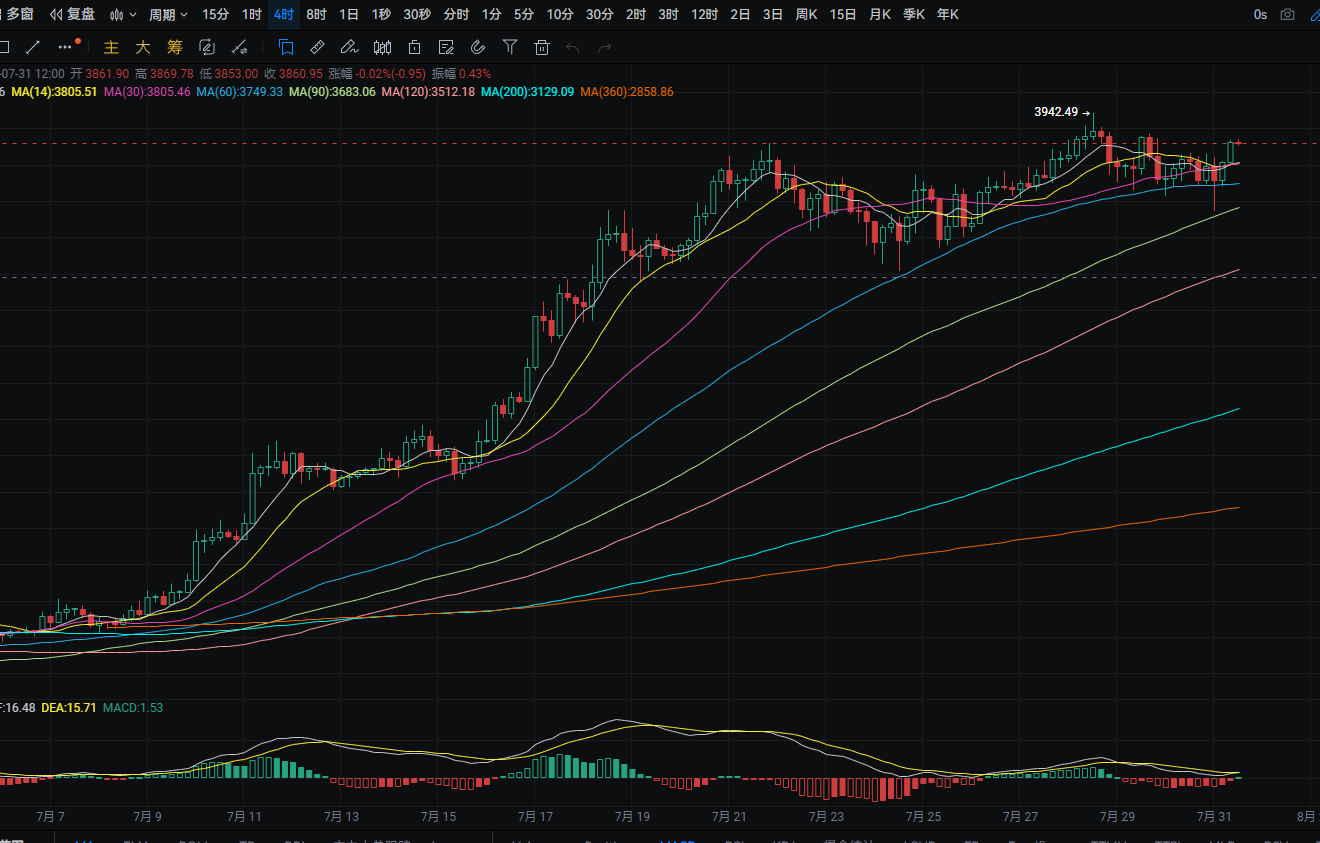
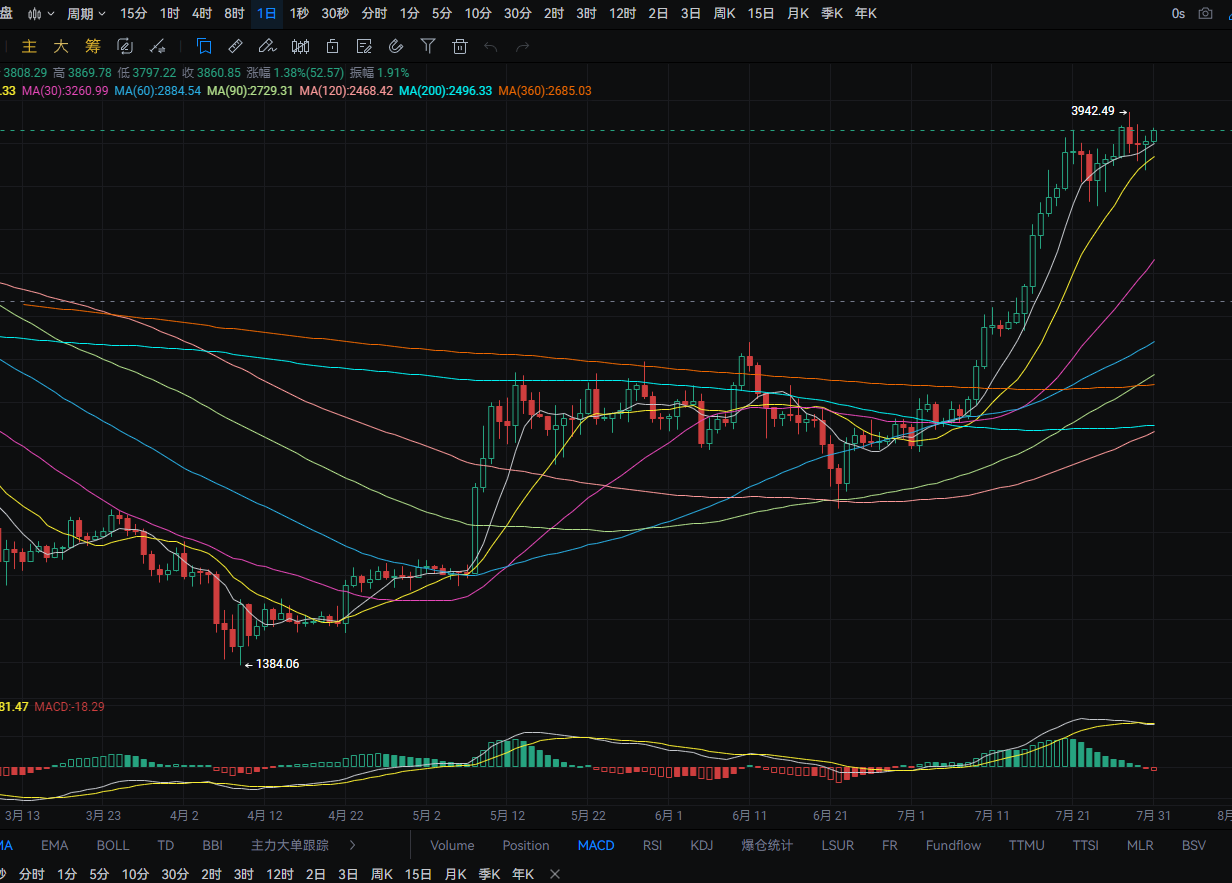
Ethereum's daily line rose from a low of around 3,675 to a high of around 3,835 yesterday, closing around 3,810. The support level is near the MA14; if it breaks, it could drop to around 3,590. A pullback can be used to buy near this level. The resistance level is around 3,885; if it breaks, it could rise to around 4,000. A rebound to this level can be used to sell. MACD shows increasing bearish momentum forming a death cross. The four-hour support level is near the MA60; if it breaks, it could drop to the MA90. A pullback can be used to buy near this level. MACD shows decreasing bearish momentum with signs of forming a golden cross.
Disclaimer: The above content is personal opinion and for reference only! It does not constitute specific operational advice and does not bear legal responsibility. Market conditions change rapidly, and the article has a certain lag. If you have any questions, feel free to consult.
免责声明:本文章仅代表作者个人观点,不代表本平台的立场和观点。本文章仅供信息分享,不构成对任何人的任何投资建议。用户与作者之间的任何争议,与本平台无关。如网页中刊载的文章或图片涉及侵权,请提供相关的权利证明和身份证明发送邮件到support@aicoin.com,本平台相关工作人员将会进行核查。


