The fluctuations in the cryptocurrency market are like the waves in a turbulent sea, making people feel anxious. However, its charm lies in the fact that it never looks at your past report card. Stop saying "I'll enter the market when it stabilizes"; opportunities in the crypto world never lie in "stability." The real dividends always belong to those who dare to position themselves amid uncertainty. Market volatility is not a risk; failing to understand trends is the biggest risk.
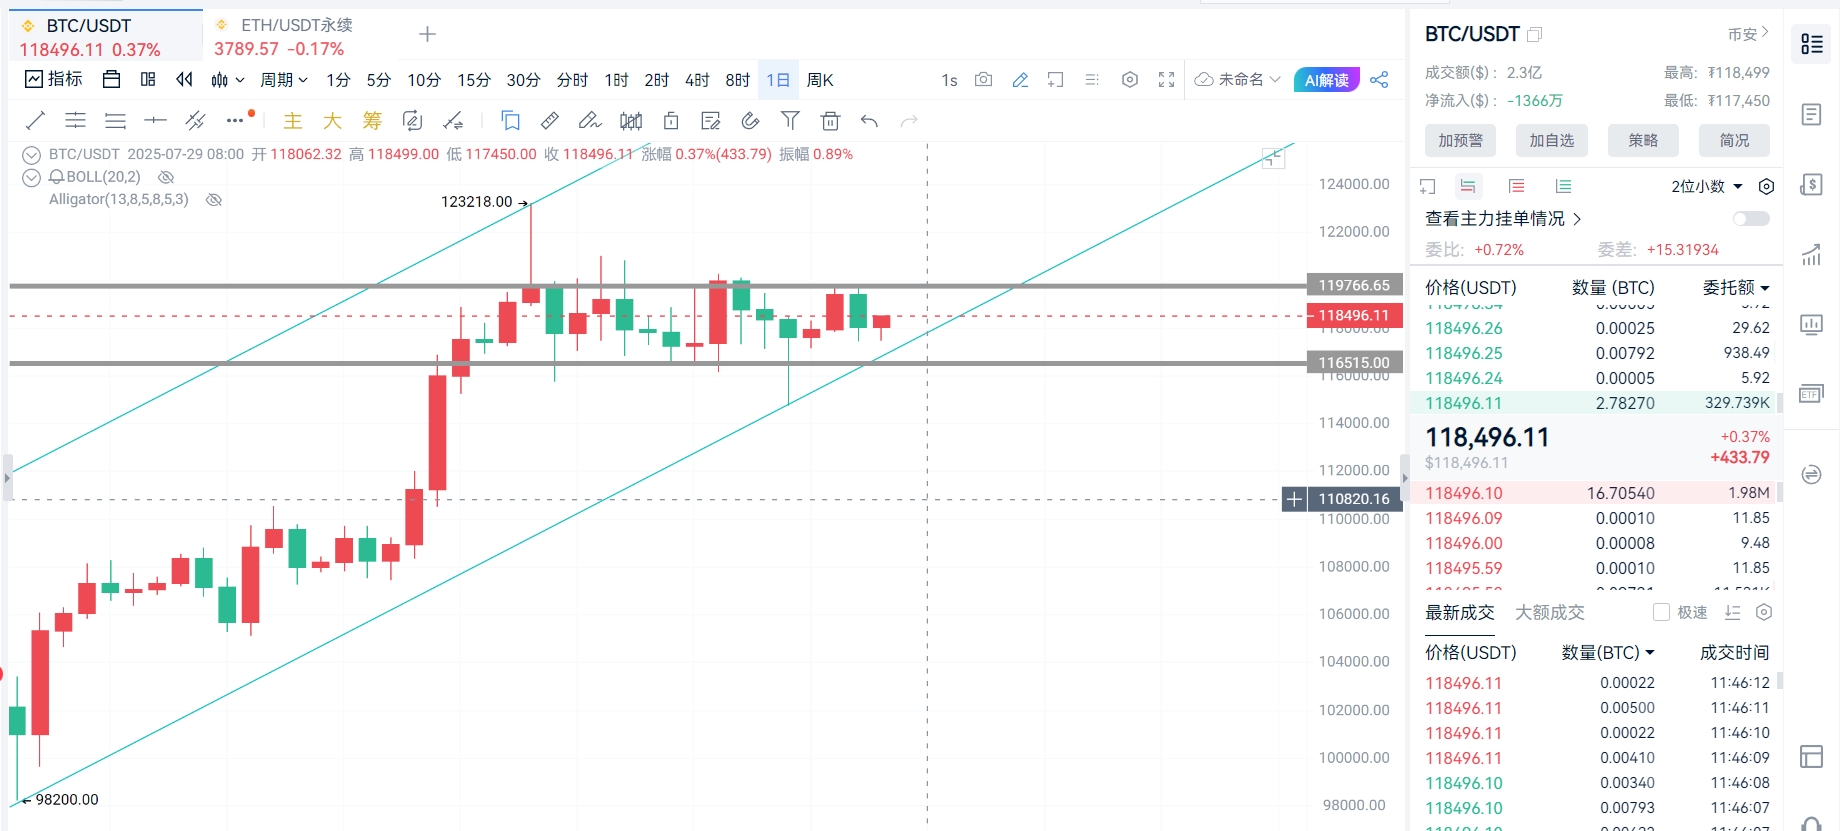
Yesterday, Bitcoin reached a high of 119,800, repeatedly testing the 120,000 mark but failing to break through. From the afternoon to midnight, the price began to retrace, and as of today, it has been fluctuating in the 117,500-118,500 range, with an opening price of about 118,000, and has not yet broken through the key resistance level in the short term. Currently, market trading volume has decreased, and the market is quiet, with the short-term direction yet to be determined. A mid-term upward trend has formed, but it needs to break through the resistance level near $119,500.
From a technical perspective, the current support level for Bitcoin is at 116,500, while the resistance level is at 119,500. On the daily chart, the Bollinger Bands are starting to converge, the MACD momentum is bearish, and the top formation and black three soldiers candlestick pattern suggest a risk of short-term adjustment.
In terms of market dynamics, expectations for the Federal Reserve's interest rate hikes continue to rise, leading to fluctuations in global financial markets, with Bitcoin, as a high-risk asset, under pressure. The institution Galaxy completed an over-the-counter transaction of 80,000 BTC, indicating an inflow of institutional funds, but short-term selling pressure still needs to be monitored. Global trading volume has decreased compared to last week, market sentiment is cautious, and open contracts have reached a historical high, which may exacerbate volatility.
Long position suggestion: Build positions in batches when retracing to the 117,500-118,000 support range, with a stop loss at 117,500 and a target of 119,000-120,000.
Short position suggestion: Lightly short when rebounding to the 119,300-119,500 range, with a stop loss at 120,000 and a target of 117,000.
Today, Ethereum's price is fluctuating at a high level in the 3,730-3,850 range, currently around 3,780, and may face selling pressure in the short term.
From a technical perspective, the support level for Ethereum is at 3,650, while the strong resistance level has reached 3,950. The MACD has formed a death cross at a high level, the RSI has entered the overbought zone, and the double top pattern risk is emerging. If it falls below $3,735, it may trigger a technical stop loss.
In terms of market dynamics, the Ethereum 2.0 upgrade is approaching, which may improve network efficiency, but short-term liquidity tightening could affect prices. Abraxas Capital has increased its holdings by 242,000 ETH, pushing its investment return rate close to 50%, but caution is needed for profit-taking. The U.S. SEC's tightening regulatory stance on cryptocurrencies may trigger market volatility.
Long position suggestion: Enter when retracing to the 3,730-3,700 support area, with a stop loss at 3,670 and a target of around 3,780-3,850.
Short position suggestion: Lightly short when rebounding to 3,820-3,850, with a stop loss at 3,880 and a target of around 3,700-3,650.
Looking at the overall market trend, Bitcoin is experiencing intense short-term long and short battles. If it falls below 117,500, it may test 116,500; if it breaks through 119,500, it may restart the upward trend. Ethereum needs to pay attention to the effectiveness of the 3,730 support; if it breaks below, it may form a double top pattern, while breaking above 3,850 could challenge 4,000.
Due to the time-sensitive nature of price levels, there may be delays in post reviews, so specific operations should be based on real-time market conditions. The above operational range analysis is for reference only; the cryptocurrency market is highly risky, so please manage your risk well and make cautious decisions when investing. If you are interested in specific indicator analysis or the impact of new market dynamics on prices, feel free to scan the QR code for the public account in the article below. You are welcome to visit.

免责声明:本文章仅代表作者个人观点,不代表本平台的立场和观点。本文章仅供信息分享,不构成对任何人的任何投资建议。用户与作者之间的任何争议,与本平台无关。如网页中刊载的文章或图片涉及侵权,请提供相关的权利证明和身份证明发送邮件到support@aicoin.com,本平台相关工作人员将会进行核查。


