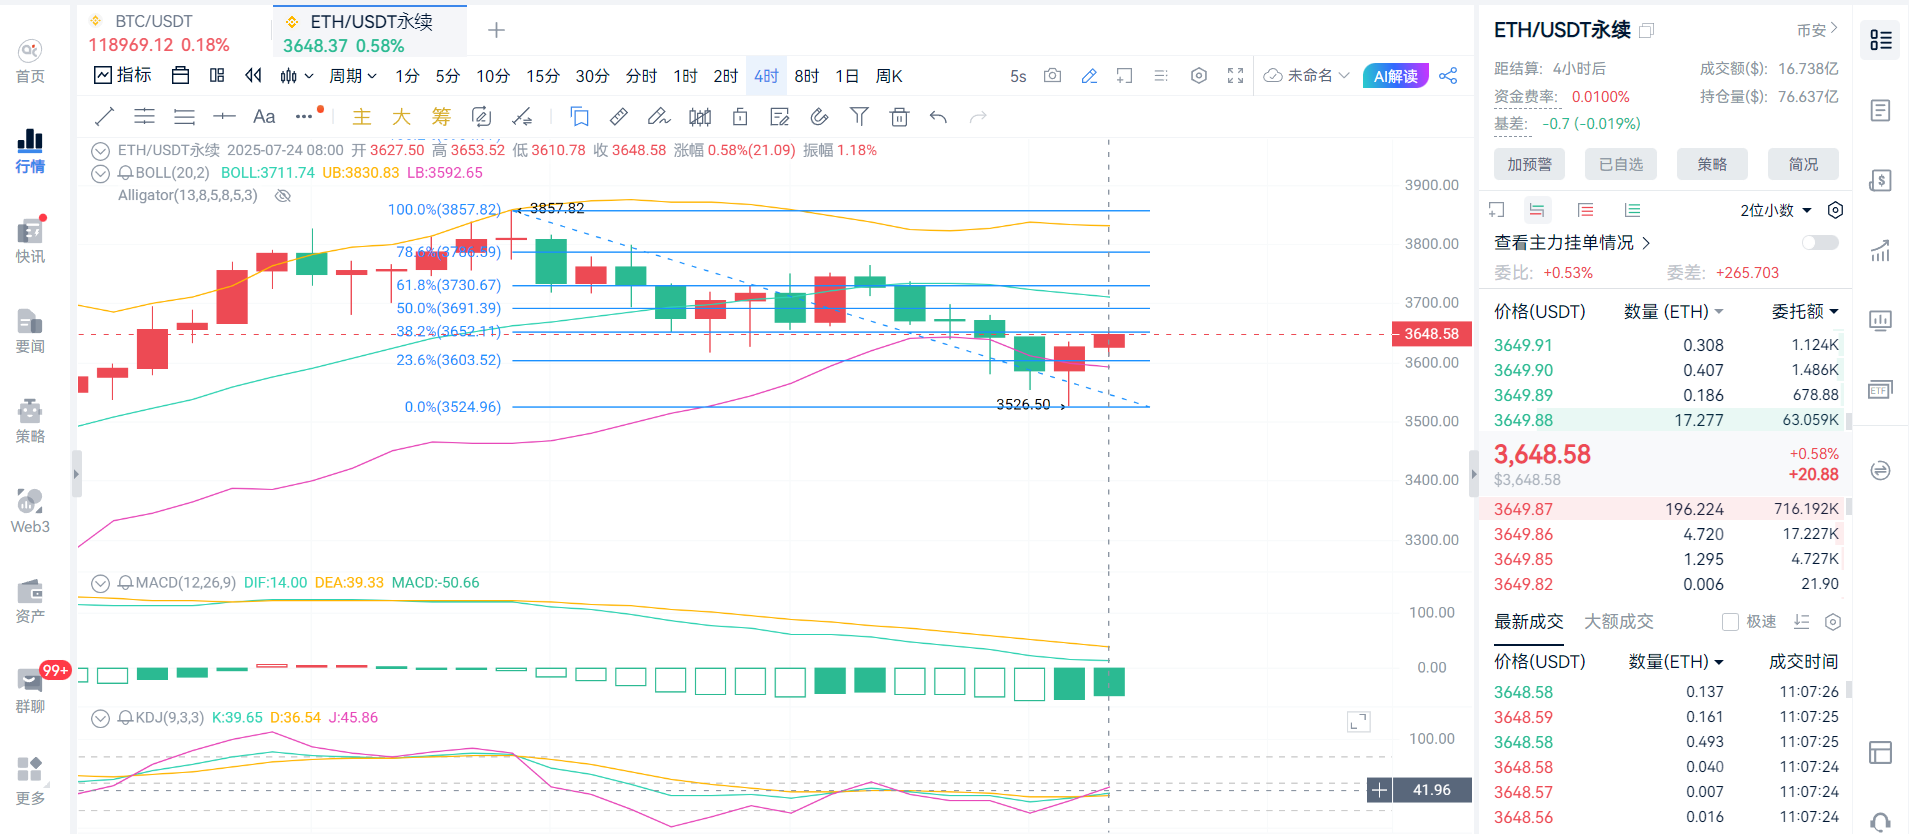
Today, the price of AICoin has shown a complex wave trend. The current price is around $3650. In the past 24 hours, the price experienced a process of rising first, then falling, and finally stabilizing. During the early trading session, the price quickly surged, reaching a high of $3650, but was then suppressed by bearish forces, causing the price to fluctuate and retreat, stabilizing in the afternoon near the current level. From the perspective of intraday trading volume, the trading volume increased moderately during the price rise in the early session, indicating active entry by bulls; while during the price decline phase, the trading volume also increased, suggesting significant divergence between bulls and bears.
From a technical indicator analysis, the 4-hour K-line chart shows that the MACD histogram is above the zero axis but shows signs of gradually shortening, indicating that while bullish forces dominate, momentum is weakening. The KDJ indicator has retreated after being in the overbought zone, with the current value around 50, indicating a short-term need for market correction.
AICoin price operation suggestions: Focus on a range trading strategy in the short term, and follow the trend if key levels are broken.
Short position opportunity: Lightly short near $3700 on a rebound, with a stop loss at $3730 and a target of $3630-3600.
Long position opportunity: Gradually accumulate on a pullback to $3550-3580, with a stop loss at $3520 and a target of $3650-3700.
Given the recent high volatility in the market, it is recommended that investors strictly set stop losses and take profits to avoid blindly chasing highs and cutting losses.
Due to the time-sensitive nature of price points, there may be delays in post review, so specific operations should be based on real-time market conditions. The above operational range analysis is for reference only. The cryptocurrency market is highly risky, so please manage your risk well and make cautious decisions when investing. If you are interested in specific indicator analysis or the impact of new market dynamics on prices, feel free to scan the QR code for the public account in the article below. You are welcome to visit.

免责声明:本文章仅代表作者个人观点,不代表本平台的立场和观点。本文章仅供信息分享,不构成对任何人的任何投资建议。用户与作者之间的任何争议,与本平台无关。如网页中刊载的文章或图片涉及侵权,请提供相关的权利证明和身份证明发送邮件到support@aicoin.com,本平台相关工作人员将会进行核查。


