
The market, project, currency, and other information, opinions, and judgments mentioned in this article are for reference only and do not constitute any investment advice.
BTC Price Trend
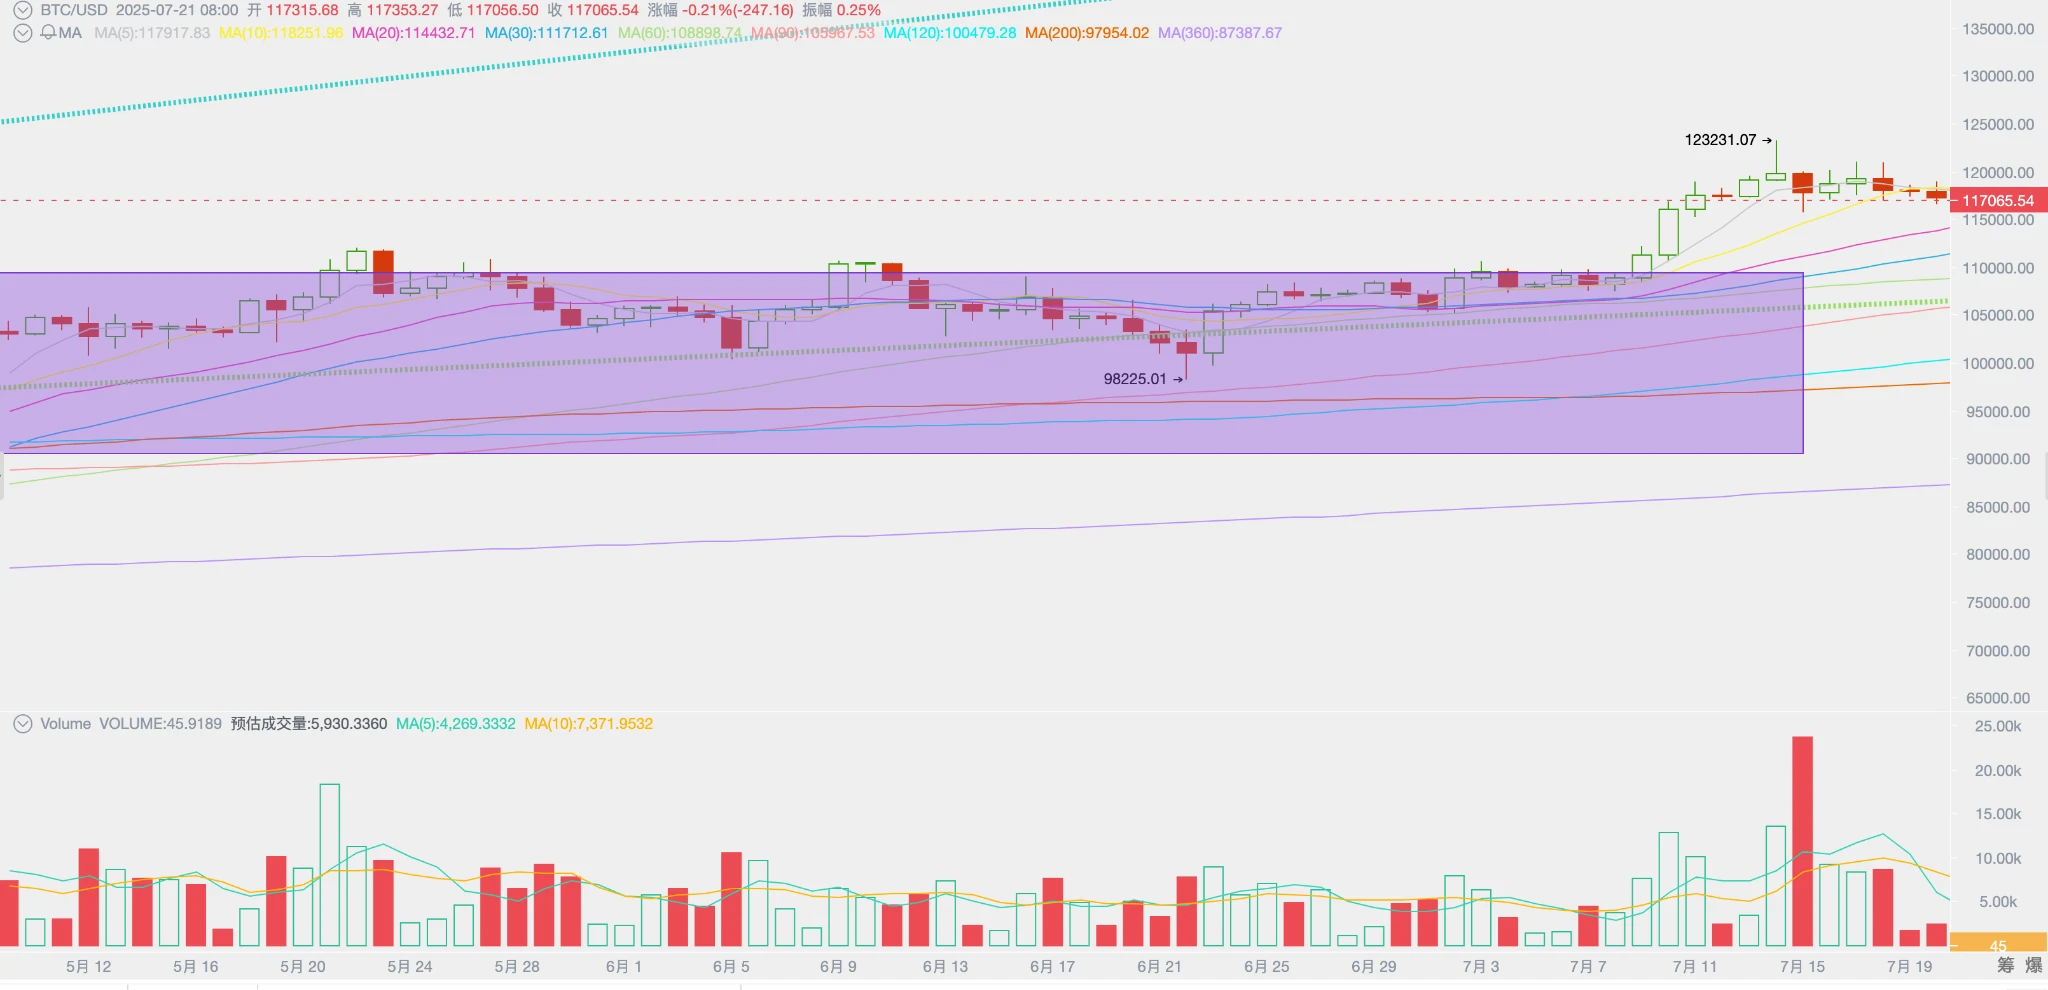
BTC opened this week at $119,130.81 and closed at $117,312.70, down 1.53%, with a high of $123,231.07 and a low of $115,697.00, showing a volatility of 6.32% and a significant increase in trading volume.
US macroeconomic data maintains expectations for a rate cut in September. Driven by bullish sentiment, both off-exchange and on-exchange funds are actively buying, forming an upward force that pushes BTC to new highs. It is expected that this pre-rate cut speculative trading will continue in the short term.
As BTC breaks through historical highs, funds are rotating, and Altseason is starting again. BTC's market share dropped significantly by 4.83% in a single week, falling to 61.5%.
At the same time, after BTC reached a new high of $120,000, long-term investors continued their periodic reduction, providing selling pressure to the market and suppressing price increases.
Another factor to be cautious about is "reciprocal tariffs." The market currently prices tariffs to end with a lower rate increase, which will not have a significant impact on US inflation. However, the inconsistency of Trump's decisions makes it difficult to confirm conclusions at this time. Nevertheless, this uncertainty is likely to be largely settled by the August 1 deadline.
Policy, Macro Finance, and Economic Data
Last week, we highlighted the CPI data to watch, which did not exceed expectations this week.
On July 15, the US announced that the seasonally adjusted CPI year-on-year rate for the end of June was 2.7%, in line with expectations, while the seasonally adjusted core CPI year-on-year rate for the end of June was 2.9%, below the expected 3.0%.
The data met expectations, so the market did not react significantly. However, CPI has indeed started to rebound, and aside from the short-term rise in oil prices caused by the "Israel-Palestine conflict," tariffs have also played a role. A second wave of mild inflation has occurred, but it is not enough to force the Federal Reserve to adopt a hawkish stance. Whether the subsequent impact of tariffs will continue to amplify needs to be monitored carefully.
On July 16, US PPI data showed that the June PPI year-on-year rate was 2.3%, below the expected 2.5% and the previous value of 2.7%, indicating signs of economic cooling.
The subtle changes in data have led to a decline in the probability of a rate cut in September according to FedWatch, with the current probability just exceeding 50%.
Uncertainty in politics and trade remains high. On July 11, the Trump administration raised the unified tariff on Canada to 35% and subsequently issued a "circular" to the EU, Mexico, and twenty-three countries with tariffs as high as 20-50%, all set to take effect on August 1. Meanwhile, the $3.4 trillion "Big and Beautiful Act" is entering Senate review, and if finalized, the ten-year deficit rate could be pushed up to 9%, exacerbating the risk of "stagflation" due to tariff inflation and dual expansion of fiscal and monetary policies.
As economic data met expectations, US stocks continued to rise, with the Nasdaq and S&P 500 up 1.51% and 0.59%, respectively, while the Dow Jones fell slightly by 0.07%.
After a continuous decline, the US dollar index rebounded by 0.64% to 98.46, achieving a two-week consecutive rebound. Both short and long-term US Treasury yields remained relatively stable. Gold saw a slight decline.
Against the backdrop of data largely meeting expectations and a slight decrease in rate cut expectations, BTC adjusted slightly after reaching a historical high, down 1.53%.
Crypto Market
This week, the Crypto market achieved another historic breakthrough.
On July 17, the US House of Representatives approved three major Crypto bills in one go—the "GENIS Act," "CLARITY Act," and "Anti-CBDC Act." The "CLARITY Act" and "Anti-CBDC Act" have been submitted to the Senate for review, while the "GENIS Act" was quickly signed by Trump the next day, marking the formal entry of US stablecoins into a compliant era, and indicating that beyond store of value, stablecoins are becoming the second major use case in the crypto world.
Benefiting from this positive news, ETH rebounded sharply, rising over 20% in a week, and reigniting Altseason.
From a technical perspective, BTC is currently positioned above the "Trump bottom," between the first and second upward trend lines of the bull market.
Due to the rush to pass the three major bills last week, BTC surged by 9.08%. This week, BTC chose to adjust at a high level, accompanied by an increase in selling volume from long hands. However, with corporate purchases and retail investors flowing in through the Spot ETF channel, BTC is likely to continue upward after the adjustment.
Capital Inflows and Selling
With BTC and stablecoins gaining legislative support in the US, publicly listed companies have become significant buyers in the crypto market.
According to media outlet Coindesk, in the second quarter, public companies have surpassed the BTC Spot ETF channel to become the largest buyers of BTC. Their purchasing speed has significantly increased since December last year, coinciding with the election of pro-Crypto Trump as US president.
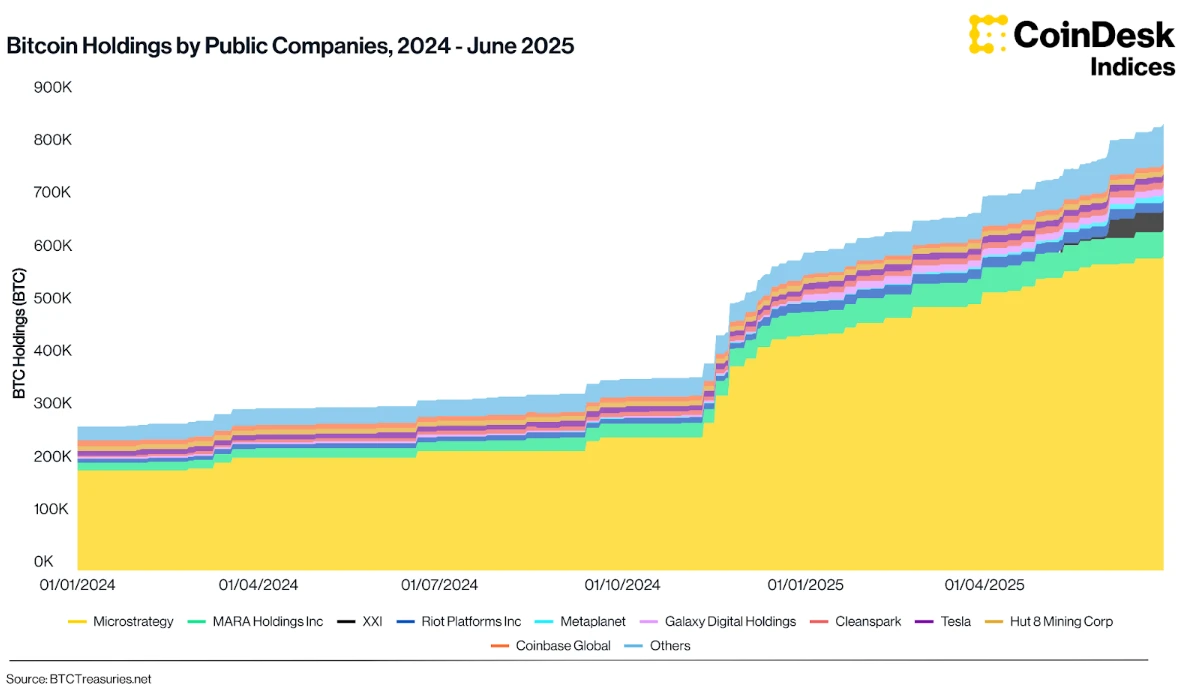
Statistics on BTC Holdings by Public Companies
Currently, the range of Crypto reserves held by publicly listed companies has expanded from BTC to include Altcoins and even MEME Coins. This has cleared logical barriers for the opening of Altseason and provided financial and emotional support.
This week, the funds flowing into the market through the BTC Spot ETF amounted to $2.359 billion, while the ETH Spot ETF channel reached $2.258 billion. Notably, on July 17 and 18, the inflow of funds through the ETH Spot ETF channel exceeded that of the BTC Spot ETF, marking a historic significance.
As BTC embarks on its fourth wave of increases, and with the heightened enthusiasm of public companies and US retail investors, long hands have initiated significant selling.
On-chain data from eMerge Engine shows that over 150,000 BTC moved from long hands last week. In terms of exchanges, both long and short hands sold a total of 190,000 BTC, with the selling scale significantly increasing.
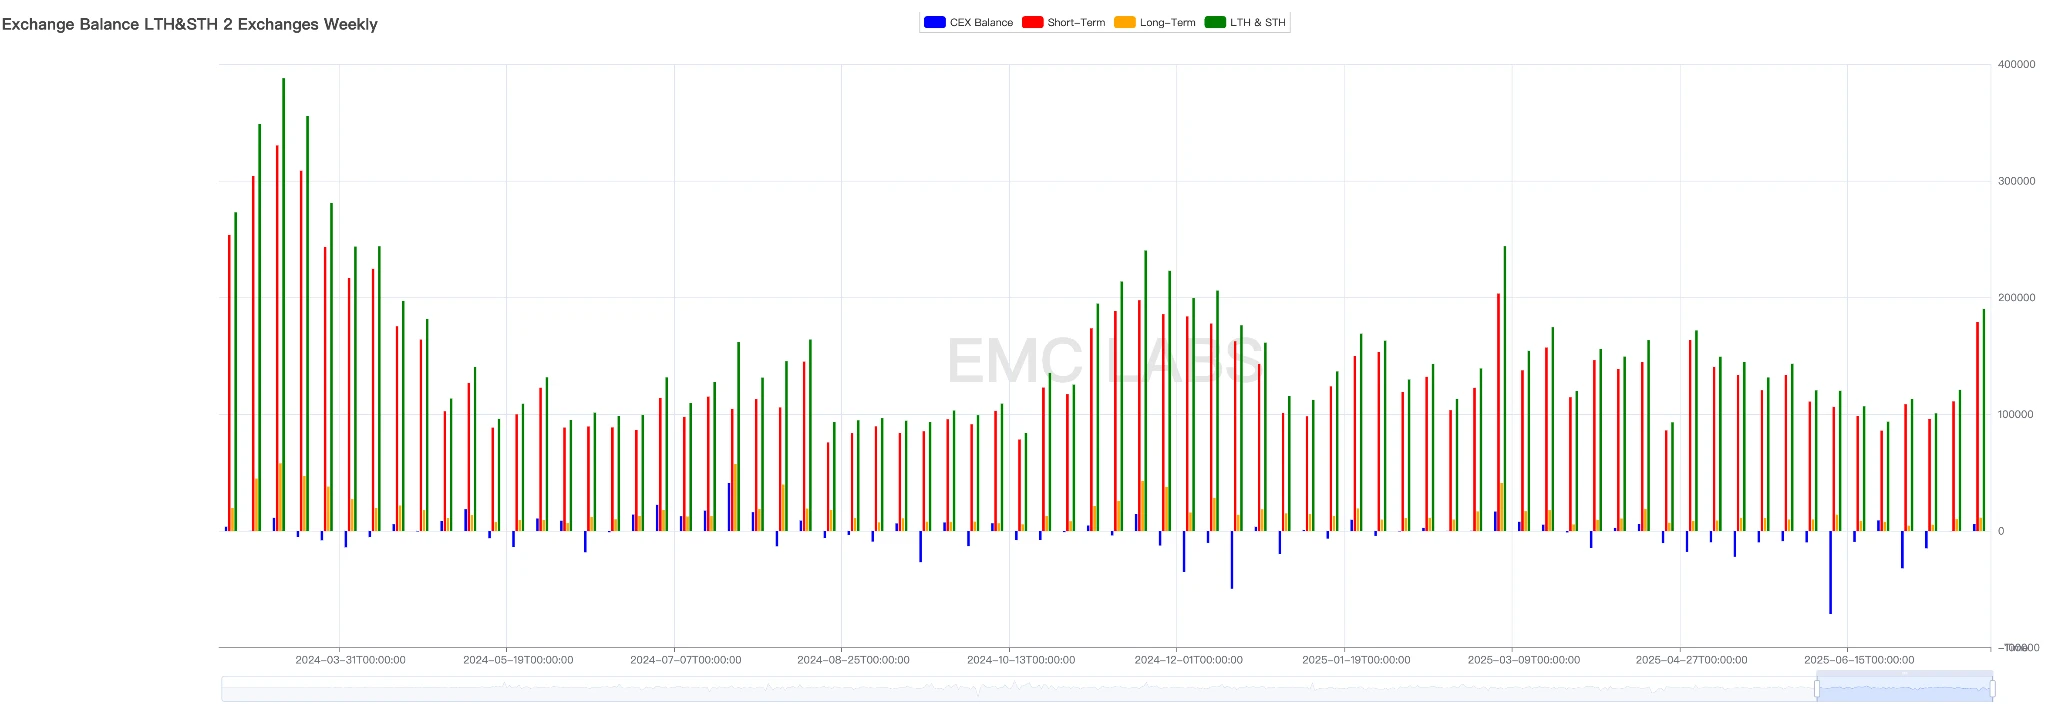
Weekly Selling Statistics of Long and Short Hands
In the progress of the bull market, long hands will continue to sell, which aligns with historical patterns. The impact on price and trends depends on the buying power's absorption of the selling pressure. This point needs to be closely monitored in the future.
Cycle Indicators
According to eMerge Engine, the EMC BTC Cycle Metrics indicator is at 0.5, indicating an upward phase.
EMC Labs
EMC Labs was established in April 2023 by crypto asset investors and data scientists. It focuses on blockchain industry research and investments in the crypto secondary market, with industry foresight, insights, and data mining as its core competencies, aiming to participate in the thriving blockchain industry through research and investment, promoting the benefits of blockchain and crypto assets for humanity.
For more information, please visit: https://www.emc.fund
免责声明:本文章仅代表作者个人观点,不代表本平台的立场和观点。本文章仅供信息分享,不构成对任何人的任何投资建议。用户与作者之间的任何争议,与本平台无关。如网页中刊载的文章或图片涉及侵权,请提供相关的权利证明和身份证明发送邮件到support@aicoin.com,本平台相关工作人员将会进行核查。


