Cryptocurrency News
Hot Topics on July 13:
1. Google invests $2.4 billion to acquire the technology licensing of AI programming startup Windsurf and hires its CEO.
2. Kraken will airdrop compensation to users who missed the PUMP subscription due to system limitations.
3. Bybit: The PUMP token sale was oversubscribed due to API delays, and users who did not win will receive refunds.
4. 189 addresses hit the maximum limit of $1 million during the PUMP public sale.
5. Federal Reserve research scholars: The White House is creating legal reasons for Powell's resignation.
Trading Insights
Finding the right entry timing during trading is the biggest challenge. Today, I will share five trading entry logics. The same structure, different perspectives, which I believe can help you! 1. Trendline entry to catch rhythm continuation → An upward trendline indicates that the bullish rhythm is intact; as long as it doesn't break, there is gaming value. 2. Horizontal support entry to observe range boundaries → The market's repeated return points are the balance points between bulls and bears; a pullback confirmation is a second opportunity. 3. Fibonacci 0.618 retracement entry to bet on inertia adjustment → Most pullbacks stop at the golden ratio, essentially a probability game of "resting after a rise." 4. Candlestick pattern entry to read market intentions → Patterns like engulfing and hammers directly express bullish or bearish attitudes, capturing immediate reactions. 5. Multiple signal overlap entry to seek probability resonance → Clues like trendlines, horizontal lines, and candlesticks overlapping at the same position approach the "maximum probability." There is no right or wrong in these five logics; it only depends on your chosen market observation perspective.
LIFE IS LIKE
A JOURNEY ▲
Below are the real trading signals from the Big White Community this week. Congratulations to the friends who followed along. If your operations are not going smoothly, you can come and try your luck.
Data is real, and each trade has a screenshot from the time it was issued.
**Search for the public account: *Big White Talks About Coins*
BTC
Analysis
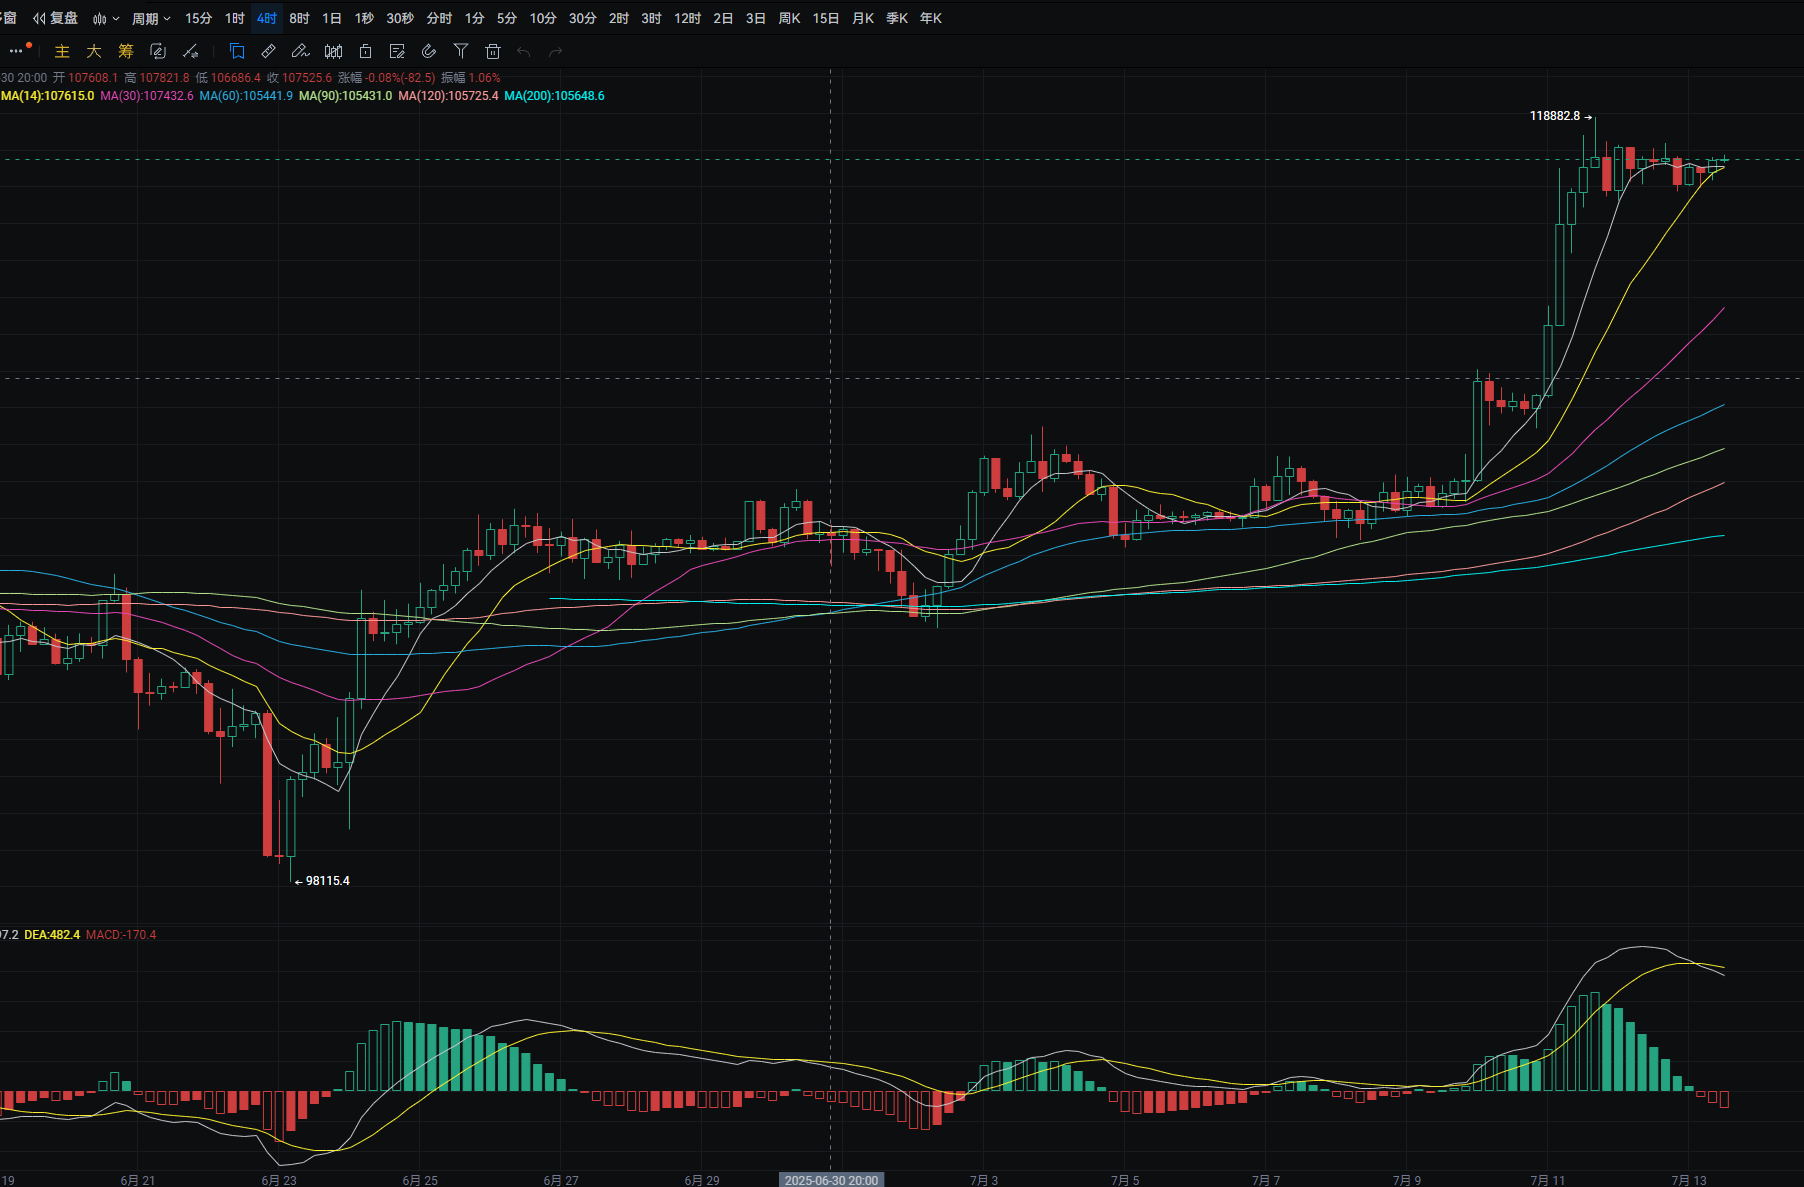
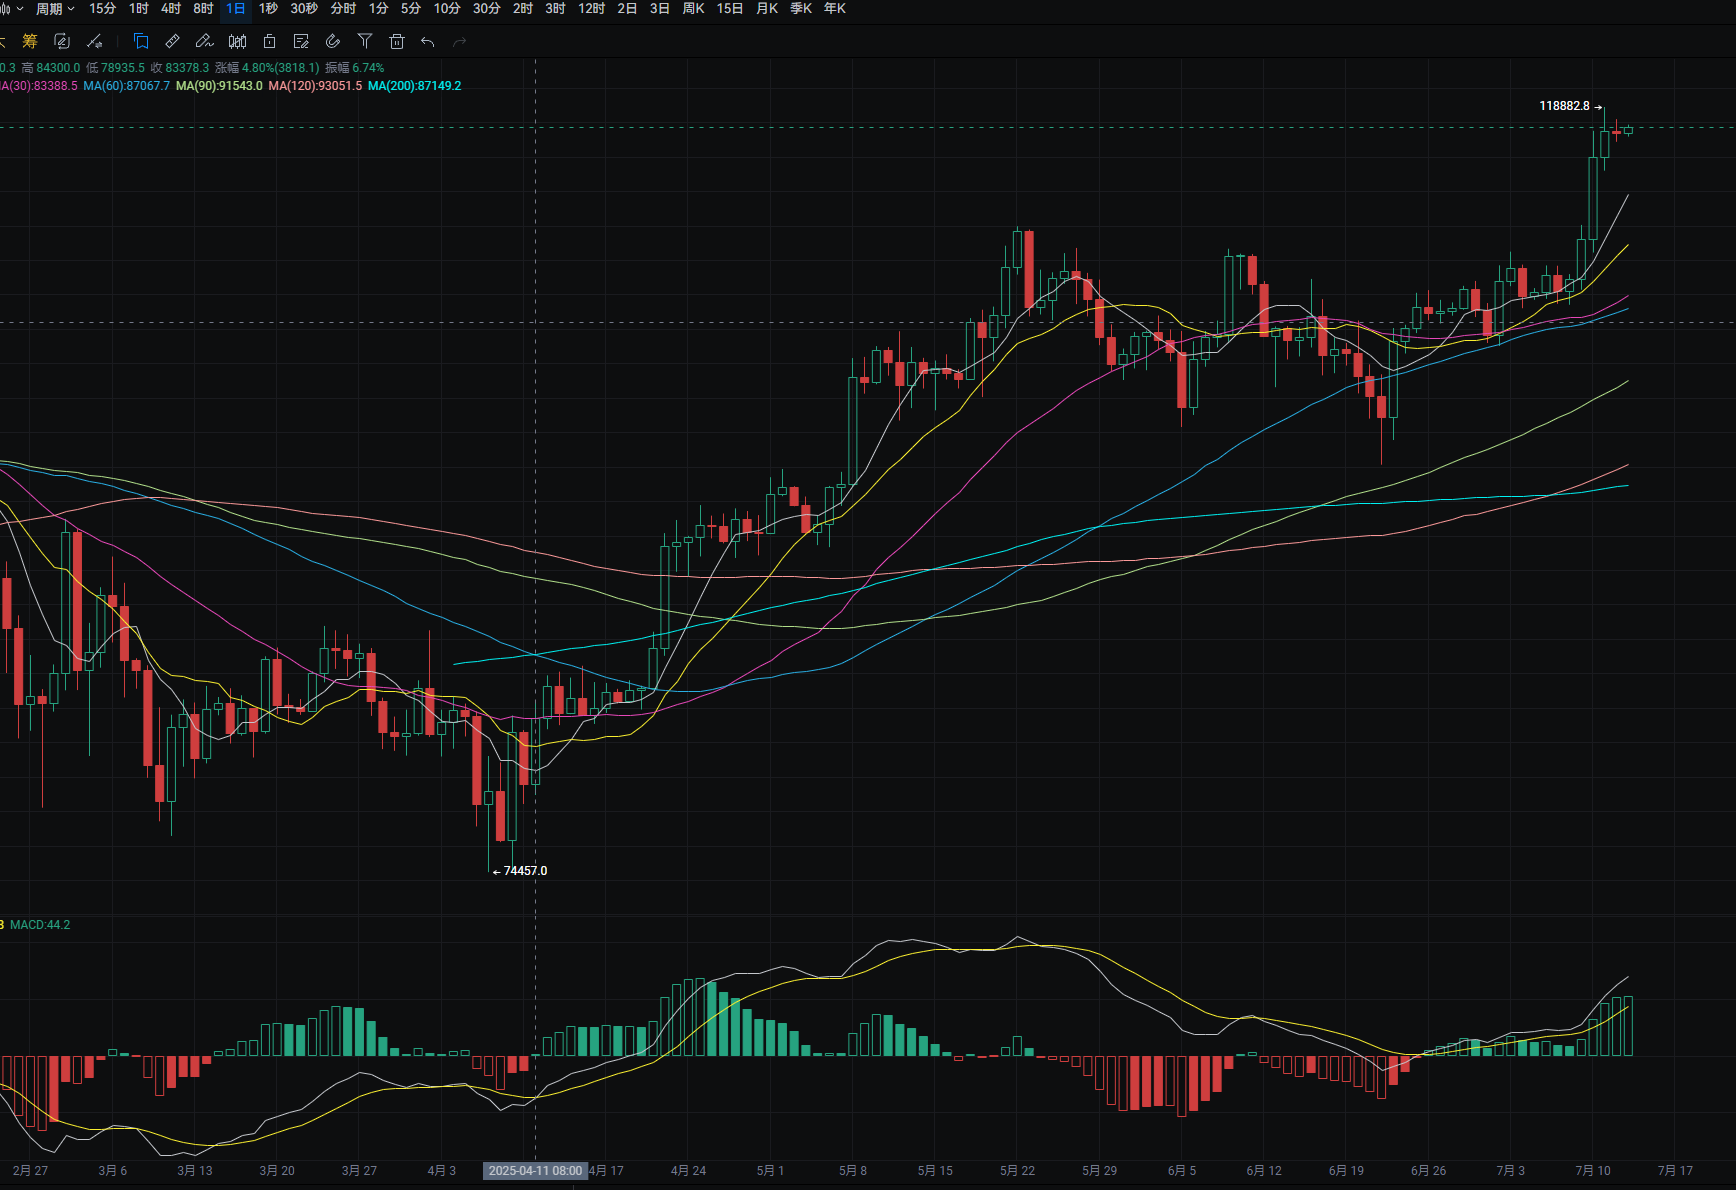
Bitcoin's daily line fell from a high of around 118,150 to a low of around 116,850 yesterday, closing around 117,400. The support level is near the MA7 moving average; if it breaks, it can be seen near MA14. A pullback can be used to buy near this level. The upper side can look for new highs again. MACD shows bullish increment. The four-hour support is near MA30; if it breaks, it can be seen near MA60. A pullback can be used to buy near this level. MACD shows bearish increment, forming a death cross.
ETH
Analysis
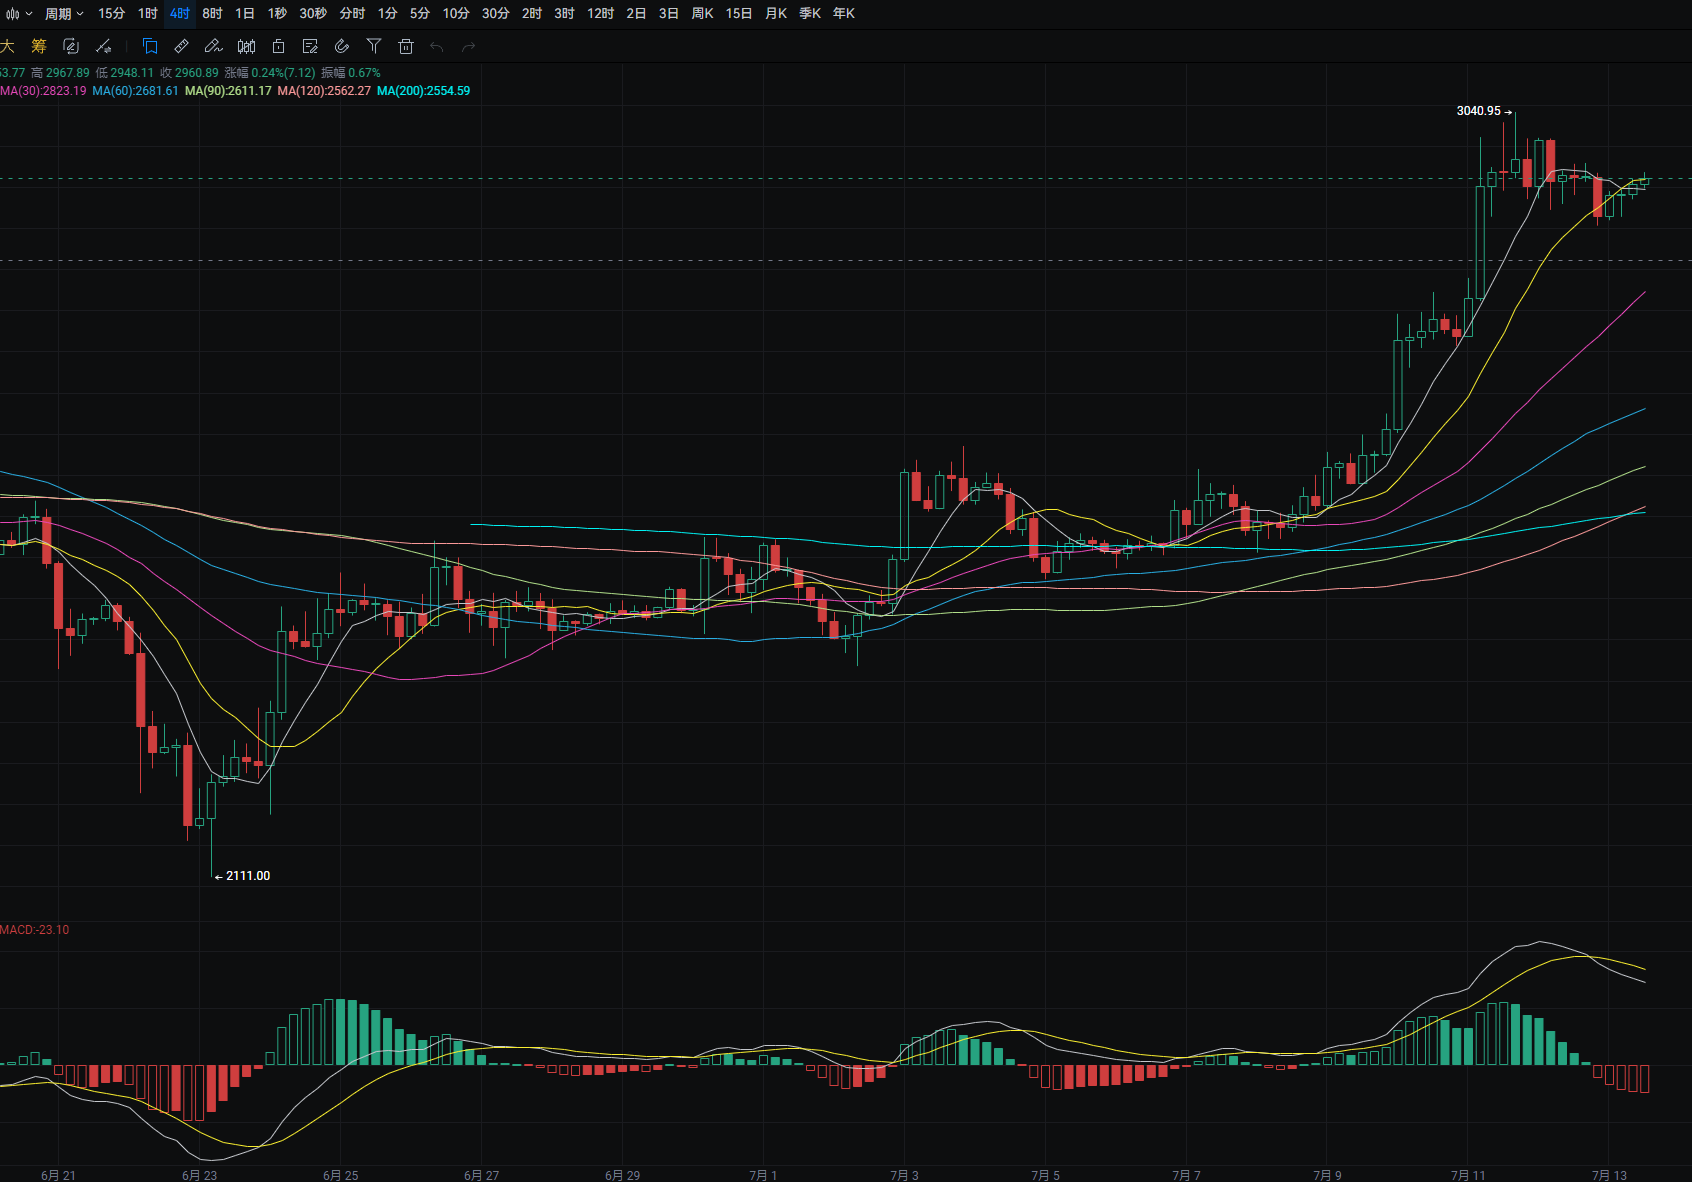
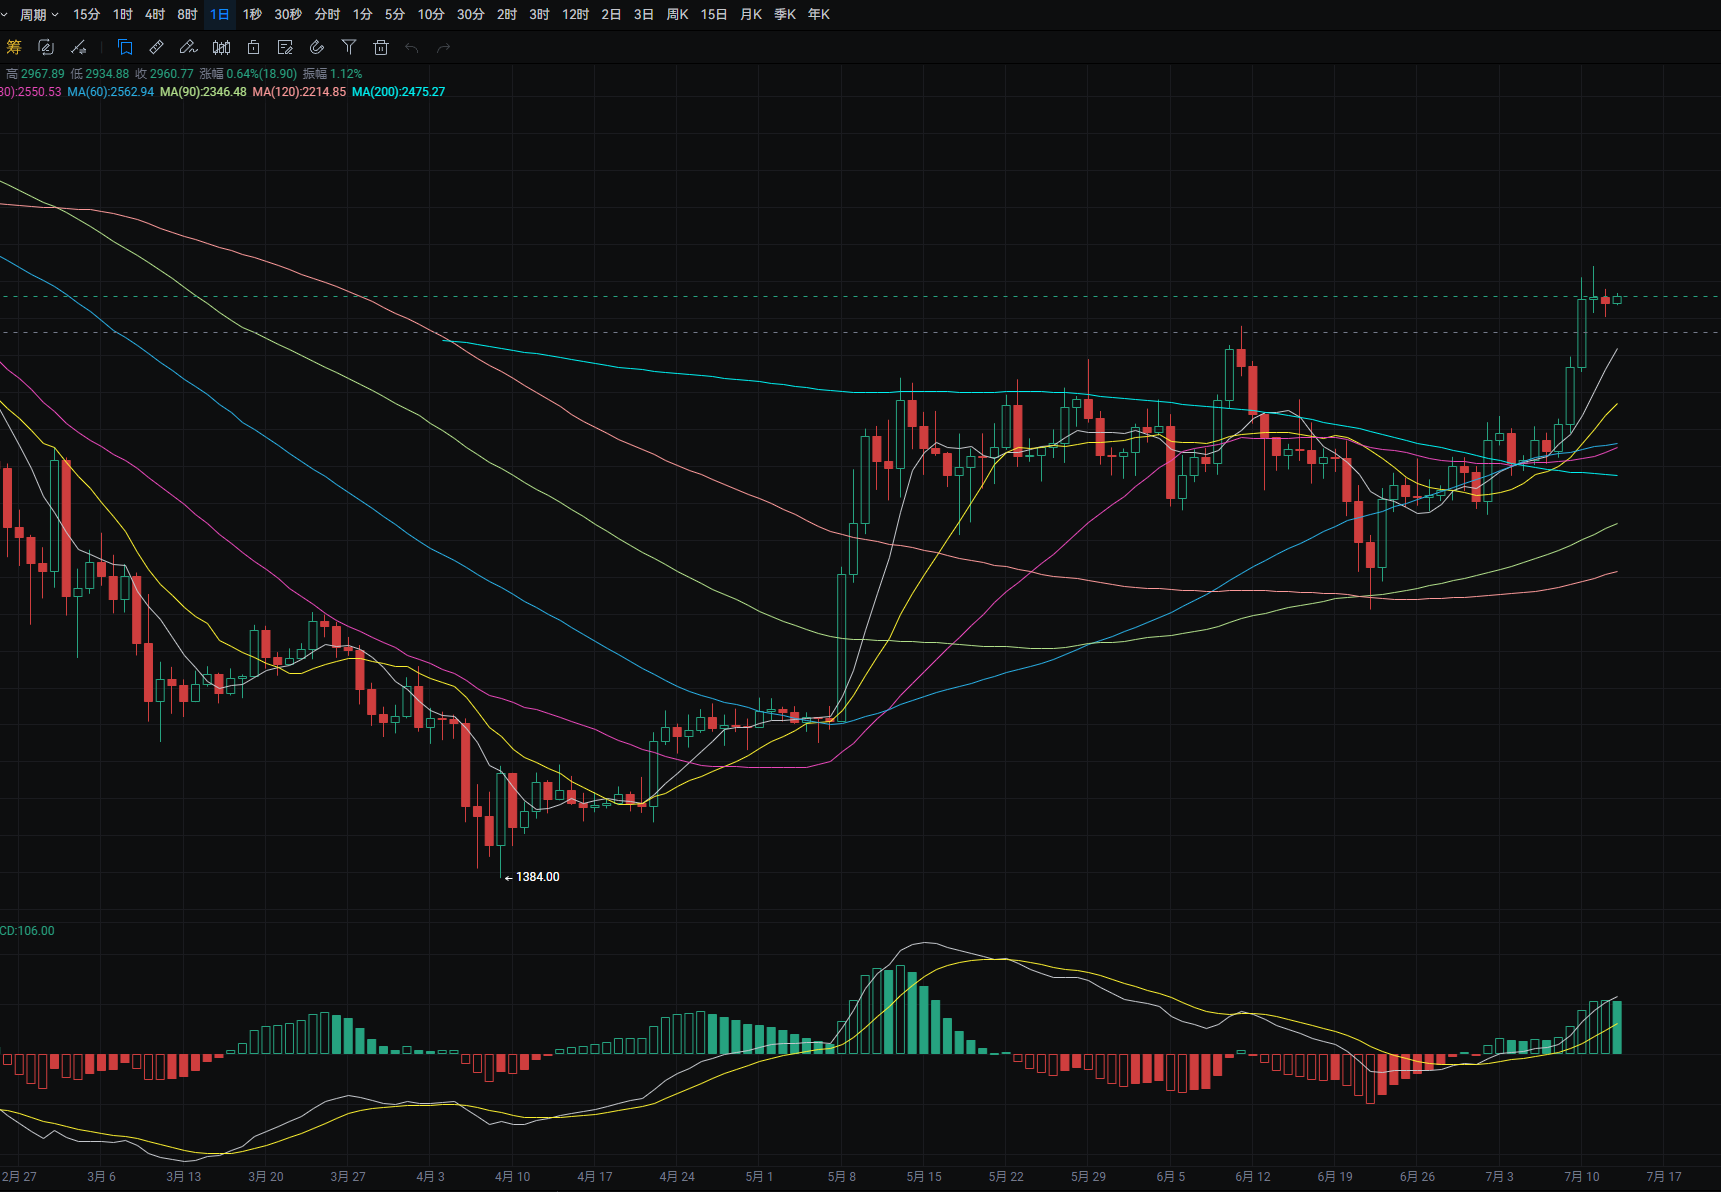
Ethereum's daily line fell from a high of around 2,980 to a low of around 2,900 yesterday, closing around 2,940. The support level is near the MA7 moving average; if it breaks, it can be seen near MA14. A pullback can be used to buy near this level. The upper pressure level is around 3,005; if it breaks, it can be seen near 3,140. A rebound to this level can be used to sell. MACD shows bullish increment. The four-hour support is near 2,915; if it breaks, it can be seen near MA30. A pullback can be used to buy near this level. MACD shows bearish increment, forming a death cross.
Disclaimer: The above content is personal opinion and for reference only! It does not constitute specific operational advice and does not bear legal responsibility. Market conditions change rapidly, and the article has a certain lag. If you have any questions, feel free to consult.
免责声明:本文章仅代表作者个人观点,不代表本平台的立场和观点。本文章仅供信息分享,不构成对任何人的任何投资建议。用户与作者之间的任何争议,与本平台无关。如网页中刊载的文章或图片涉及侵权,请提供相关的权利证明和身份证明发送邮件到support@aicoin.com,本平台相关工作人员将会进行核查。


