This article is from: hoeem (@crypthoem)
Translation | Odaily Planet Daily (@OdailyChina); Translator | Azuma (@azuma_eth)
Editor's Note: As BTC hits a new historical high and ETH strongly breaks through the $3000 mark, the market shows signs of accelerating upward momentum. Analyzing the reasons for the rise, the topic of interest rate cuts cannot be overlooked. This morning, two Federal Reserve officials once again provided positive signals regarding rate cut expectations.
San Francisco Fed President Daly stated last night: “I think there may be two rate cuts; however, there is uncertainty in everyone's expectations, and we are considering implementing rate cuts in the fall.”
Federal Reserve Governor and potential next chair candidate Waller stated that even if the June employment data is strong, the Fed should still consider a rate cut at the July meeting — “I have made my point clear. The current policy interest rate is too high, and we can discuss lowering the benchmark rate in July… When inflation is declining, we do not need to maintain such a tight policy stance; this is the decision-making logic that a central bank should follow.”
However, what does a rate cut mean for the cryptocurrency market? What stage are we currently in within the liquidity cycle? What signals can we observe for future changes? Many market participants lack a clear understanding of these fundamental yet crucial questions. In the following text, cryptocurrency trader hoeem, who has long focused on the macro environment, provides his answers to these questions.
Below is the original content from hoeem, translated by Odaily Planet Daily.
What Stage Are We in the Liquidity Cycle?
Wealth across generations is often created during the transition from tightening to easing. Accurately grasping the position within the liquidity cycle is crucial for investment layout — so what stage are we currently in? Let me tell you the answer.
Even if you dislike macro analysis, you should pay attention to changes in the liquidity cycle because central bank liquidity is the lubricant for the global economic engine. Too much added, and the market will overheat; too much withdrawn, and the pistons will seize up, and your good life will soon follow. If you can accurately track the flow of liquidity, you can position yourself ahead of bubbles and crashes.
2021-2025, Four Stages of the Liquidity Cycle
Stage One: Massive Liquidity Injection
Time Period: 2020 - 2021;
Fire hydrants fully opened: zero interest rates + unprecedented quantitative easing (QE) + $16 trillion in fiscal stimulus;
Global money supply (M2) growth reached a post-World War II high.
Stage Two: Massive Liquidity Withdrawal
Time Period: 2021 - 2022;
500 basis points of aggressive rate hikes + quantitative tightening (QT) + expiration of crisis response policies;
The bond market recorded its worst performance in history in 2022 (a decline of about 17%).
Stage Three: Stabilization Period
Time Period: 2022 - 2024;
Policies remain tight but are no longer intensified;
Central banks allow existing policies to take effect to suppress inflation.
Stage Four: Initial Turnaround
Time Period: 2024 - 2025;
A global rate cut cycle begins, restrictions gradually loosen, and although rates remain relatively high, they have started to decline globally.
Our Position in 2025
Standing in mid-2025, one foot is still in the stabilization period, but the other foot has begun to tentatively turn. The current stage still presents a combination of “high interest rates + ongoing quantitative tightening,” but the policy balance has clearly tilted towards easing, unless a new shock pulls us back into the "massive liquidity injection" mode.
For more details, see the “Traffic Light Quick Reference Table” below — I used ChatGPT to organize this content into a more intuitive table, which can help you clearly see the liquidity comparisons for 2017, 2021, and 2025.
- Note from Odaily: In the chart below, “🔴” indicates inactive, “🟠” indicates lightly activated, and “🟢” indicates strongly activated. Additionally, it should be noted that the last leverage item will control the other 11 leverage items.
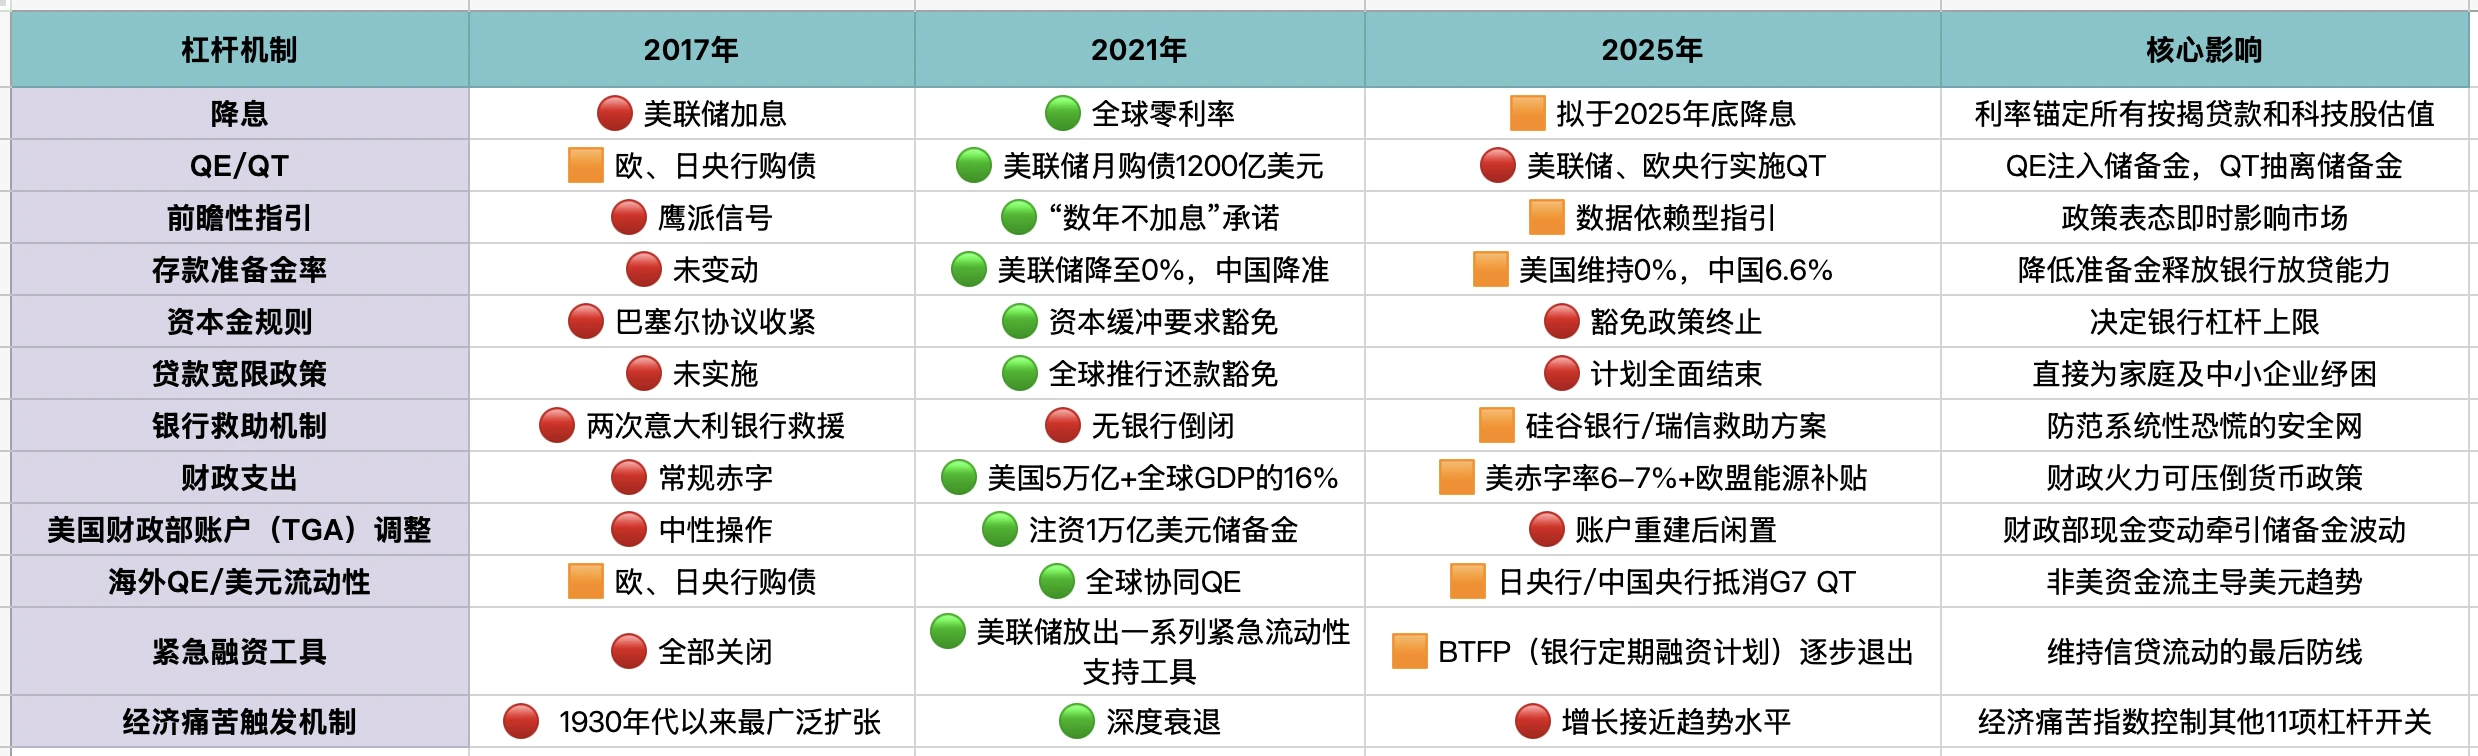
Detailed Analysis of Leverage Mechanisms
Rate Cuts
2017: The Federal Reserve led rate hikes, with limited global easing;
2021: An emergency wave of rate cuts swept the globe, with rates approaching the zero lower bound;
2025: To maintain anti-inflation credibility, the US and Europe plan to initiate moderate rate cuts by the end of 2025.
Quantitative Easing/Tightening (QE/QT)
2017: The Federal Reserve reduced its balance sheet, while the European and Japanese central banks continued to purchase bonds;
2020-2021: Global QE reached record levels;
2025: Policy stance reverses — the Federal Reserve insists on QT, the Bank of Japan engages in unlimited bond purchases, and China releases targeted liquidity.
The essence of the liquidity cycle is that QE is like transfusing blood into the veins, while QT is like slowly drawing blood out, so it is crucial to recognize the switching points of QT/QE and the positioning within the liquidity cycle.
Policy Status in Mid-2025
Rate Cut Process: Policy interest rates remain high; if Powell's advocacy materializes, the first rate cut may occur in the fourth quarter of 2025.
QE/QT Dynamics: QT continues to operate, with no new QE plans, but early signs of stimulus policies have emerged.
Four Key Observational Signals
Signal One: Inflation = 2%, and Policy Announcement Risk is Balanced
Focus: The Fed/ECB's statements shift to neutral language;
Significance: Clears the last rhetorical barriers before rate cuts.
Signal Two: QT Paused (100% Reinvestment of Expired Bonds)
Focus: FOMC/ECB announces full reinvestment;
Significance: Stops liquidity withdrawal, shifting to neutral reserves.
Signal Three: FRA-OIS Spread Greater than 25 Basis Points, or Repo Rates Surge
Focus: Three-month FRA-OIS or GC repo transactions jump to over 20 basis points;
Significance: Indicates dollar financing pressure, often forcing liquidity interventions.
Signal Four: The People's Bank of China Fully Cuts Reserve Requirements by 25 Basis Points
Focus: The reserve requirement ratio drops below 6.35%;
Significance: Releases 400 billion in base currency, often the first domino in easing for emerging markets.
Simplified Overview
In short, all these complex data boil down to the fact that we have not yet entered a new round of "massive liquidity injection."
Therefore, the market's risk appetite will continue to fluctuate, and there will be no real frenzy unless multiple leverage mechanisms turn green.
免责声明:本文章仅代表作者个人观点,不代表本平台的立场和观点。本文章仅供信息分享,不构成对任何人的任何投资建议。用户与作者之间的任何争议,与本平台无关。如网页中刊载的文章或图片涉及侵权,请提供相关的权利证明和身份证明发送邮件到support@aicoin.com,本平台相关工作人员将会进行核查。


