In the ever-changing cryptocurrency market, accurately identifying trend initiation points is key to outperforming the market. In this issue, we delve into the EMA Bullish Resonance Strategy based on a custom indicator system, helping users seize opportunities more quickly and steadily in trending markets.
I. Strategy Principle Analysis: What is EMA Bullish Resonance?
1. What is EMA?
EMA (Exponential Moving Average) is a weighted moving average that places more emphasis on the latest price fluctuations compared to a regular SMA (Simple Moving Average). This makes EMA more sensitive to trend capturing for high-volatility assets like cryptocurrencies.
2. How to Determine Trends from EMA?
Bullish Signal (Golden Cross):
Price crosses above EMA, indicating a bullish signal;
Short-term EMA (e.g., EMA5) crosses above long-term EMA (e.g., EMA10), indicating that a buying opportunity is approaching.
Bearish Signal (Death Cross):
Price crosses below EMA, indicating a bearish signal;
Short-term EMA crosses below long-term EMA, suggesting a sell or risk-avoidance action.
3. What is Bullish Resonance?
EMA is an important tool for observing changes in market trends from short-term to long-term. A single EMA allows us to simply focus on trends, but the combination of multiple EMAs can enhance the reliability of trend judgments.
When multiple EMA lines (such as short-term, medium-term, and long-term moving averages) emit consistent signals together, it is referred to as “resonance,” indicating that market trend signals are more certain.
3.1 Bullish Resonance Signal (Buy/Long Signal)
Multiple EMAs show a “bullish arrangement” state: short-term EMA > medium-term EMA > long-term EMA
3.2 Bullish Resonance Signal (Sell/Close Long Signal)
When any condition in 3.1 bullish resonance is not met, this resonance will end. You can exit the current position.
Typical Resonance Structure:
EMA(5) > EMA(20) > EMA(40) > EMA(60) > EMA(120)
The shorter the EMA period, the higher it is positioned, indicating that the price is in a stable upward channel.
EMAs show a divergent state, indicating a strong trend and clear momentum.
II. Strategy Effect Testing: BTC Live Chart Example
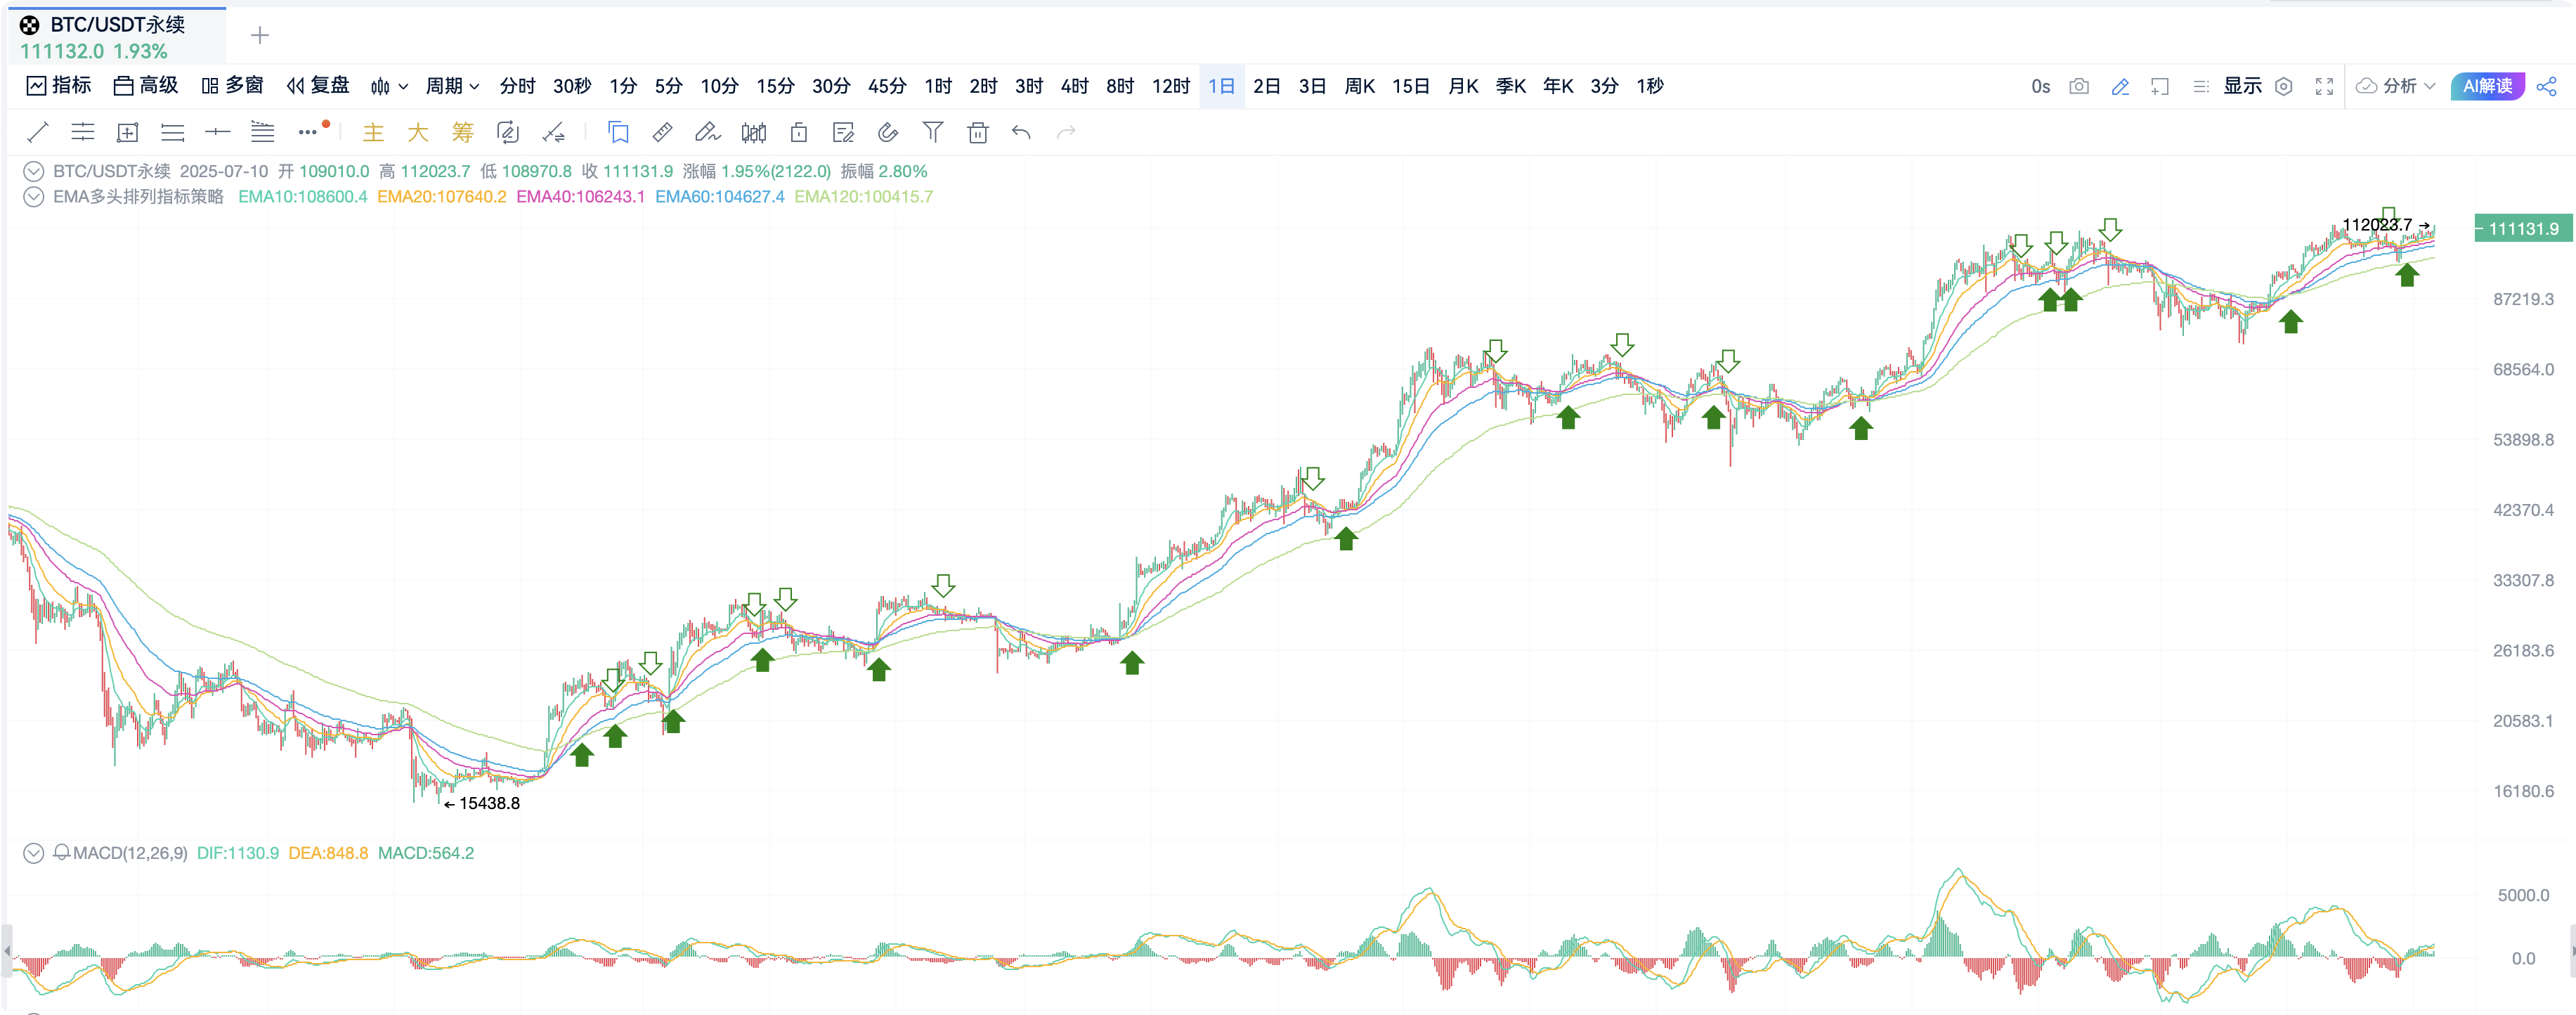
(Figure: OKX-BTCUSDT perpetual contract daily cycle)
Signal Explanation:
Green solid upward arrow: Bullish resonance begins (entry signal)
Green hollow downward arrow: Bullish resonance ends (exit signal)
Combining EMA bullish resonance signals allows for clear identification of trend initiation and termination points, effectively avoiding false fluctuations within consolidation ranges.
III. Strategy Coin Selection Practice: From Indicators to Live Trading
Users can filter potential explosive coins through AiCoin's Custom Indicators/Backtesting/Live Trading - Indicator Coin Selection feature.
Recommended Coin Selection Criteria:
Market Cap: Top 100
Trading Volume: 24H ≥ 100 million USDT
Cycle: 4H
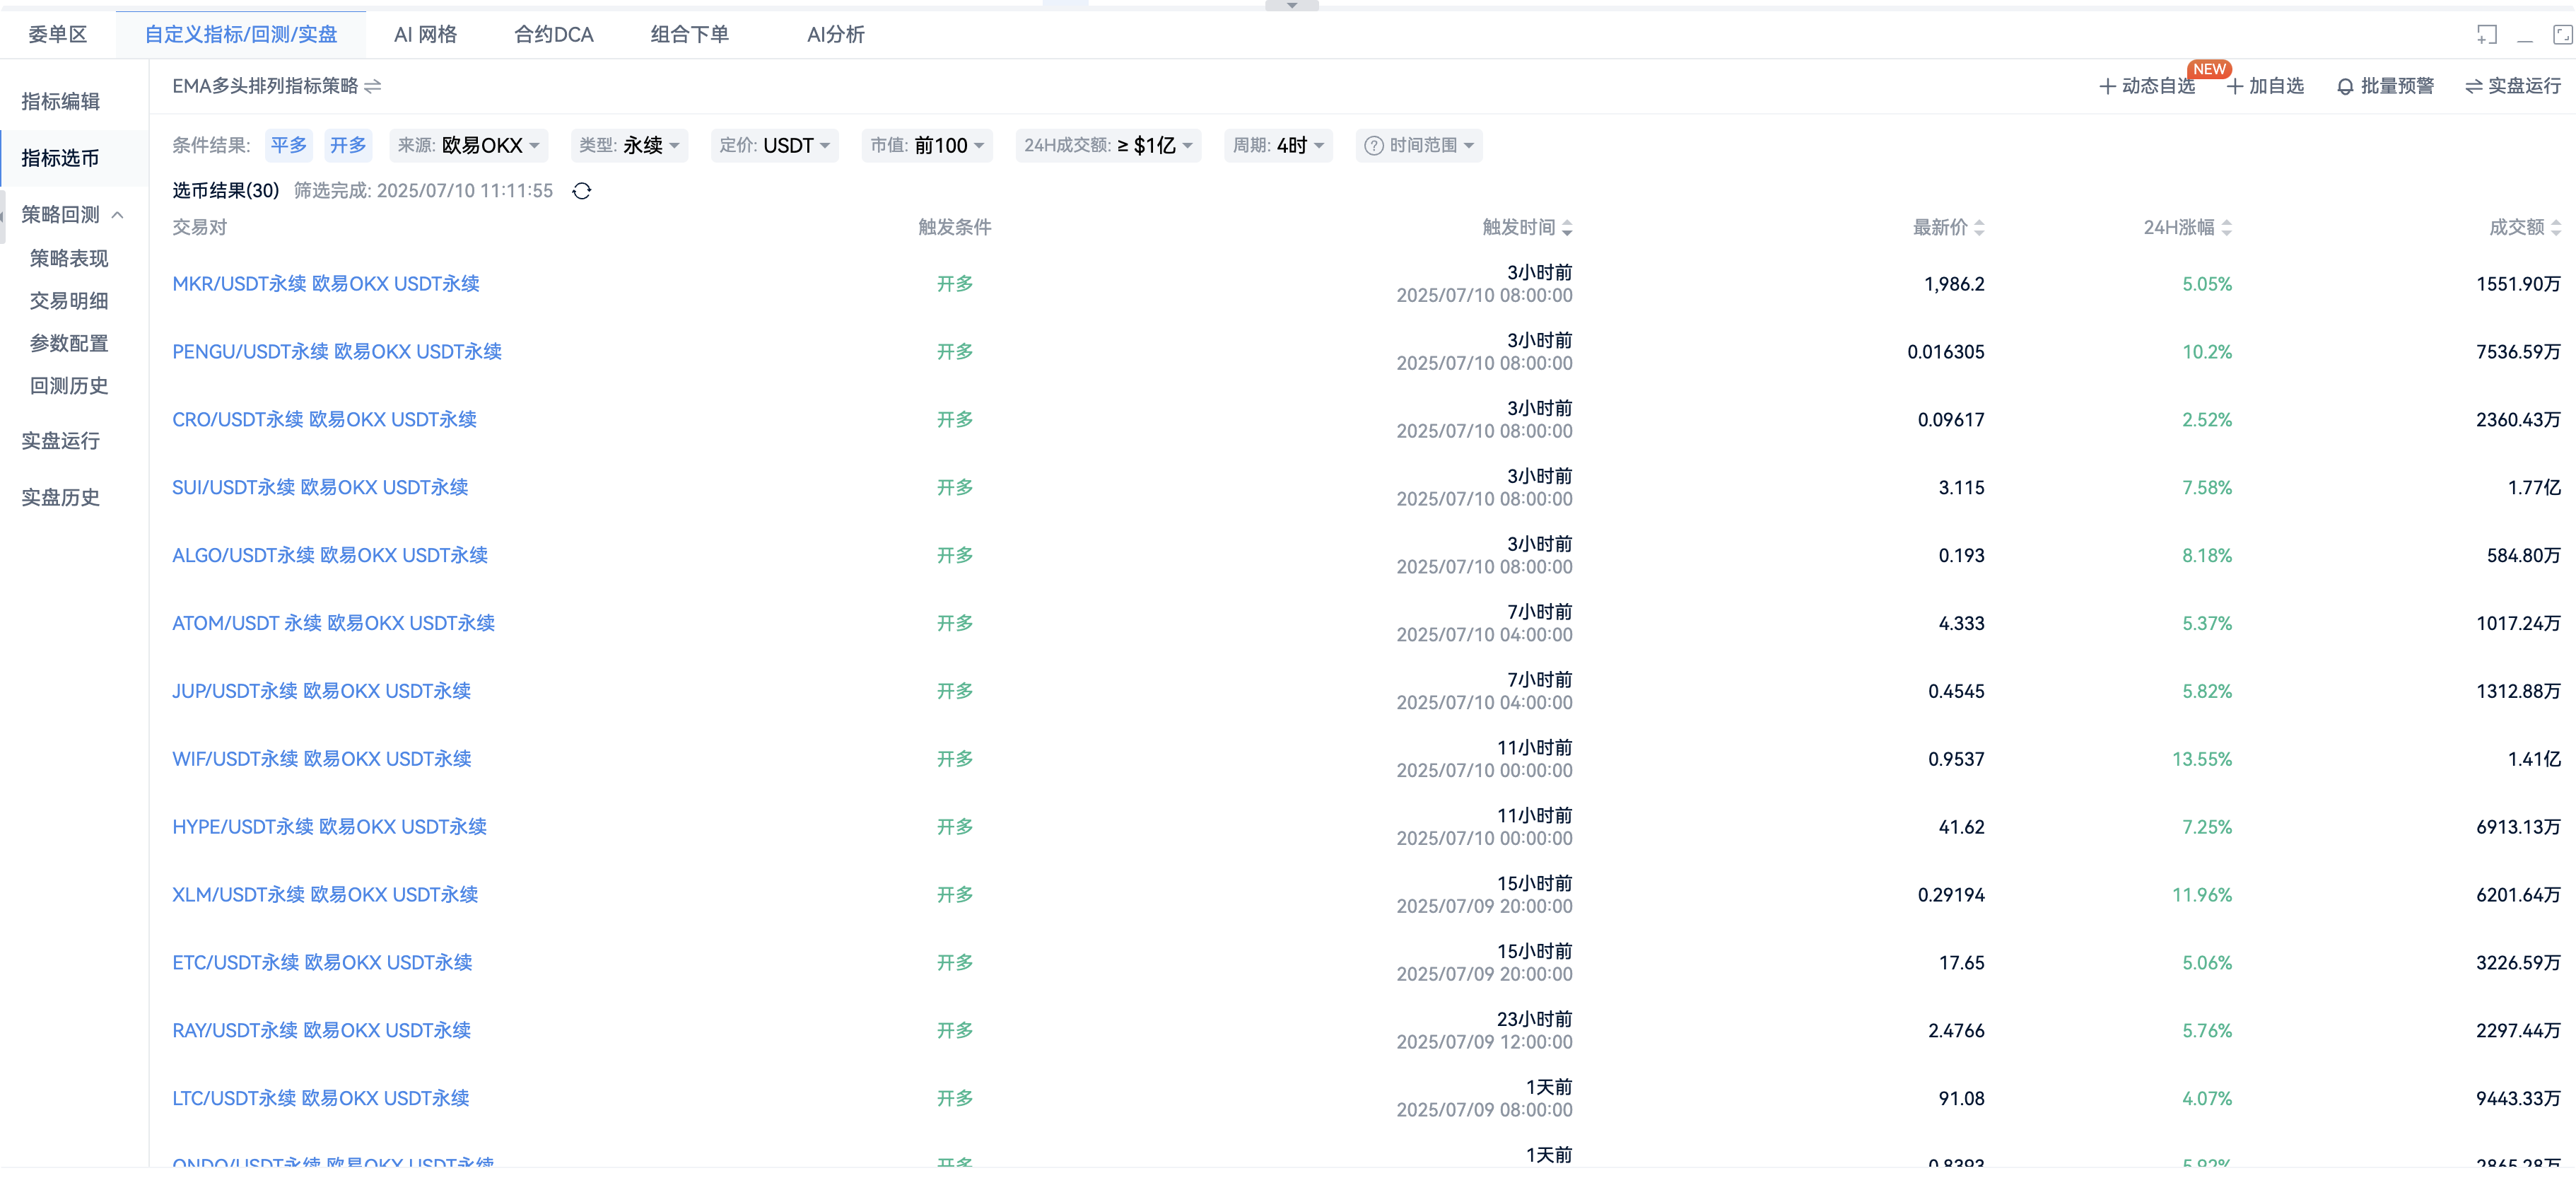
Coin selection results evaluation: All selected coins are in the early stages of initiation.
Example Analysis:
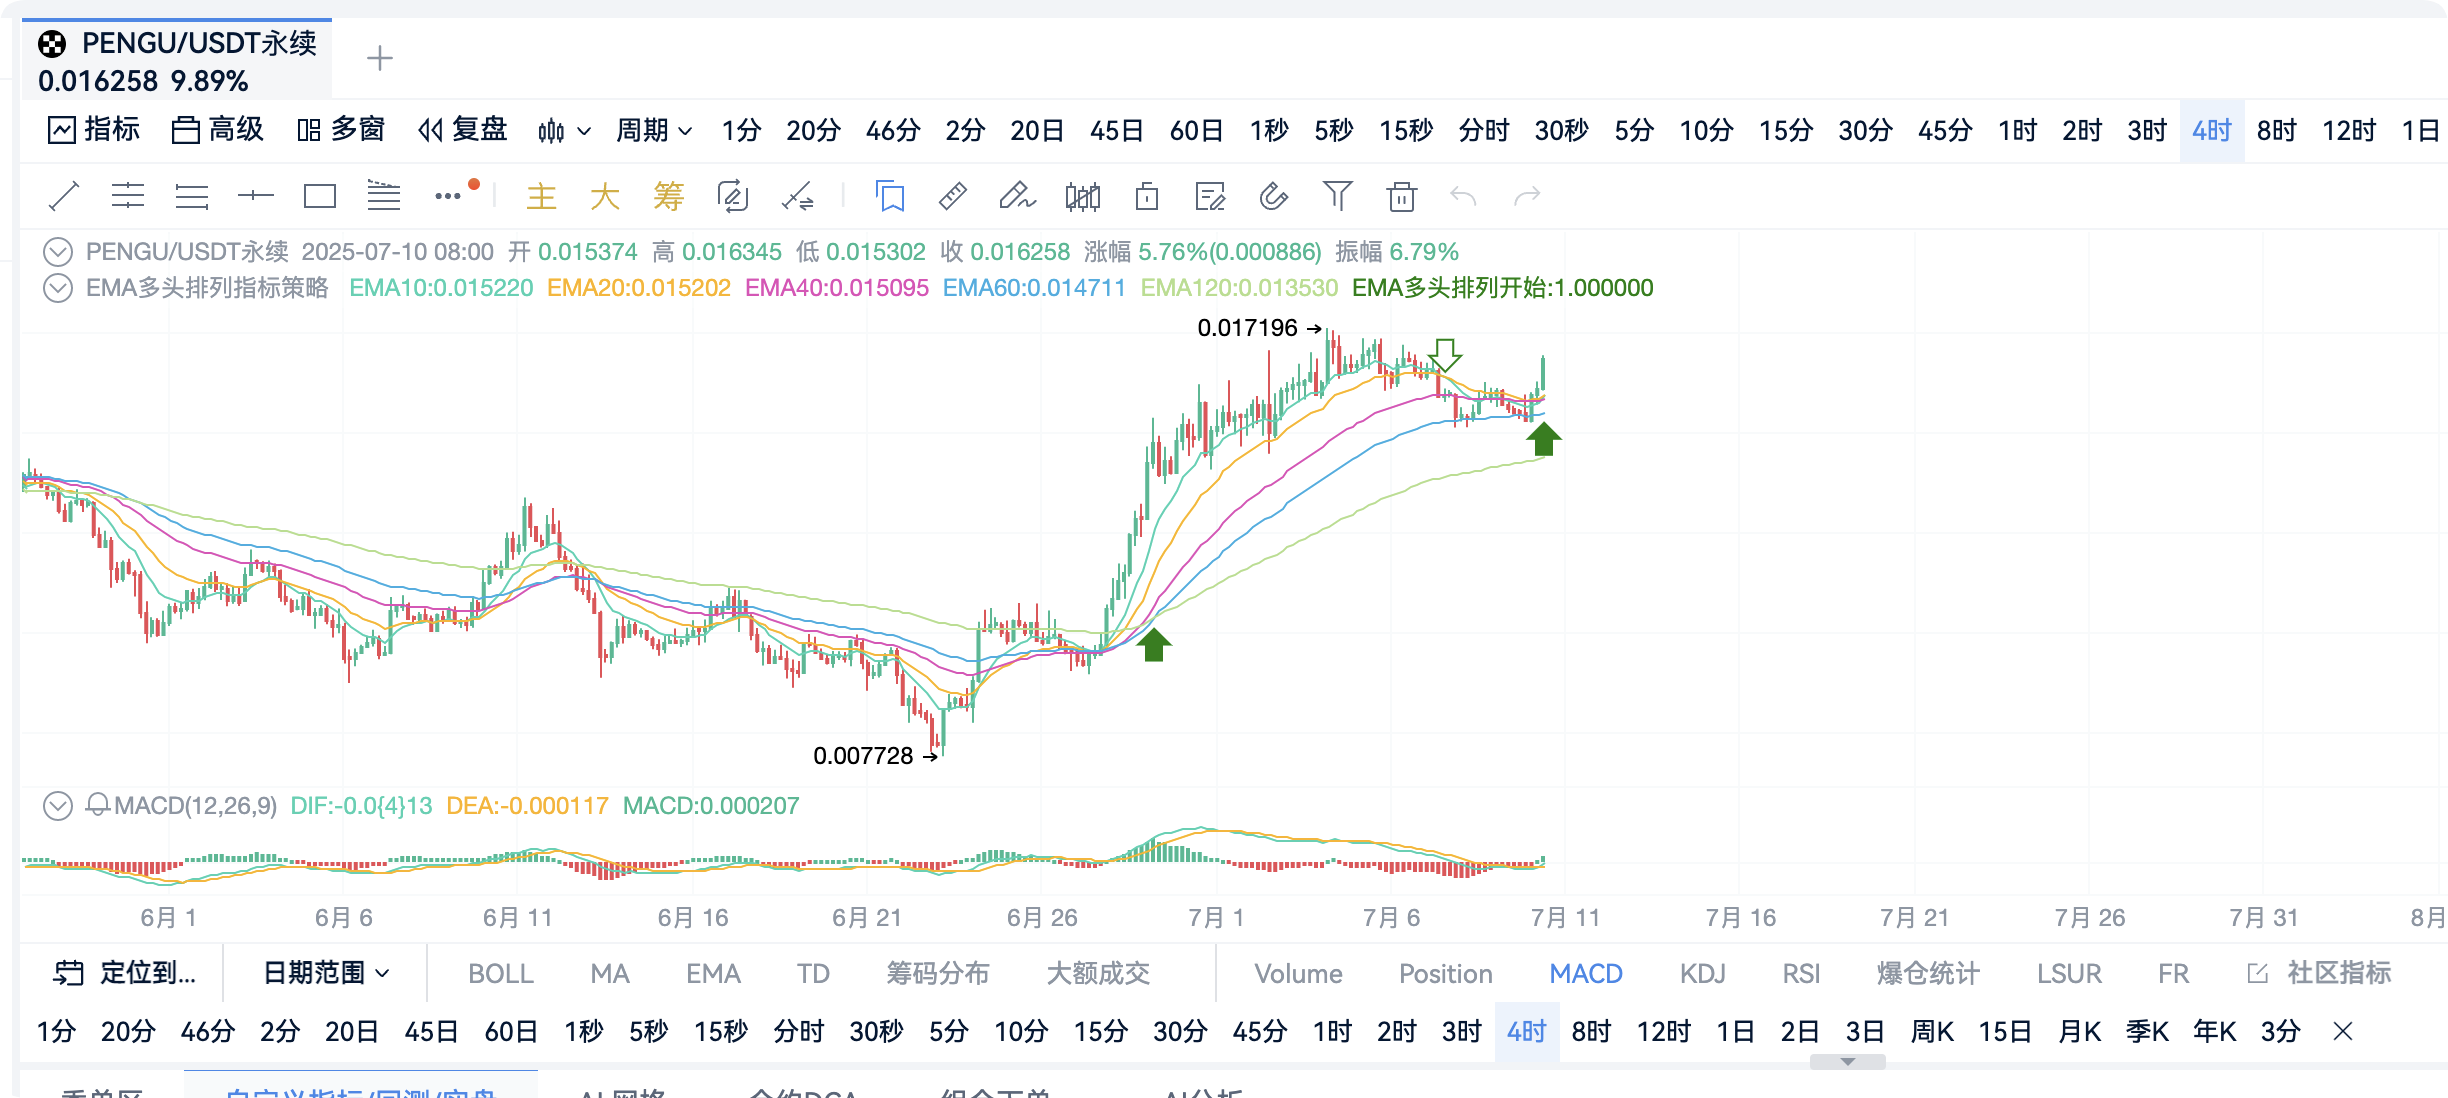
(PENGU: Initially forming a bullish arrangement, in the initiation phase)
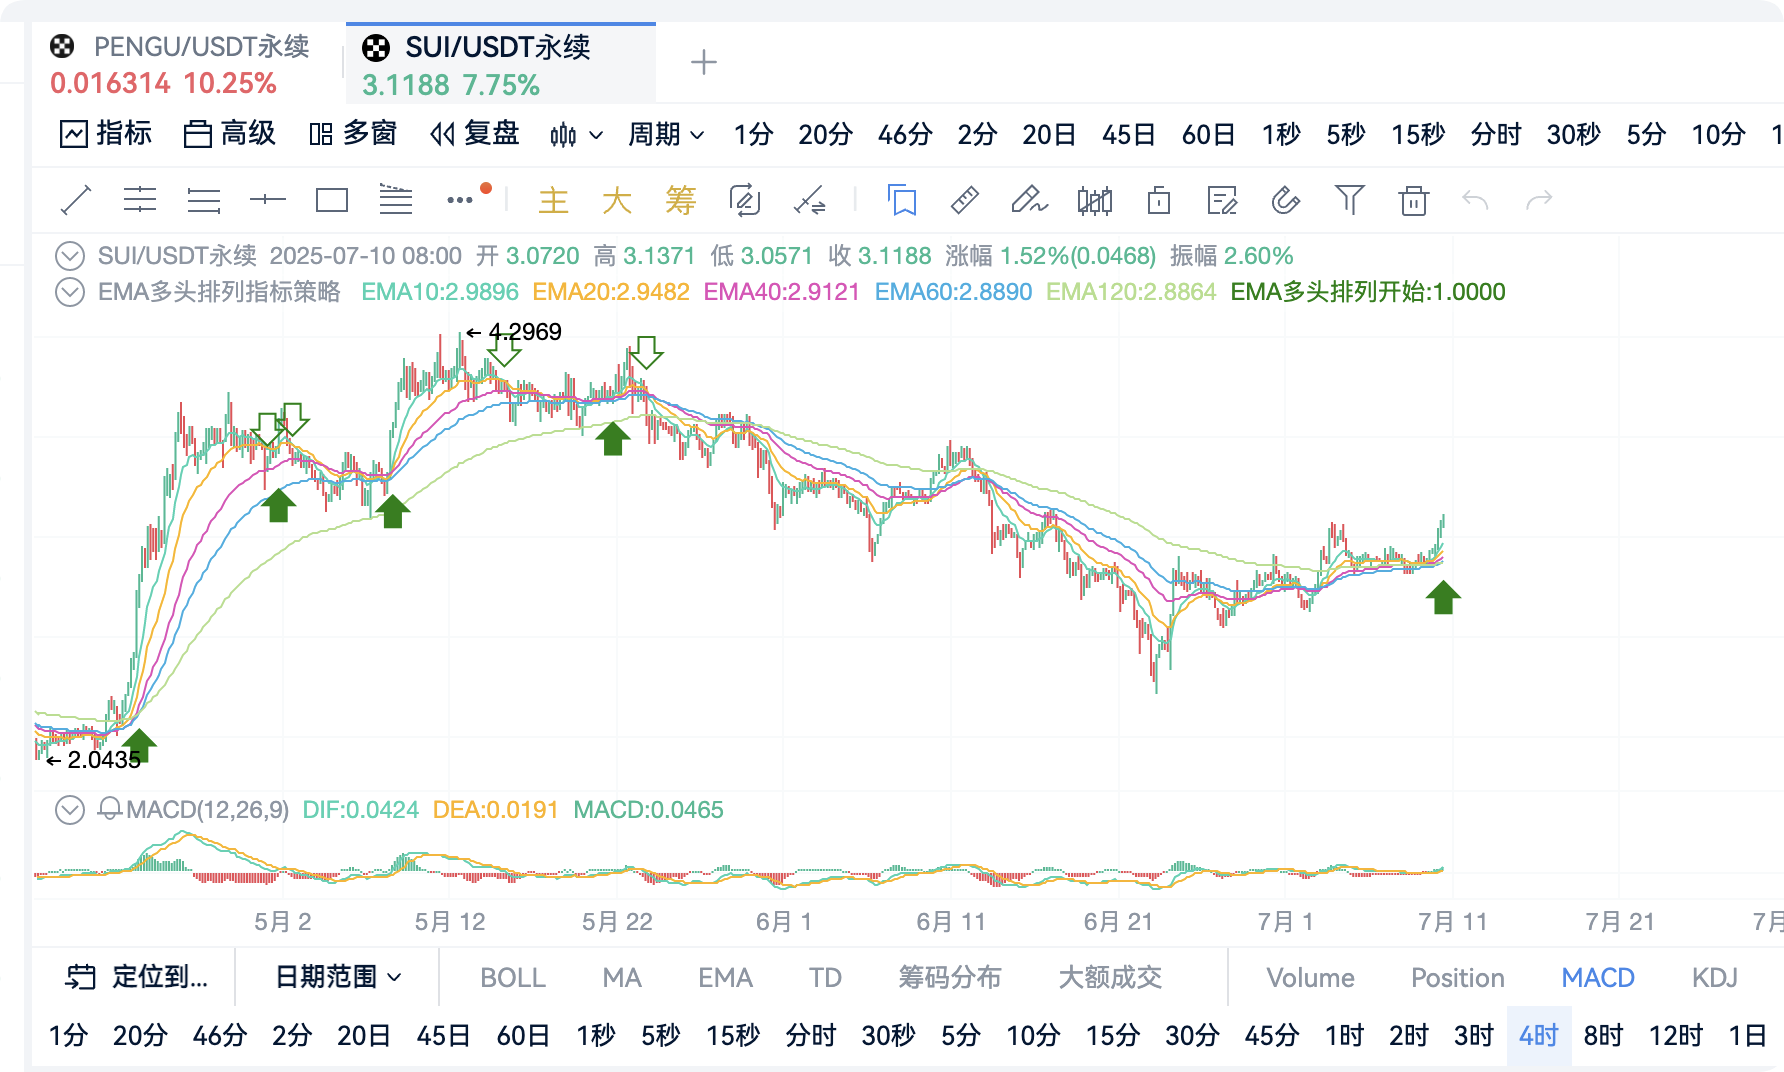
(SUI: First time forming a bullish arrangement after a pullback, in the pullback counterattack initiation phase)
These selected coins are often in the “low position initiation” or “pullback confirmation” stages, offering a good risk-reward ratio.
IV. Usage Recommendations: When to Use, When Not to Use?
Recommended Usage Scenario: Trend Market Initiation Phase
Can be combined with positive news or macro expectations to enhance signal effectiveness
For example: Federal Reserve interest rate cuts, regulatory policy easing, political figures (like Trump) supporting cryptocurrencies, etc.
News Acquisition Suggestions:
Check AiCoin News to grasp sudden information
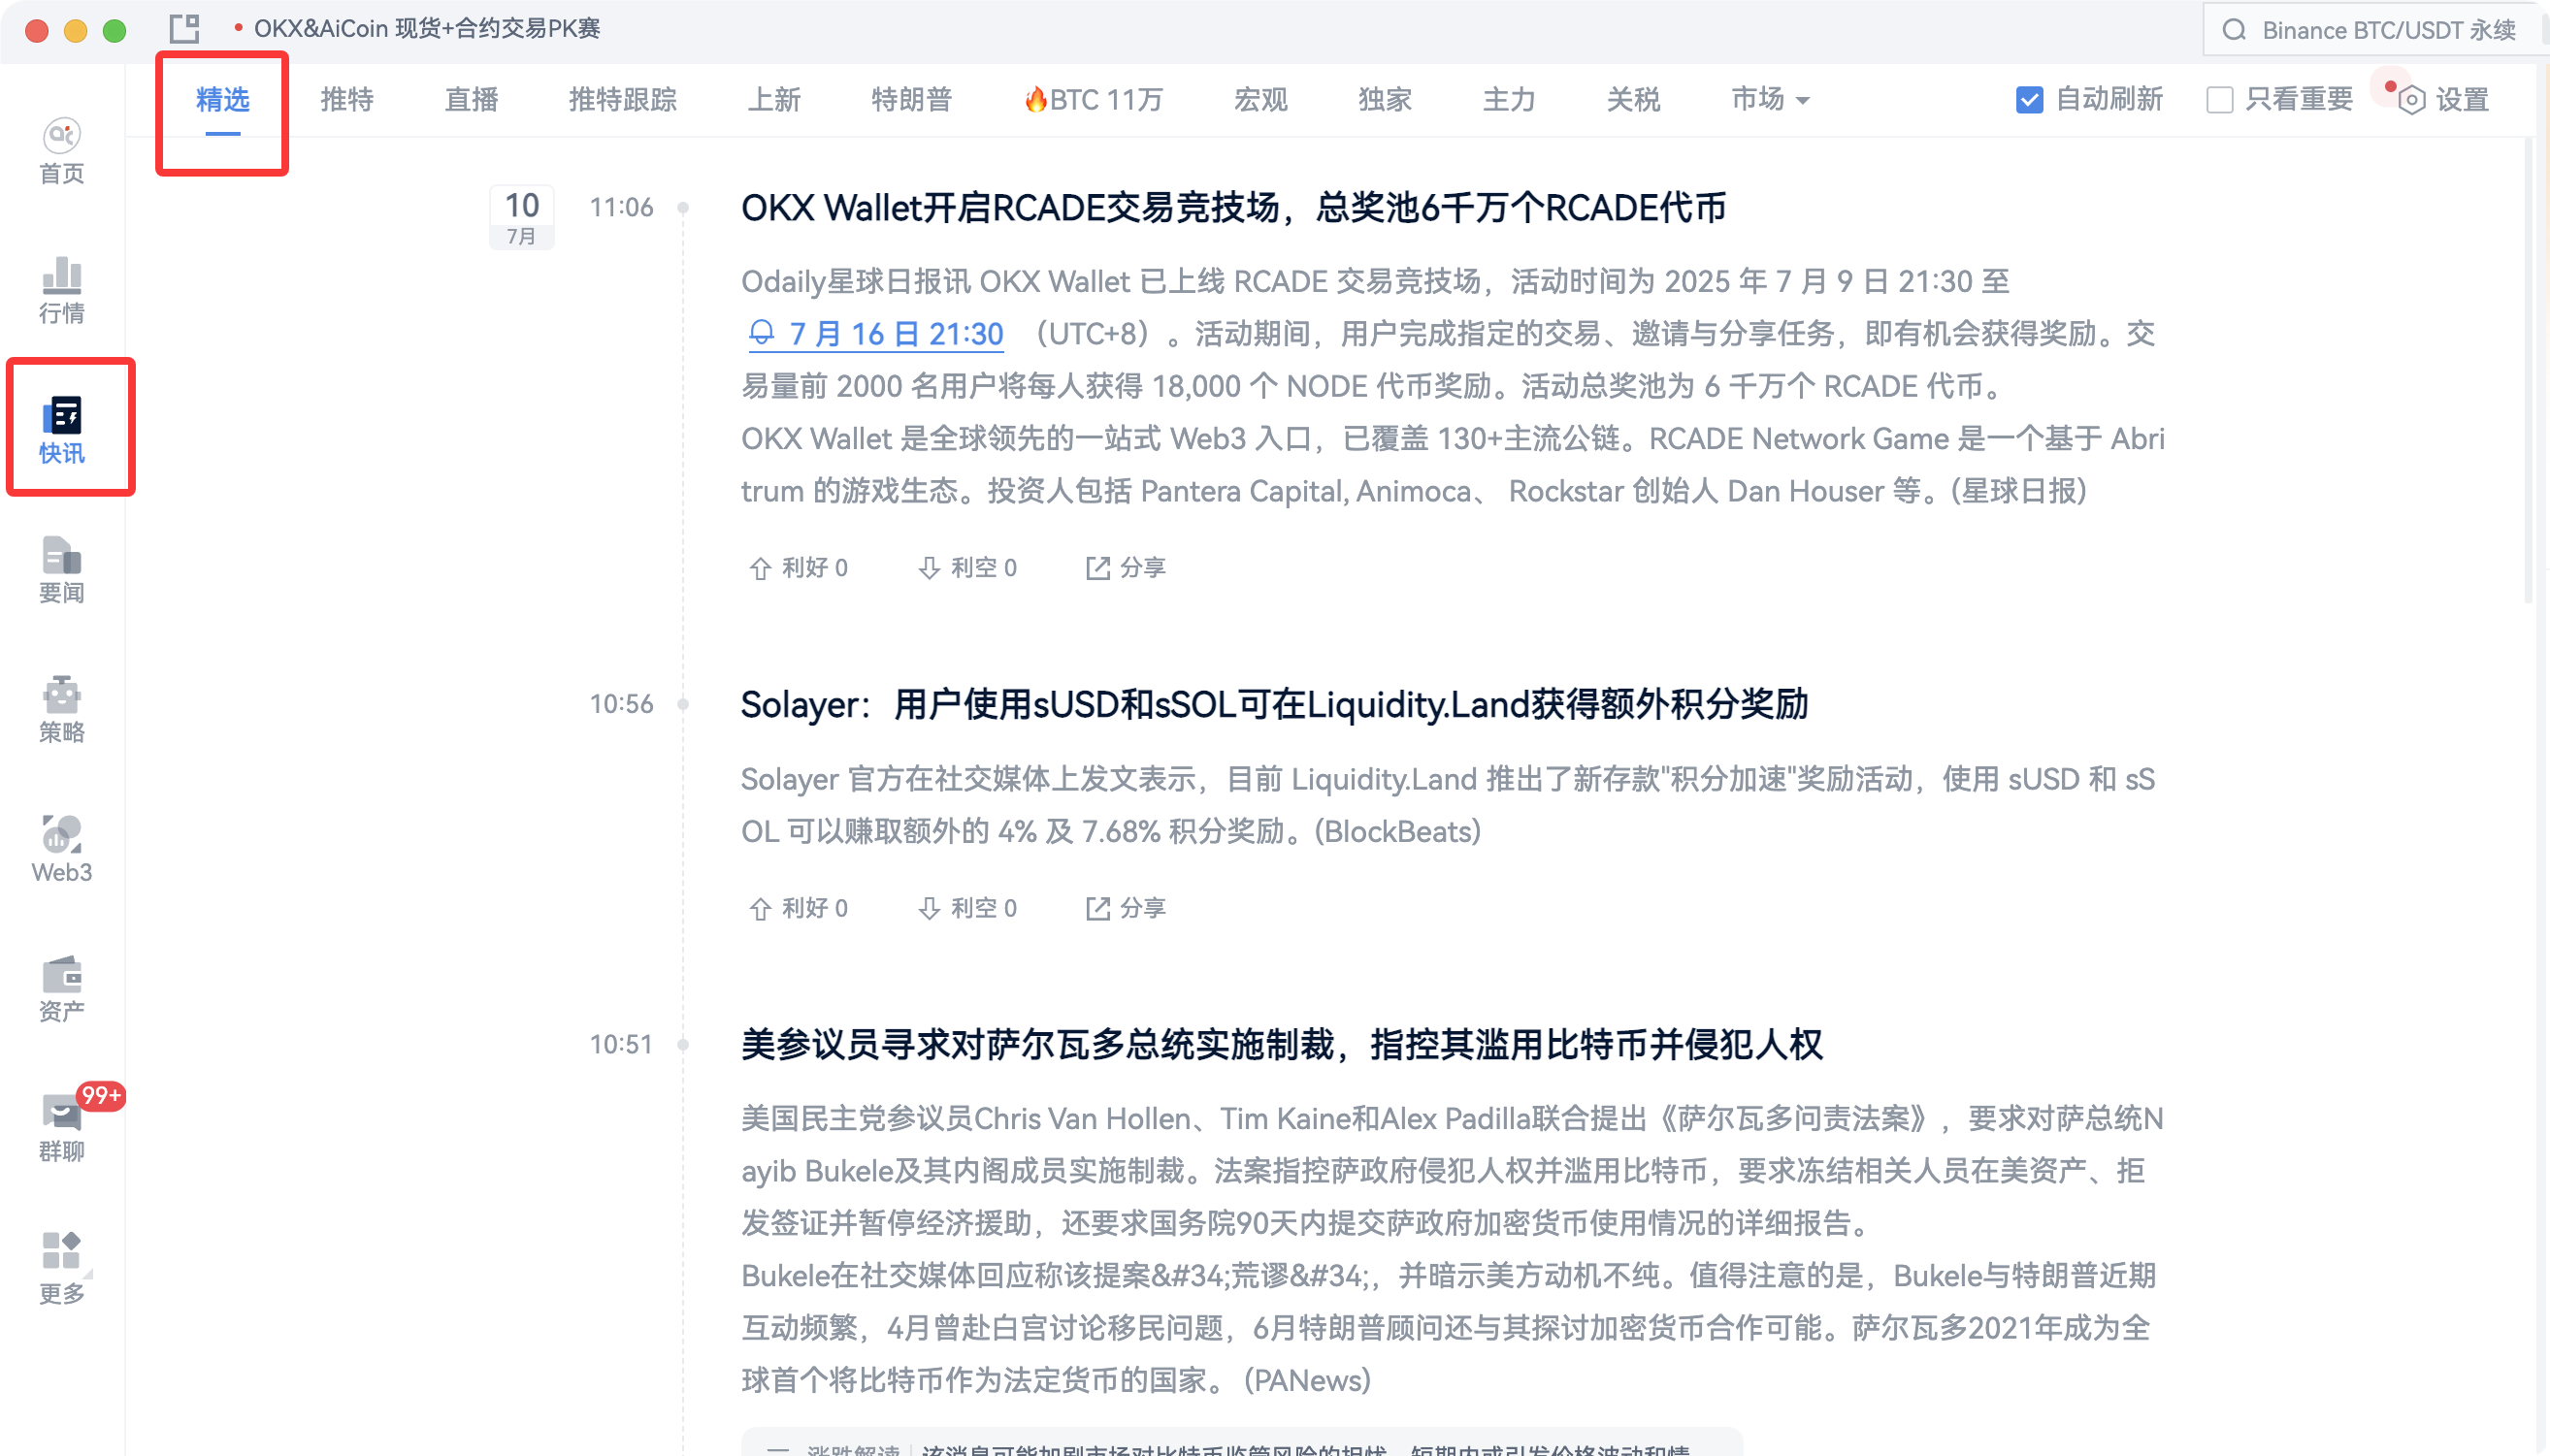
Follow AiCoin Event Calendar to layout potential market movements in advance
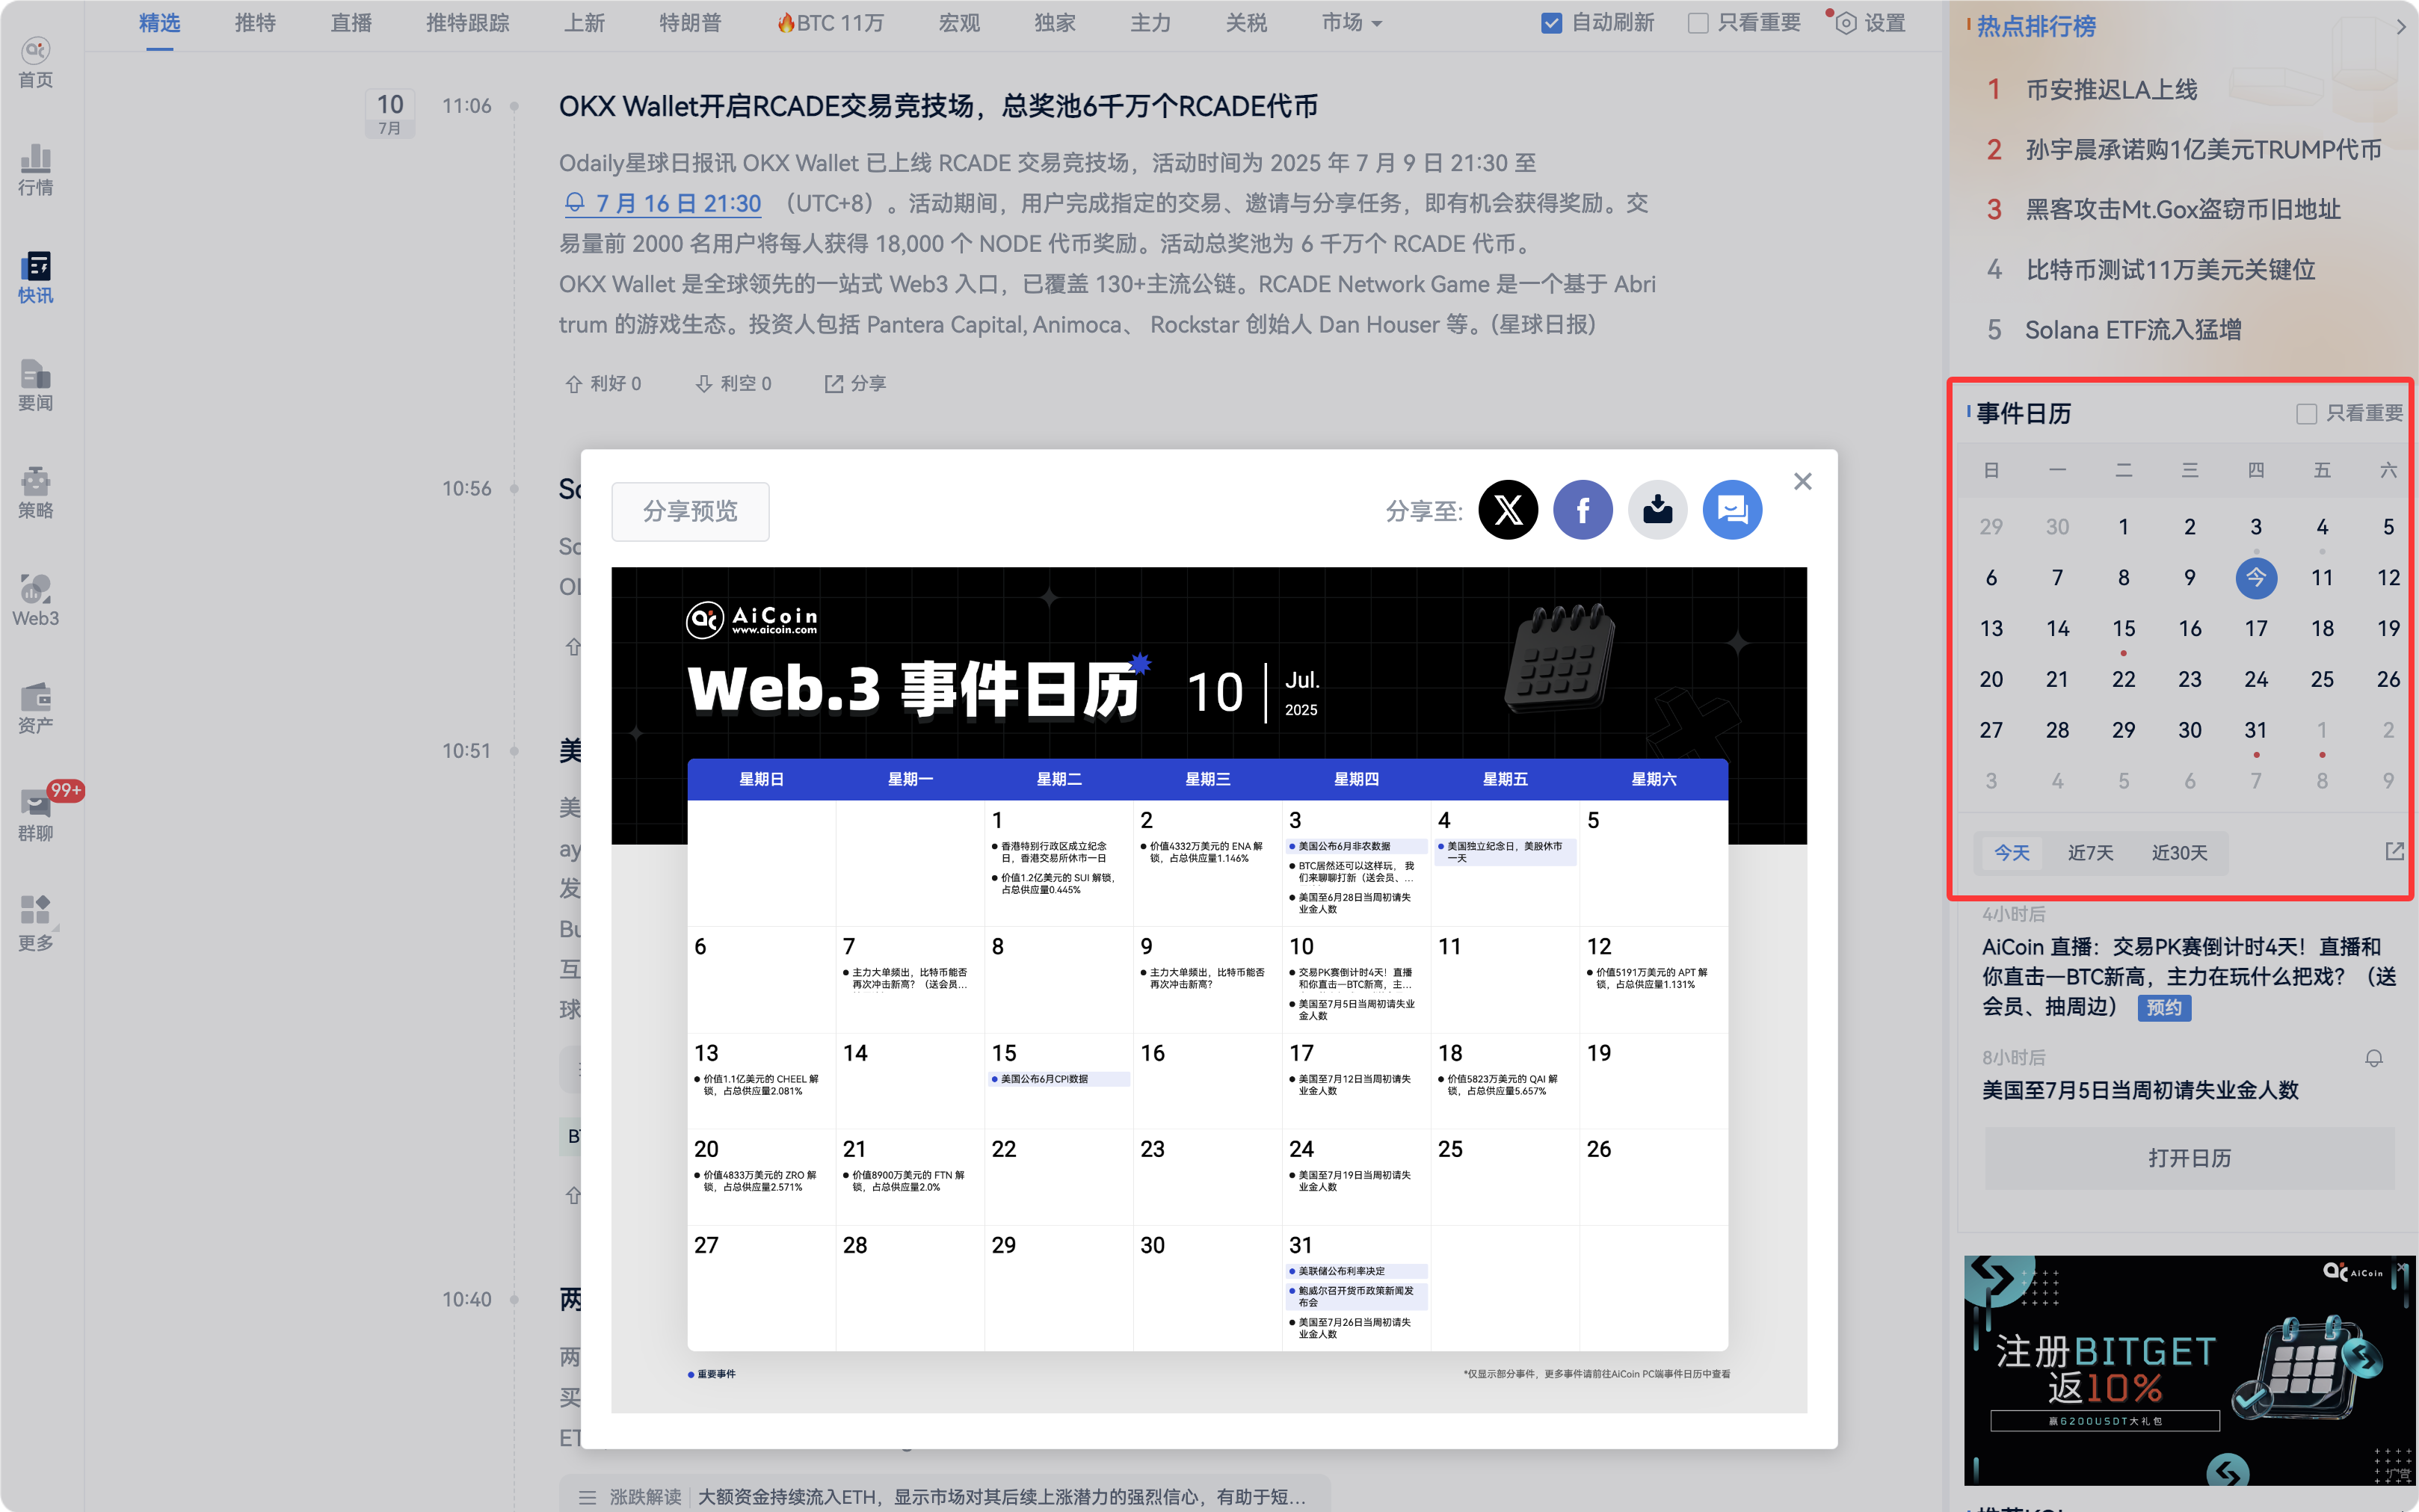
Refer to AiCoin Hotspot Rankings to discover market focal points
Not Recommended Usage Scenario: During Sideways Consolidation Periods
Moving averages intertwine, easily triggering numerous false signals
Leading to transaction fee erosion and emotional fatigue
V. Strategy Source Code Public: Suitable for Advanced Users to Customize
// @version=2
ma1 = ema(close, 10)
ma2 = ema(close, 20)
ma3 = ema(close, 40)
ma4 = ema(close, 60)
ma5 = ema(close, 120)
// Calculate EMA bullish arrangement
maLong = ma1 > ma2 && ma2 > ma3 && ma3 > ma4 && ma4 > ma5
// Start bullish arrangement
longStart = maLong && (not maLong[1])
// End bullish arrangement
longEnd = (not maLong) && maLong[1]
// Define alert conditions for use in the alert window
alertcondition(longStart, title='EMA Bullish Arrangement Begins', direction="buy")
alertcondition(longEnd, title='EMA Bullish Arrangement Ends', direction="sell")
// Plot on chart
plot(ma1, title ="EMA10")
plot(ma2, title ="EMA20")
plot(ma3, title ="EMA40")
plot(ma4, title ="EMA60")
plot(ma5, title ="EMA120")
// plot(ma6, title ="EMA250")
plotShape(longStart, title="EMA Bullish Arrangement Begins", shape='arrowUp', color='green', refSeries=ma3, placement='bottom', fill=true)
plotShape(longEnd, title="EMA Bullish Arrangement Ends", shape='arrowDown', color='green', refSeries=ma3, placement='top', fill=false)
// Open long and close long
exitLong(longEnd, price='market', amount=1)
enterLong(longStart, price='market', amount=1)
VI. Summary: From Strategy to Application, How to Use Efficiently?
EMA Bullish Resonance is a classic trend-following strategy, especially suitable for clearly trending market phases. In the application process, it is recommended to combine news, hotspot data, and other technical indicators to enhance judgment accuracy:
Practical Points:
When the trend is clear: Combine event-driven strategies to amplify returns.
During sideways consolidation: Avoid frequent entries and exits to reduce trading noise.
This strategy is suitable for medium to short-term traders or trend investors as a “timing tool,” helping to grasp initiation signals, avoid high-frequency misjudgments, and achieve more stable trading performance.
For one-click access to this strategy, feel free to use the 【AiCoin - Custom Indicator Module】, which supports signal overlay, live push, coin selection backtesting, and various professional features.
Professional tools combined with strategies truly achieve the unity of knowledge and action.
免责声明:本文章仅代表作者个人观点,不代表本平台的立场和观点。本文章仅供信息分享,不构成对任何人的任何投资建议。用户与作者之间的任何争议,与本平台无关。如网页中刊载的文章或图片涉及侵权,请提供相关的权利证明和身份证明发送邮件到support@aicoin.com,本平台相关工作人员将会进行核查。