This report delves into the changes in the industry landscape, providing a comprehensive analysis of data dynamics in areas such as DeFi, NFT, gaming, and AI.
Written by: Sara Gherghelas, DappRadar
Translated by: Tim, PANews
AI agents have topped the market, RWA is redefining NFT value, DeFi is attracting capital but losing momentum, and the $6.3 billion in hacker attacks in the second quarter has exposed the industry's vulnerabilities.
Despite the rebound in cryptocurrency market prices and improved sentiment, the DApp ecosystem presents a different picture: AI agents are experiencing explosive growth, NFT value is shifting from ostentation to functionality, while DeFi is navigating between rising TVL and shrinking financing. These data not only showcase market activity but also reveal the true flow of users, lagging sectors, and key trends that are reshaping the future of DApps.
The era we are in no longer allows market trends to be driven solely by hype. Users are beginning to pursue real value: whether it's AI agents that can accomplish tasks, NFTs associated with RWA, or DeFi platforms that provide sustainable returns. However, risks remain high: losses from exploit incidents have surged, highlighting the fragility of trust, where even minor oversights can be exploited by malicious actors.
This report provides an in-depth analysis of changes in the industry landscape, offering a comprehensive examination of data dynamics in DeFi, NFT, gaming, and AI. From wallet activity and transaction volume to application and capital flow, we track key signals and focus on observing the core narratives shaping the cryptocurrency industry in the second quarter of 2025.
Key Points:
- In the second quarter of 2025, the average daily active independent wallets for DApps was 24.3 million, a decrease of 2.5% quarter-on-quarter, but still a staggering 247% increase compared to early 2024.
- The total locked value in DeFi reached $200 billion, a quarter-on-quarter increase of 28%, primarily benefiting from a 36% rebound in Ethereum. However, financing in the DeFi sector fell by 50% quarter-on-quarter, with only $483 million raised in the second quarter, bringing the total financing for the first two quarters of 2025 to $1.4 billion.
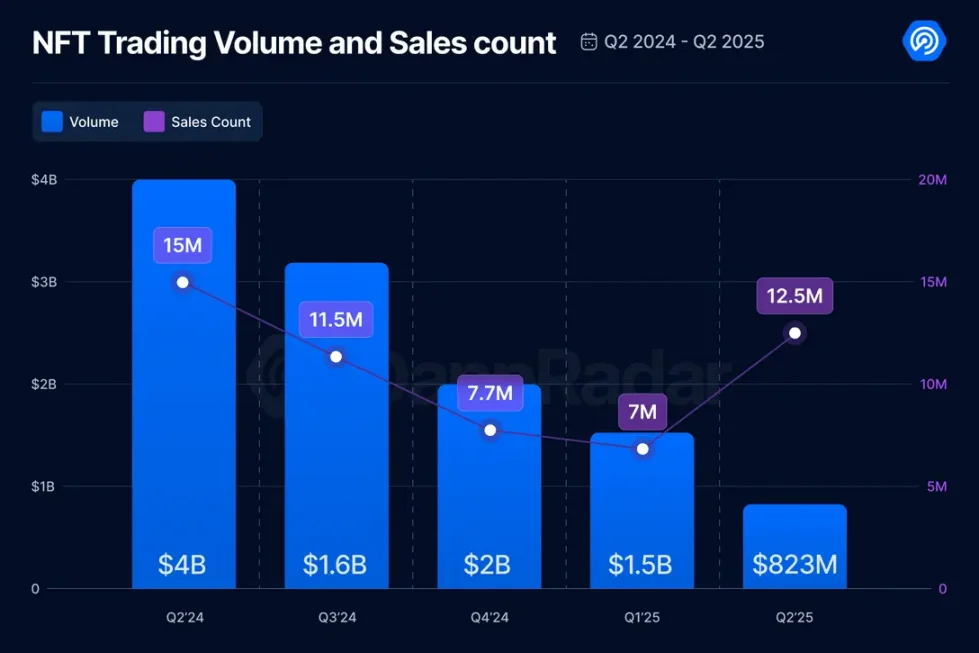
- NFT transaction volume plummeted by 45% to $867 million, but sales surged by 78% to 14.9 million transactions, reflecting a sharp drop in average market prices, while the number of traders increased by 20%.
- RWA NFT transaction volume grew by 29%, rising to second place in the sector, with the Courtyard platform becoming the second-largest NFT market by transaction volume this quarter.
- Guild of Guardians NFT transaction volume soared to first and fourth place, surpassing BAYC and CryptoPunks, marking a pivotal moment for gaming NFTs.
- Web3 suffered losses of $6.3 billion due to security incidents, a quarter-on-quarter increase of 215%. The Mantra exploit alone accounted for a loss of $5.5 billion, making it the second-largest security incident in the cryptocurrency industry since the FTX bankruptcy (which resulted in an $8 billion loss) in 2022.
1. The number of daily active independent wallets for DApps stabilizes at 24 million, with significant growth in AI and social sectors
This quarter, DApp activity decreased by 2.5%, with the average number of daily active independent wallets at 24.3 million. Nevertheless, we can still consider the ecosystem to have stabilized at this level, which is both a sign of the industry's increasing maturity and proof that users are continuously interacting with DApps across multiple application areas. It is worth noting that many users operate multiple wallets, so the number of daily active independent wallets may differ from the actual number of users. However, this metric remains a strong indicator of user engagement. Just a few quarters ago, the number of daily active independent wallets was around 5 million, showing a significant growth trajectory.
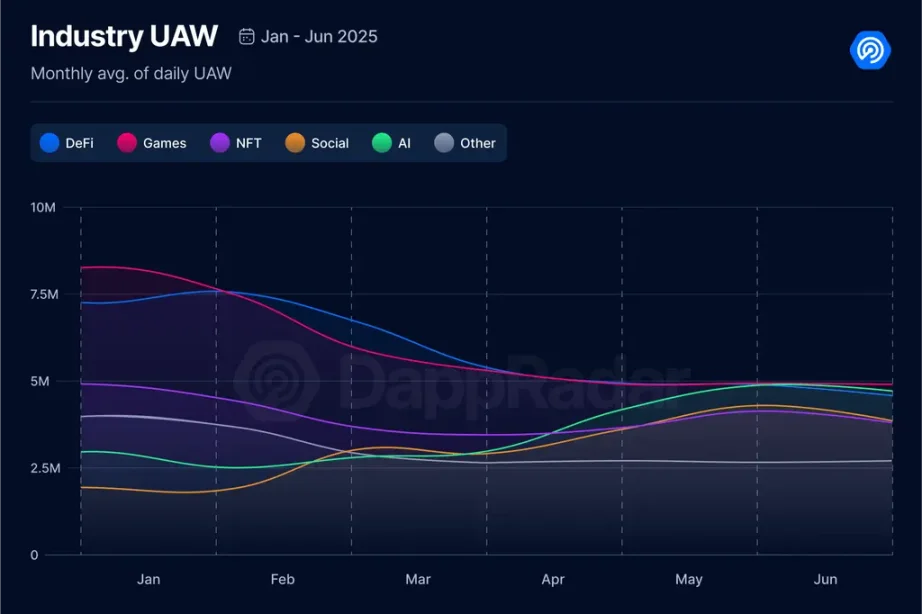
The number of active wallets in DeFi and GameFi has both declined, with DeFi down 33% and GameFi down 17%. On the other hand, Social and AI DApps have seen growth, aligning with broader industry trends.
In the Social sector, the rise of InfoFi is noteworthy, with platforms like Kaito and Cookie DAO leading the way. In the AI sector, agent-based DApps are showing strong momentum, with Virtuals Protocol standing out.

As expected, these sector-level changes have also impacted the distribution of dominance. The decline in activity in the DeFi and Gaming sectors has led to a reduction in their market share, while the AI and Social sectors have captured and expanded more share. Comparing the second quarter of 2025 with the first quarter, it is evident that the AI sector is experiencing rapid growth, with the Social sector closely following. I believe that by the end of this year, it would not be surprising if AI surpasses either Gaming or DeFi in terms of dominance.
In fact, looking at the top-ranking DApps by independent wallet numbers this quarter, there is one AI DApp at the top.
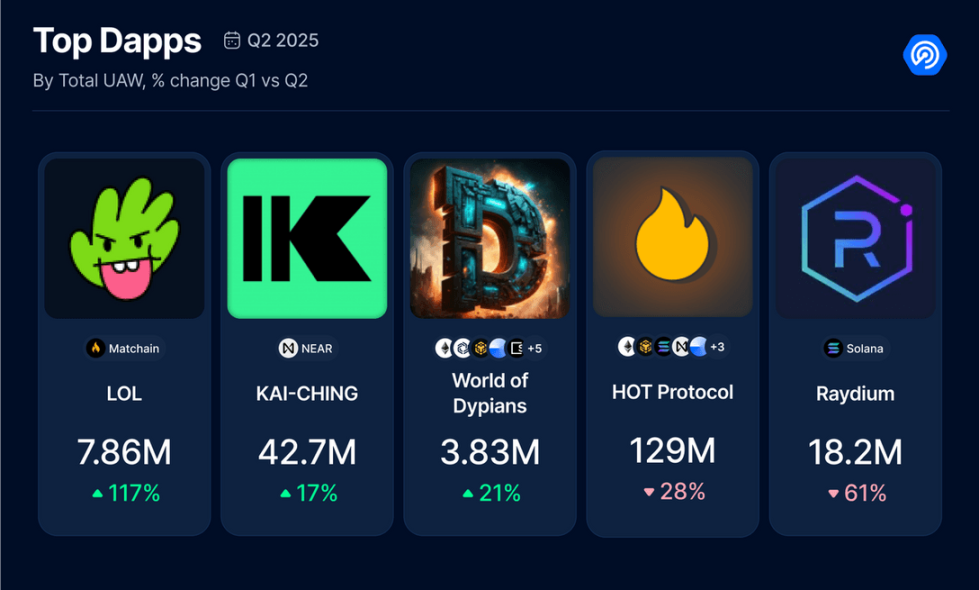
The remaining spots on this list are occupied by several well-known projects, primarily from the DeFi sector. Given that these projects have maintained stable operations throughout the Meme coin craze and Agent token frenzy, such a distribution is understandable.
Additionally, another noteworthy perspective is that we have introduced a "Dormant DApp" metric this quarter, specifically tracking those decentralized applications that were active in the first quarter of 2025 but completely ceased activity in the second quarter.
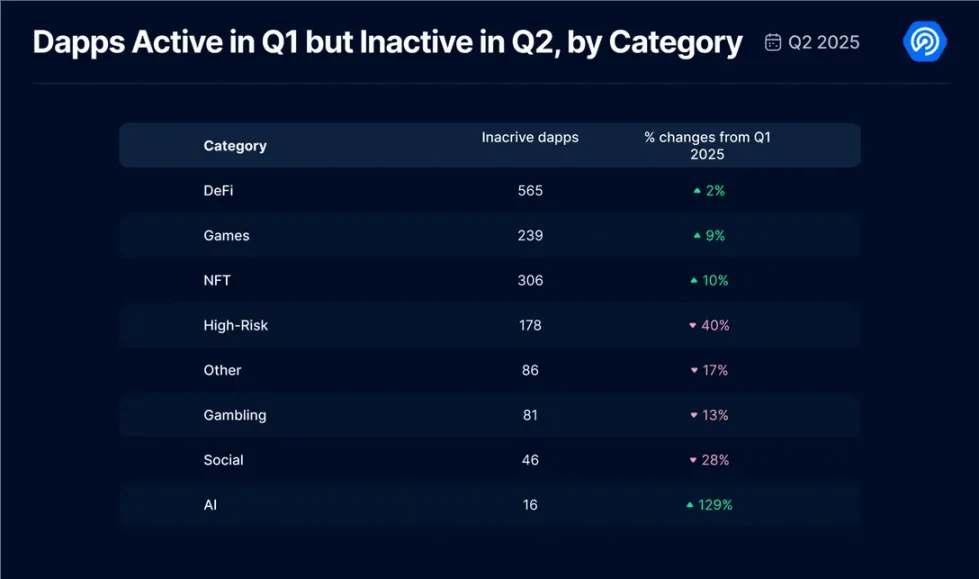
We focused on several major categories for analysis: the number of inactive decentralized applications in the DeFi sector increased by 2%, gaming applications grew by 9%, and NFT applications rose by 10%. This analysis particularly included high-risk applications, whose inactivity actually decreased significantly by 40%, indicating that they are still in use and rarely abandoned. However, the most surprising finding was in the AI sector, where inactive AI applications surged by 129%. Although this percentage seems astonishing, it corresponds to only 16 applications. Nevertheless, this phenomenon raises important considerations: it highlights that these projects (especially in gaming and AI) are still in their early stages of development, and without sufficient funding support, achieving mainstream application is incredibly challenging. In the Web3 space, user retention remains the most daunting challenge, and these data undoubtedly confirm this.
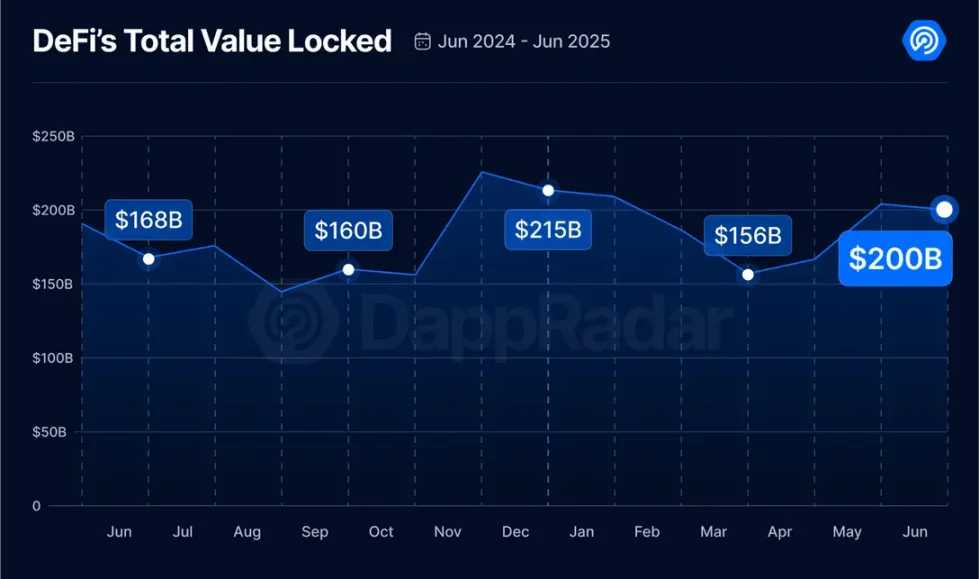
2. Total locked value in DeFi soared to $200 billion in the second quarter of 2025, but financing fell by 50%
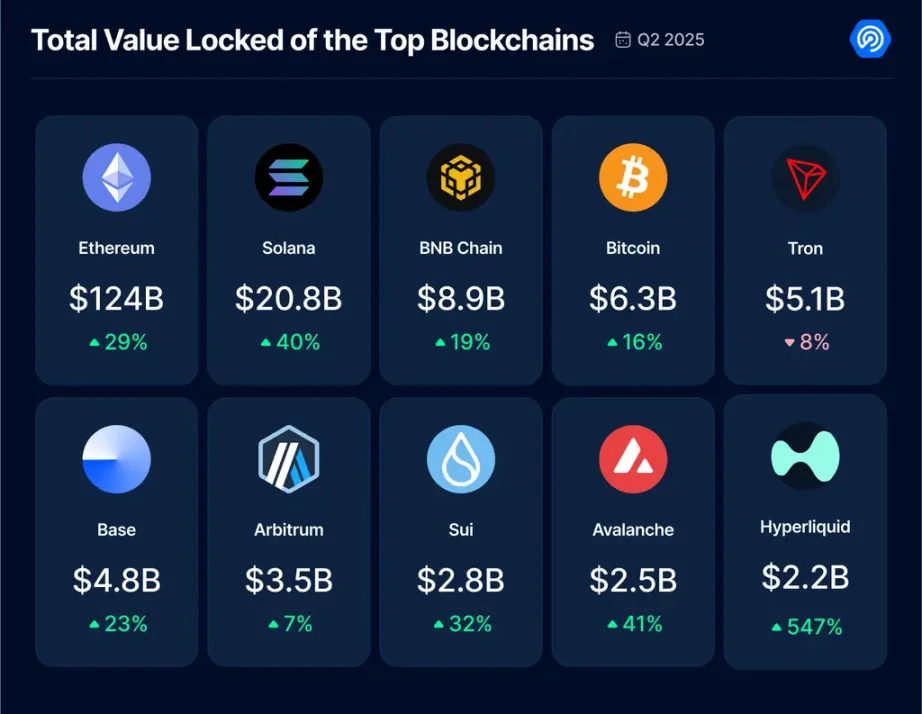
The macroeconomic environment this quarter has been like a roller coaster, and the DeFi sector has not been immune to this turmoil. Nevertheless, the market still shows positive signals: first, the cryptocurrency market prices have rebounded strongly, with Bitcoin rising 30% compared to the first quarter of 2025 and Ethereum climbing 36%, leading to a 25% quarter-on-quarter increase in the total cryptocurrency market capitalization. Naturally, the DeFi sector followed this upward trend, with total locked value surpassing $200 billion, achieving a quarter-on-quarter increase of 28%.
Observing the total locked value performance across major blockchains, most chains recorded steady growth, with only Tron showing a decline of 8%. In terms of market share, Ethereum continues to dominate the DeFi sector with an absolute advantage, holding 62% of the total TVL, followed by Solana with a 10% share.
The standout this quarter is Hyperliquid L1, whose TVL skyrocketed by 547%. This high-performance Layer 1 blockchain is designed for on-chain perpetual contracts and spot trading, utilizing a HyperBFT consensus model inspired by HotStuff.
We also researched the most active DeFi decentralized applications in the second quarter of 2025, providing an in-depth analysis of the areas with the highest user engagement.
Ultimately, we analyzed the investments flowing into the DeFi sector this quarter. The sector raised a total of $483 million, a 50% decrease compared to the first quarter. So far in 2025, DeFi projects have secured approximately $1.4 billion in financing. Although this figure indicates a slowdown compared to the explosive growth seen in previous cycles, it still demonstrates stable interest from capital in the sector and may suggest a more mature direction for capital allocation. Let's see how the trends unfold for the rest of this year, but for now, it seems that the trend is stabilizing.
3. NFT sales surged by 78%, but transaction volume declined: RWA and gaming lead market transformation
We all hope for a revival in the NFT market; despite the overall attention remaining, some core data is still not optimistic. This quarter, NFT transaction volume plummeted by 45%, but transaction numbers increased by 78%. This confirms a long-observed trend: NFTs are becoming increasingly affordable, but market enthusiasm has not waned; instead, it has shifted in nature.
To better understand the reasons behind this transformation, we analyzed the NFT categories with the highest transaction volume this quarter, revealing an interesting phenomenon: new narratives are emerging, while old narrative patterns are making a comeback.
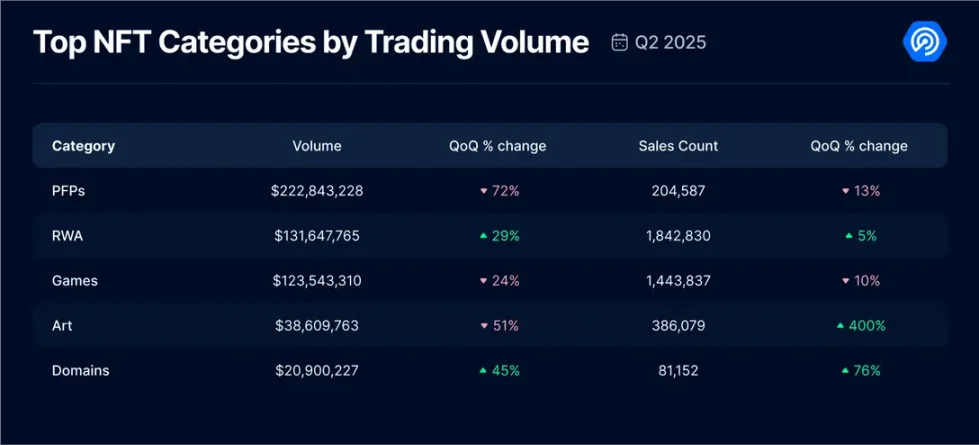
Data shows that the trading volume of personal avatar NFTs has been severely impacted, plummeting by 72%. In contrast, real-world asset (RWA) NFTs have surged to second place in trading volume with a 29% increase. The trading volume of art NFTs has decreased by 51%, but the number of transactions has skyrocketed by 400%, indicating that art prices have significantly dropped, making art NFTs more accessible to average buyers.
A recently returning trend is domain NFTs, which have seen both transaction volume and sales rise. This growth is primarily driven by the TON public chain ecosystem, as Telegram users are rushing to purchase anonymous domain names based on digital numbers. These domain names can be linked to Telegram accounts without needing to bind a SIM card, clearly catering to a specific demand and sparking market enthusiasm.
After understanding which categories are becoming trends, we began to focus on the number of traders to determine whether market participants are steadily increasing or returning.
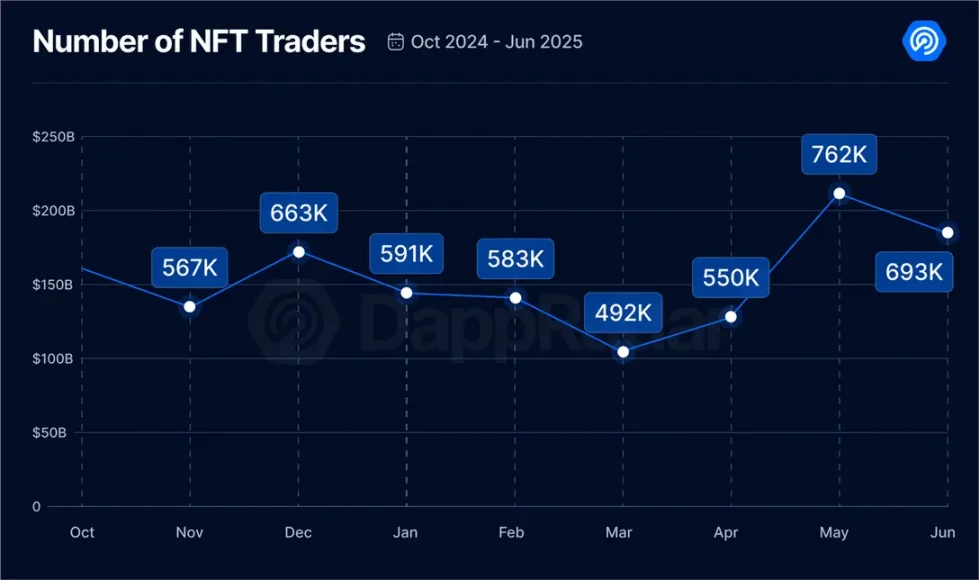
This quarter, the average monthly NFT traders reached 668,598, a 20% increase from the previous quarter. Combined with the surge in sales, this indicates that users are slowly but steadily returning to the NFT space, although their motivations may differ from those during past booms.
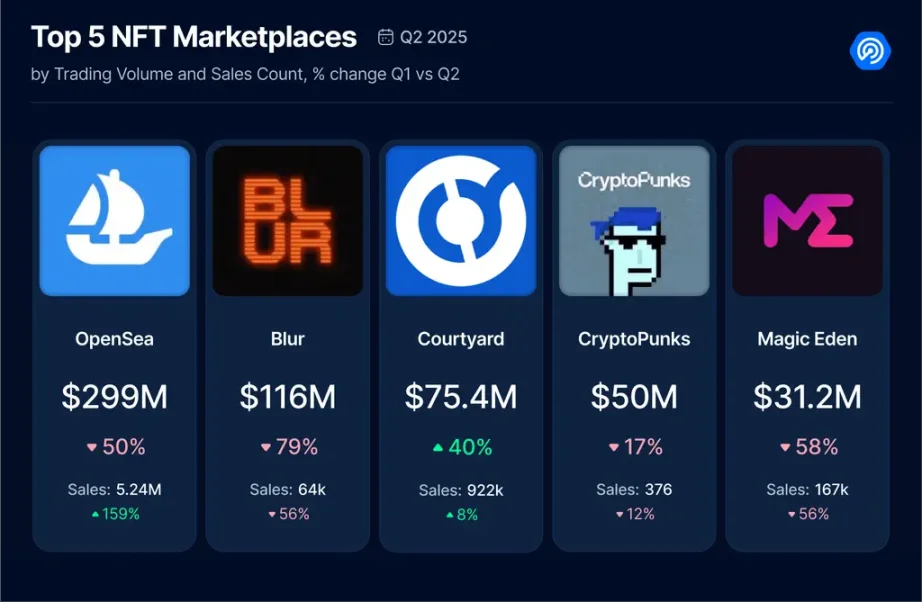
Despite a significant drop in transaction volume, OpenSea still maintains its leading position. However, its sales have risen in tandem with the Courtyard platform. This growth for OpenSea is closely related to the upcoming launch of the SEA token. This airdrop will target both long-time users and those currently active on the updated version of the platform. As a result, many users are actively trading low-priced NFT collectibles to earn points, attempting to maximize future reward gains, a classic strategy seen in other airdrop events.
Meanwhile, the Courtyard platform has rapidly ascended to the second position in the industry. This clearly indicates that the narrative around RWA is not only gaining traction in the DeFi sector but is also making waves in the NFT space. Frankly, this development is encouraging. The tokenization of physical assets could very well become a key catalyst for bringing NFTs into the mainstream.
We also investigated which product series dominated in the second quarter of 2025, and the data revealed an unexpected shift.
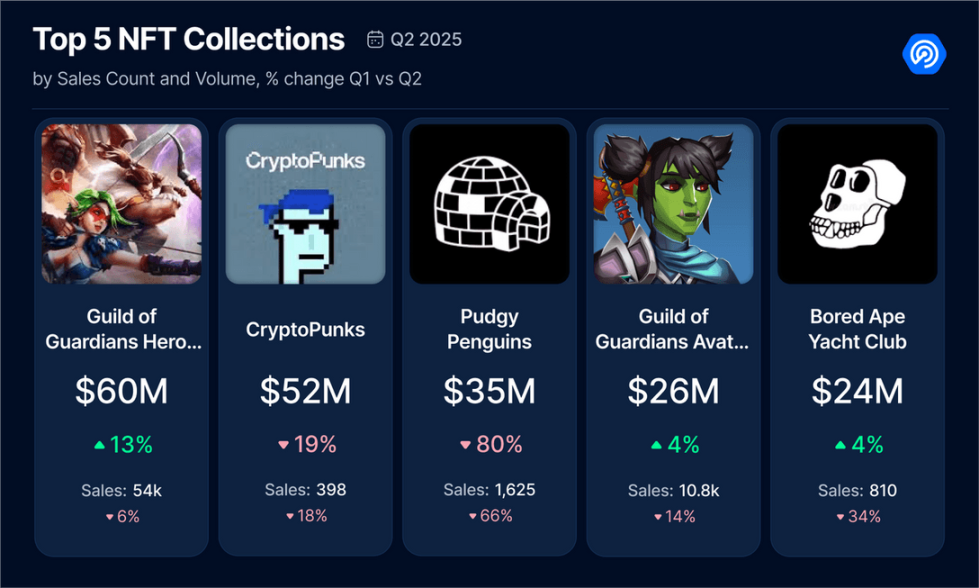
After a considerable period (possibly years), a gaming NFT collection has topped the quarterly trading volume for the first time. Guild of Guardians not only made it into the top five but also secured two positions, surpassing blue-chip projects like CryptoPunks and Bored Ape Yacht Club. This confirms the overall trend we have observed: the NFT market activity in the second quarter is primarily driven by RWA and gaming assets. Now, we finally have data to support this assertion.
4. $6.3 billion lost in the second quarter due to exploit attacks, marking one of the worst quarters since the FTX collapse
We had hoped that after so many years, the entire industry would have learned lessons and remained vigilant, treating user funds more cautiously and achieving a certain level of maturity. Unfortunately, the reality this quarter is quite the opposite. In the second quarter of 2025, the Web3 sector lost $6.3 billion due to hacker attacks and security vulnerabilities, a 215% increase from the previous quarter, marking one of the heaviest loss records since the FTX collapse.
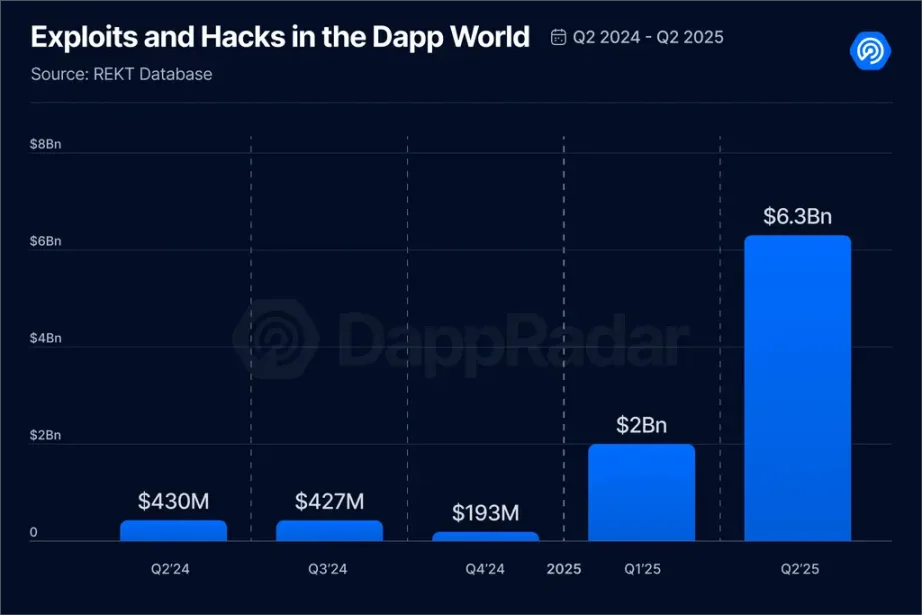
If there is a glimmer of hope, albeit extremely faint, it is that 87% of the losses came from a single event: the Mantra collapse. From certain perspectives, this might be a positive sign: there were only 31 security incidents throughout the year, which is not many; it is just the severity of a single case that inflated the overall losses. That said, it raises the question: are we truly building safer and more reliable products, or are we merely relying on luck to avoid disaster?
To be precise, the top five incidents this quarter are as follows:
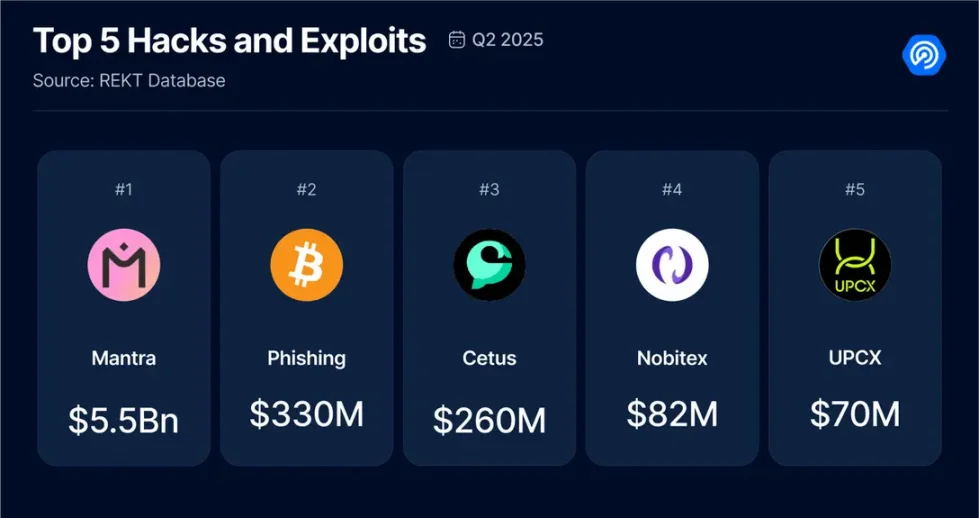
- Mantra insider sell-off incident (April 13, 2025): The price of Mantra's token OM plummeted over 90%, evaporating $5.5 billion in market value. This incident was confirmed to be caused by coordinated sell-offs by internal personnel, rather than a technical vulnerability in the smart contract.
- Individual user private key theft incident (April 28, 2025): Due to a social engineering attack, a personal user's crypto wallet was hacked, resulting in the theft of 3,520 bitcoins (approximately $330.7 million).
- Cetus Protocol hacking incident (May 22, 2025): The mainstream DEX of the Sui ecosystem was attacked, with $260 million stolen, leading to a more than 90% drop in the platform's token price and a forced suspension of smart contract activities.
- Nobitex exchange hacking incident (June 18, 2025): The Iranian crypto exchange Nobitex was hacked, resulting in losses exceeding $82 million. The pro-Israel hacker group Gonjeshke Darande claimed responsibility for the attack and threatened to leak the platform's internal code and user data.
- UPCX protocol vulnerability incident on April 1, 2025: Attackers infiltrated the ProxyAdmin smart contract, implemented unauthorized upgrades, and abused administrative privileges to drain funds from three management accounts in three transactions, stealing a total of 18.4 million UPC (approximately $70 million).
This is truly disheartening. It makes you question how much progress we have actually made. At the same time, we know that many projects are actively advancing more robust security infrastructure, audits, and emergency response plans.
As developers, investors, and users, the most we can do is to be security-conscious, stay informed, and act cautiously.
Use tools like DappRadar to verify the projects you interact with. While this is not always foolproof, it is a good starting point.
5. Conclusion
As the second quarter of 2025 comes to a close, DApps are clearly entering a new phase, marked by integration and transformation. Although overall activity (referring to the number of daily active wallets) remains stable at around 24 million, we are witnessing a significant shift in user behavior and the dominant sectors of the industry. Driven by emerging narratives such as InfoFi and the AI agent economy, AI and social DApps are rapidly rising. The NFT sector is also undergoing transformation, with RWA and gaming assets taking the lead, indicating a directional shift from speculative hype to practical value.
Even as capital cools, DeFi maintains its core pillar status with strong total locked value growth and price recovery. However, the surge in losses due to exploits serves as a stark reminder to the industry: the lack of reliable security measures could hinder its development.
It is evident that users have not left the space; they have simply chosen different ways to experience it. The current challenge lies in creating DApps that are not only attractive but also ensure security, sustainability, and real value creation. We will closely monitor these future developments and continue to provide in-depth reporting.
免责声明:本文章仅代表作者个人观点,不代表本平台的立场和观点。本文章仅供信息分享,不构成对任何人的任何投资建议。用户与作者之间的任何争议,与本平台无关。如网页中刊载的文章或图片涉及侵权,请提供相关的权利证明和身份证明发送邮件到support@aicoin.com,本平台相关工作人员将会进行核查。


