Author: Hoeem
Compiled by: Tim, PANews
What is the most overlooked metric in the crypto space? The Price-to-Earnings ratio (P/E). It can quickly help you determine whether a cryptocurrency is overvalued or undervalued, whether a surge is imminent or if there are hidden risks, whether it is a speculative growth stock or a bubble, and it allows you to see through market sentiment.
This article will teach you how to analyze the P/E ratio, but first, you need to understand this concept like a professional.
Understanding the P/E Ratio
1. Quickly Identify Overvalued and Undervalued Assets
P/E Ratio = Price per Share ÷ Earnings per Share
- This indicates the price investors are willing to pay for each $1 of earnings.
- High P/E Ratio = Market expects growth (but may be overvalued).
- Low P/E Ratio = May indicate a value investment opportunity or a warning signal.
2. Comparative Analysis of Similar Protocols
Rank similar companies or cryptocurrencies based on earnings.
- Project A has a P/E of 10, Project B has a P/E of 30.
- Same industry sector, similar fundamentals? Then Project A may be undervalued.
3. Insight into Market Sentiment Using P/E Ratio
The P/E ratio is not just a numerical calculation; it reflects market sentiment.
- High P/E Ratio = Market optimism, speculative sentiment, and growth expectations.
- Low P/E Ratio = Fear, doubt, or market mispricing.
4. Scenario Analysis of Earnings
Raw profits ≠ The whole truth.
- The P/E ratio helps assess earnings within the industry context.
- It indicates the market's valuation of each dollar of net profit.
5. Finding Potential Growth Stocks
- Value investors favor low P/E stocks with strong fundamentals.
- Growth investors chase high P/E ratios and accelerated growth potential.
- The key is to understand why the market is pricing it this way.
Additional Advice
The P/E ratio is like a speedometer; it tells you how quickly the market is digesting expectations. But just as speed needs to be interpreted in context, valuations also require specific backgrounds for a more comprehensive view.
How to Quickly Calculate the P/E Ratio of Cryptocurrencies
1. Visit DeFiLlama
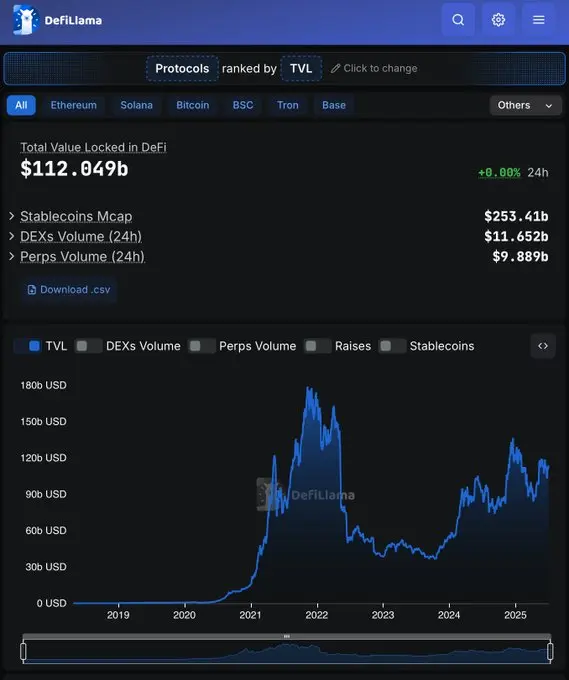
Okay, I'm now on DeFiLlama, what's next?
2. Then check the "Revenue" and "Fees" pages
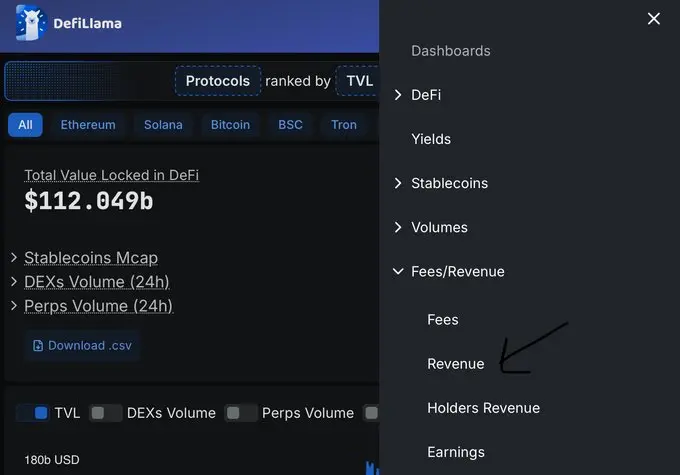
Great, I've found this place, what's the next step?
3. Select the filtering categories you want to compare
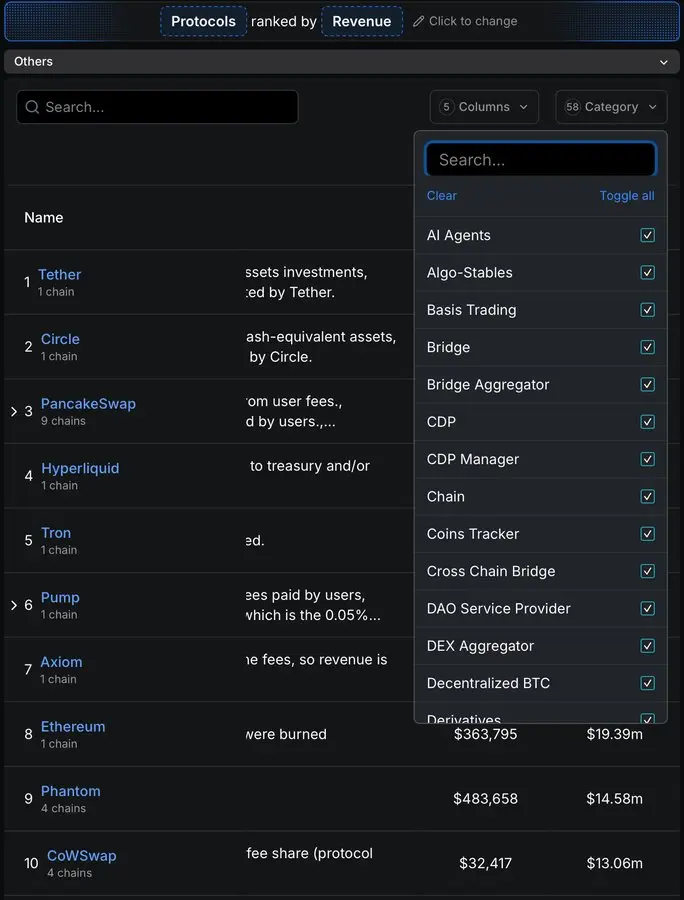
Got it, I can compare them all, which is fairer.
4. Click on "30-Day Revenue"
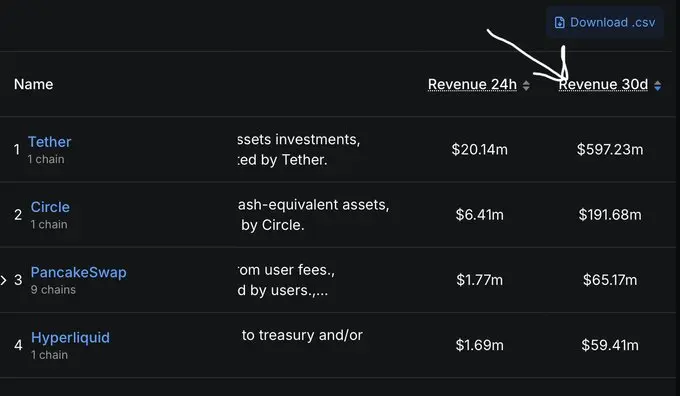
Yes, found it.
5. Take a screenshot of the data page
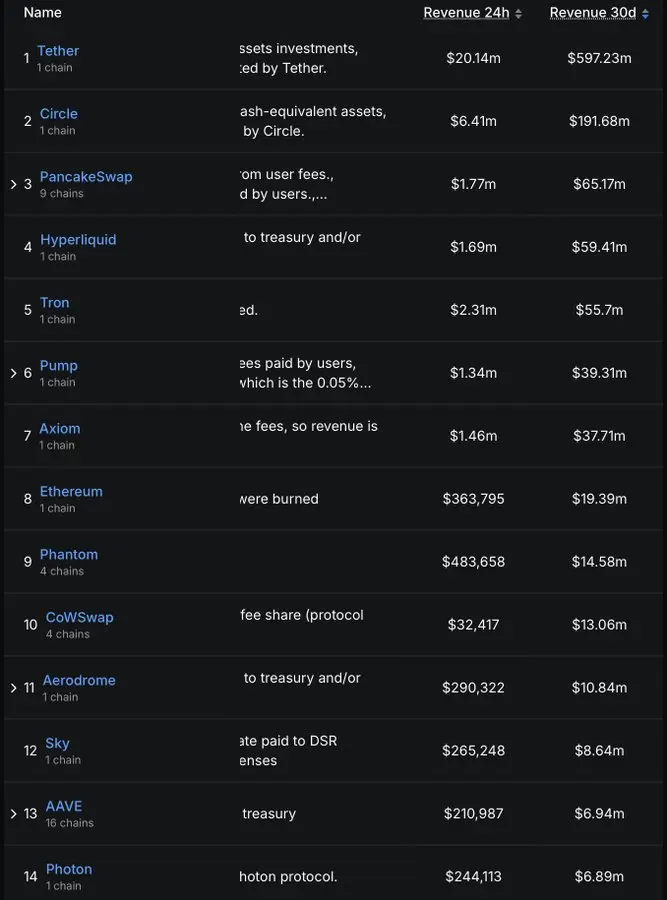
This operation is really simple.
6. Go to a large language model website that can connect to the internet

7. Input the prompt + screenshot (copy and paste below)
Prompt
You are a professional cryptocurrency fundamental analyst.
Data Collection Process
Revenue – Extract the protocol's 30-day revenue (in USD) from the provided DeFiLlama screenshot. Use OCR technology; ignore any entries with empty revenue or revenue ≤ 0.
Market Cap and Fully Diluted Valuation – Obtain real-time data from CoinGecko or CoinMarketCap (try to use data from the same day). Match by token symbol; skip if any data is missing for the protocol.
Classification Focus – Only consider user-specified DeFiLlama categories (e.g., Decentralized Exchanges DEX, Lending Protocols, Liquid Staking Tokens LST, Perpetual Contracts Perps, etc.).
Filtering and Screening
Exclude protocols with P/E < 0 or > 1000.
Calculate P/E Ratio = Market Cap ÷ (30-Day Revenue × 12).
Return the 20 projects with the lowest P/E ratios (i.e., the most "undervalued").
For each project, also calculate the "Revenue to Fully Diluted Valuation Ratio" = (30-Day Revenue ÷ FDV) × 100%.
Output: Generate a neat Markdown table, sorted in ascending order by P/E ratio, and additionally add a header showing the average P/E ratio and average revenue to fully diluted valuation ratio of the final list.
Abbreviate numbers in K/M/B format for better readability.
Column Settings:
Protocol Name
Token Symbol
P/E
30-Day Revenue (USD)
Circulating Market Cap (USD)
Fully Diluted Market Cap (USD)
Chain
Brief Introduction
Revenue to Fully Diluted Valuation Ratio (%)
Quality Check, Ensure:
Revenue and Fully Diluted Valuation are presented simultaneously.
Correct according to DeFiLlama's classification labels.
Current data is up-to-date (data fetched from CoinGecko or CoinMarketCap updated within the last 48 hours).
The table is easy to browse, with no missing values.
Goal: To help cryptocurrency investors quickly identify tokens with potential price deviations in selected tracks through core metrics (P/E ratio and revenue/fully diluted valuation ratio).
Example:
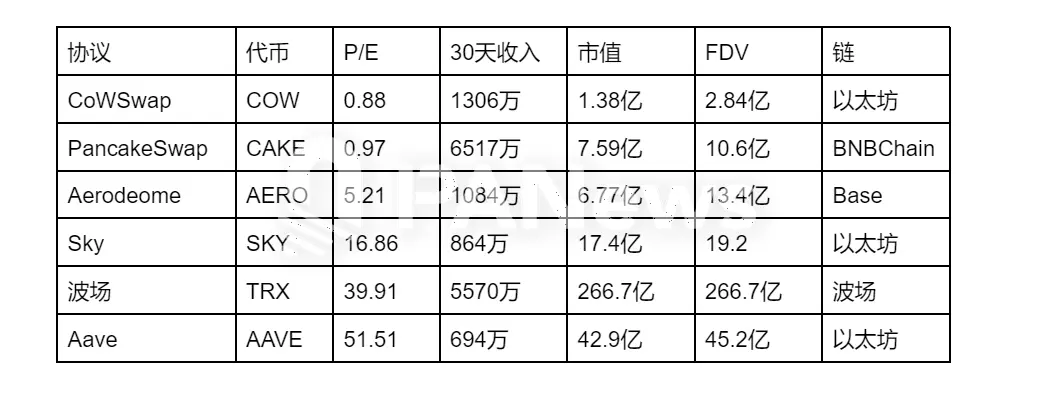
Comparing circulating market cap with fully diluted valuation, while also paying attention to whether there have been any recent token unlocks, is also very important.
So, now you understand how to use the P/E ratio and know how to find it.
免责声明:本文章仅代表作者个人观点,不代表本平台的立场和观点。本文章仅供信息分享,不构成对任何人的任何投资建议。用户与作者之间的任何争议,与本平台无关。如网页中刊载的文章或图片涉及侵权,请提供相关的权利证明和身份证明发送邮件到support@aicoin.com,本平台相关工作人员将会进行核查。


