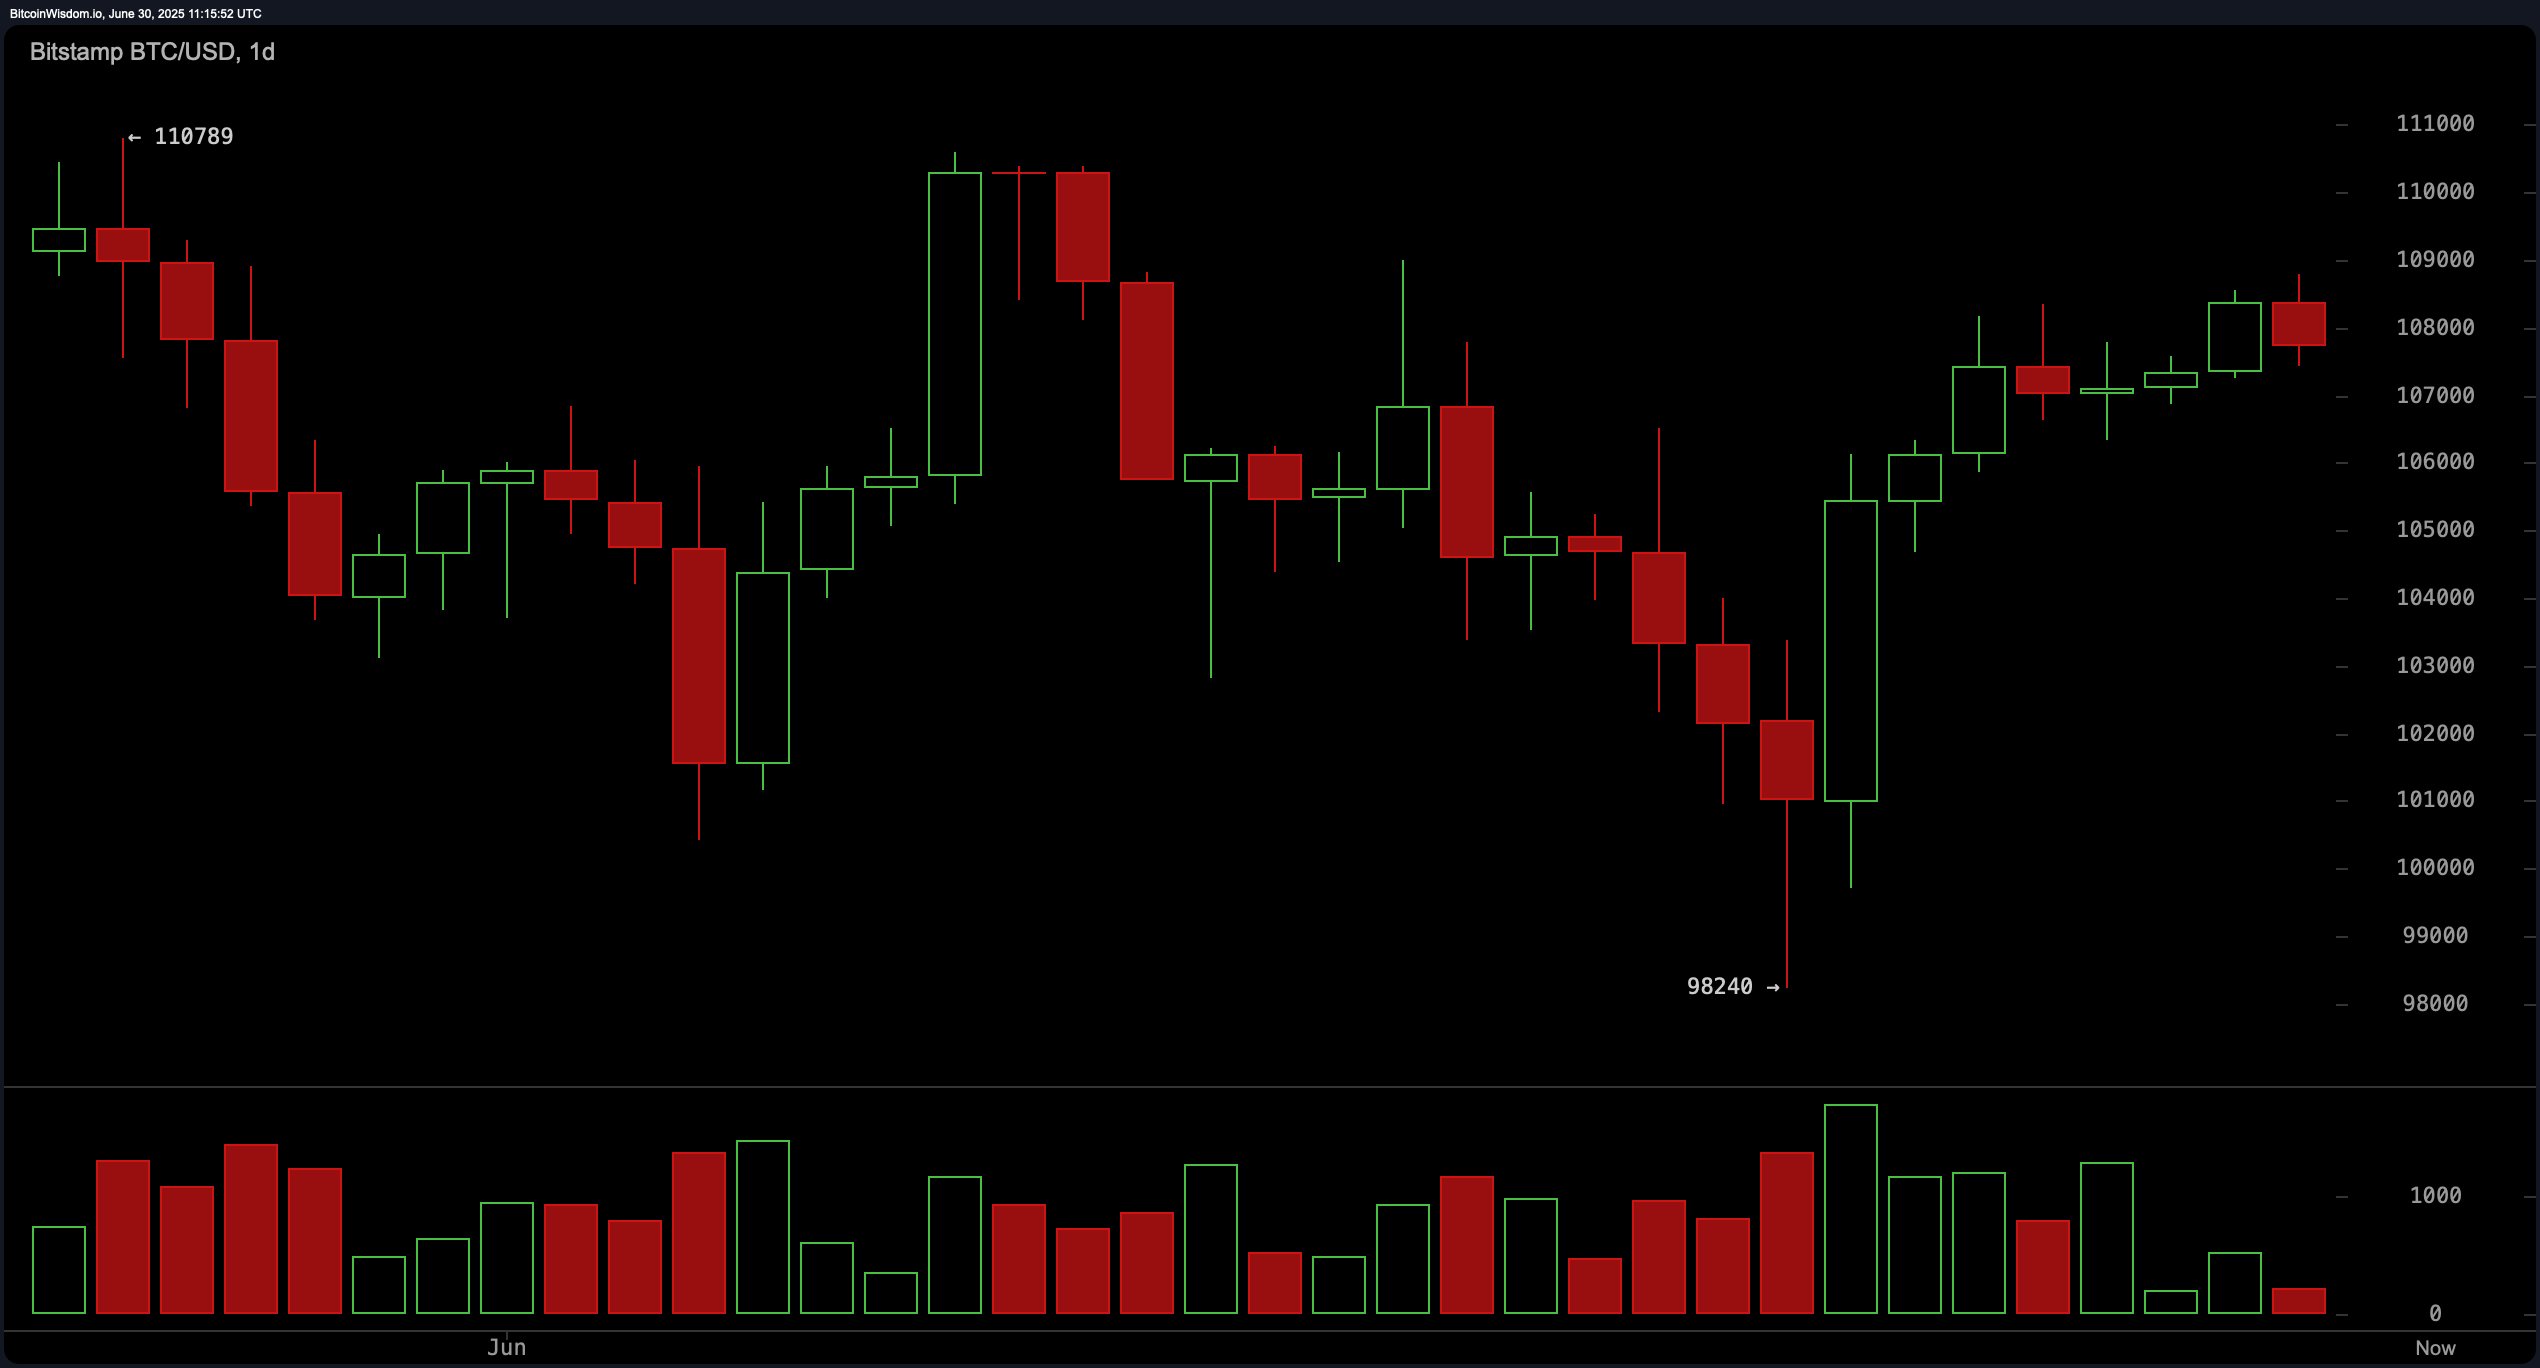
A multi-timeframe review of bitcoin’s price action reveals a bullish technical structure developing across the daily, 4-hour, and 1-hour charts. On the daily timeframe, price rebounded sharply from the $98,000 range, forming a bullish engulfing candlestick pattern, often indicative of bottoming behavior. Notably, this reversal was accompanied by rising volume on green candles, suggesting accumulation. The price now resides in the $107,000–$108,000 zone, with a key target of $110,000. However, a daily close below $100,000 would invalidate the bullish setup.

BTC/USD daily chart via Bitstamp on June 30, 2025.
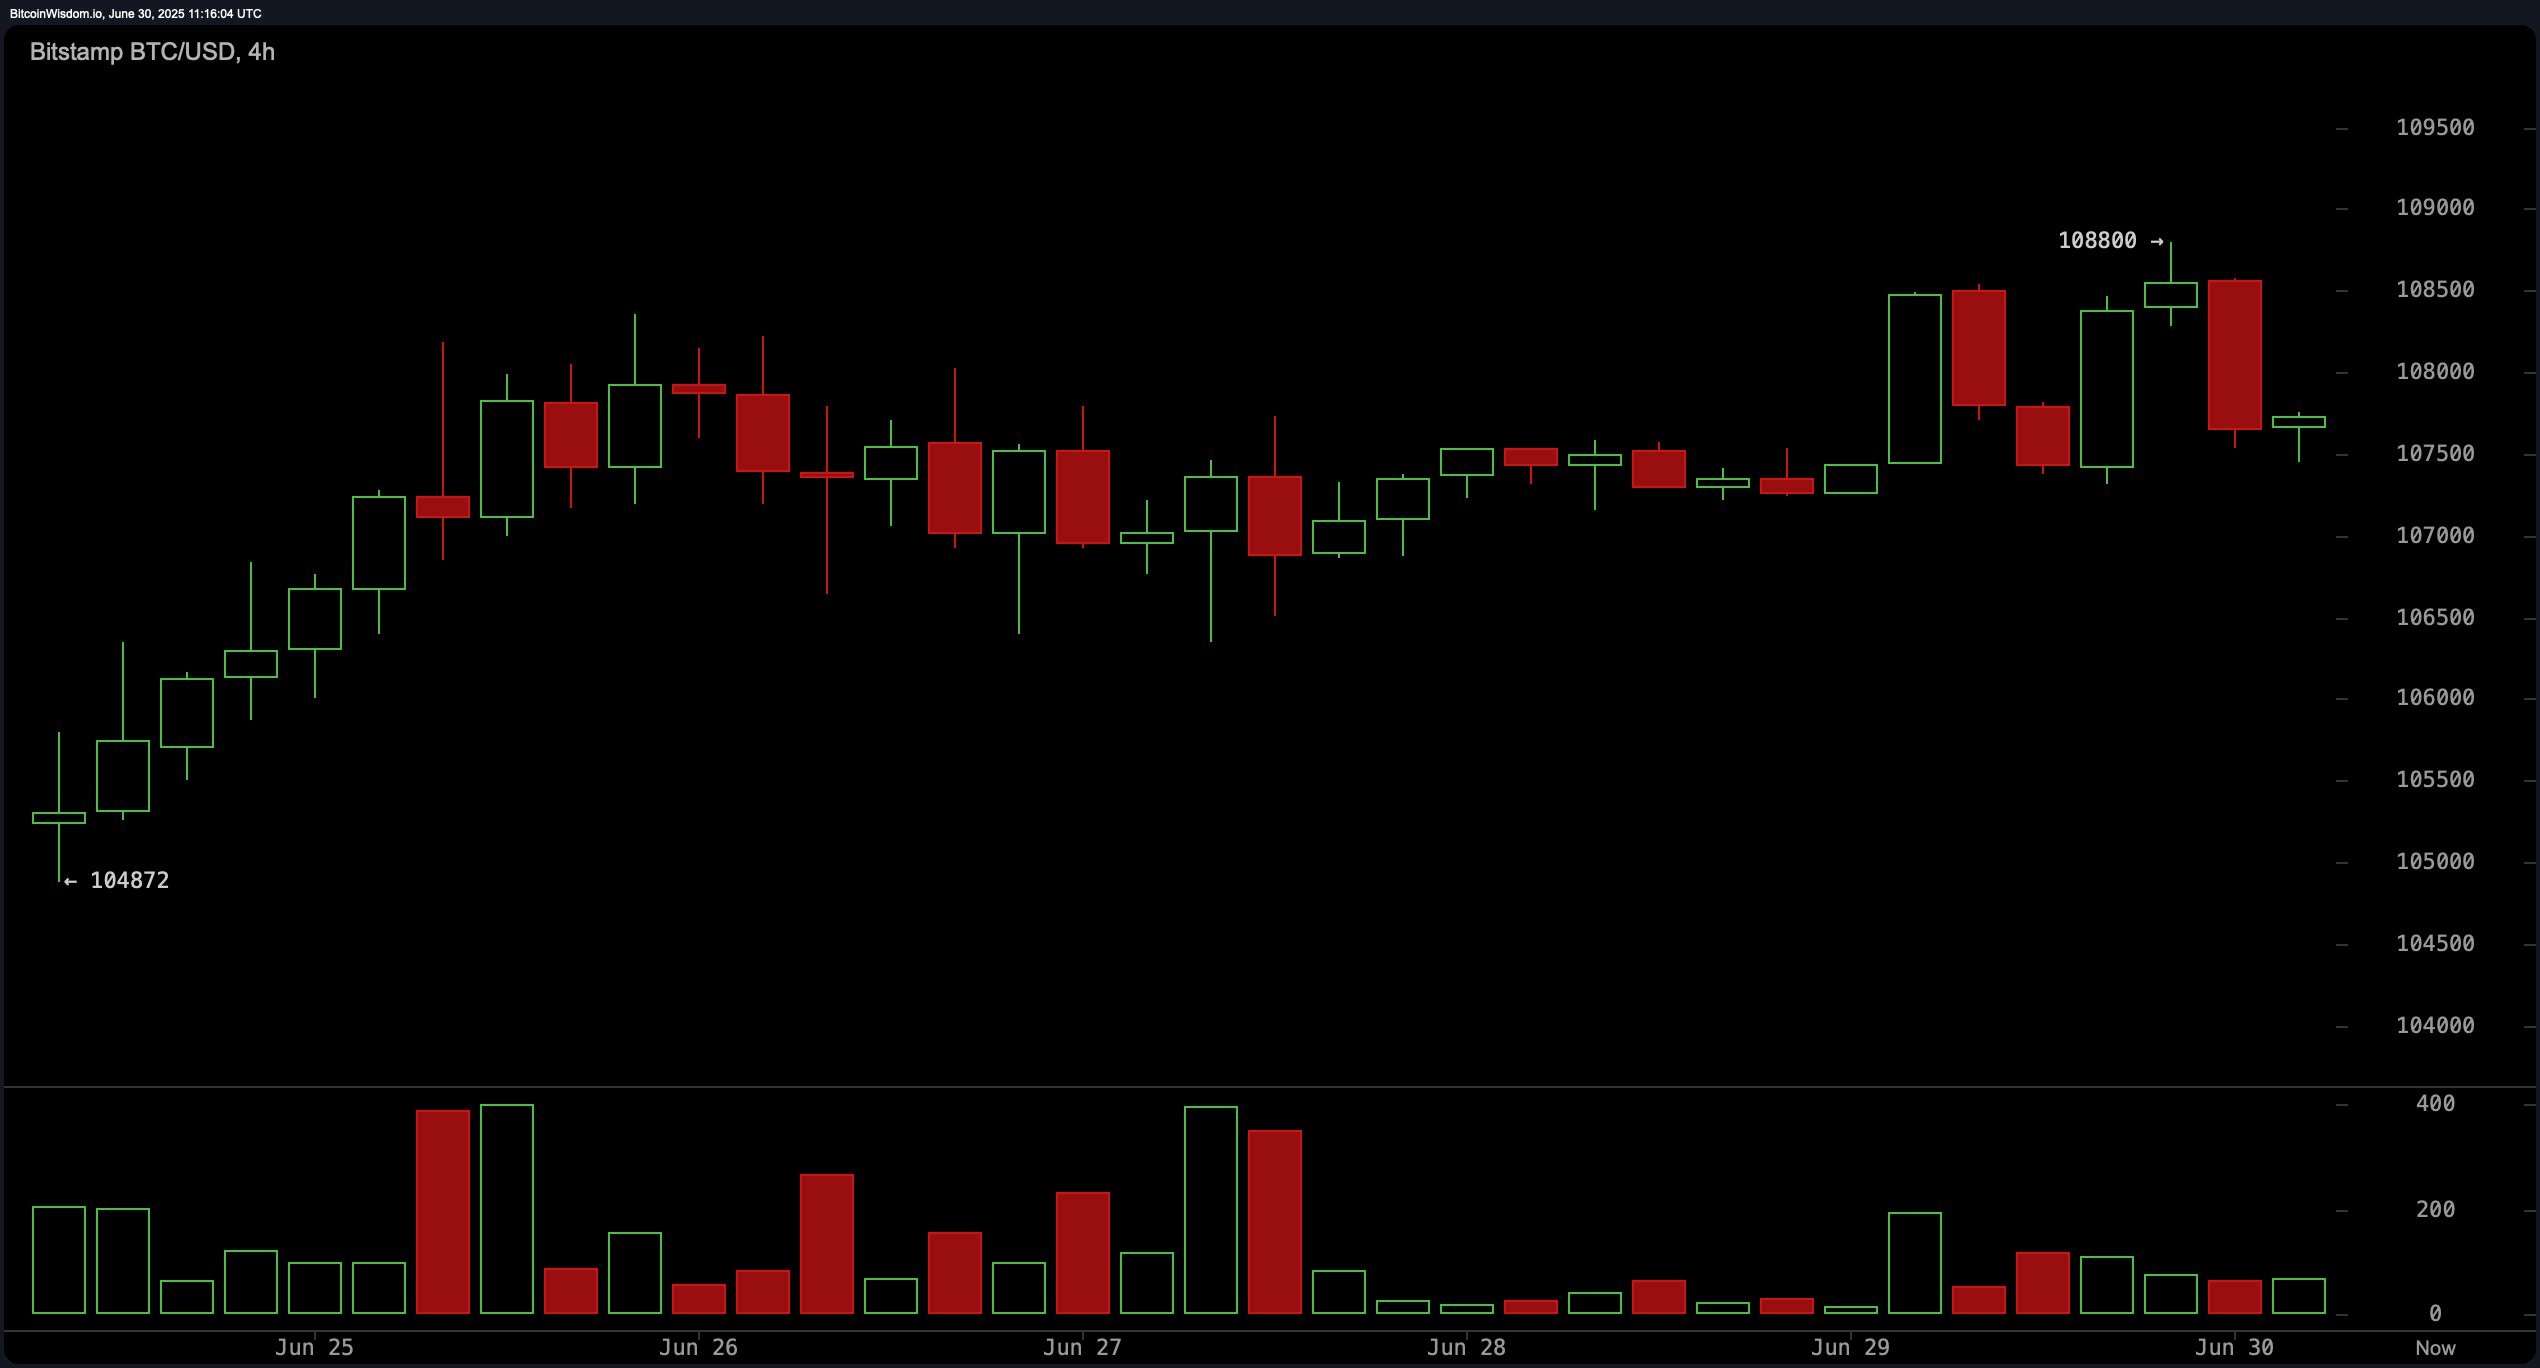
The 4-hour BTC/USD chart highlights a continuation of higher highs and higher lows, though momentum recently paused below $108,800. Consolidation is currently occurring just beneath this level. The emerging bullish continuation wedge pattern may break to the upside, with a decisive move above $108,800 serving as confirmation. Lower volume implies hesitancy, but any uptick alongside a breakout could pave the way for targets around $110,000. Conversely, a decline below $107,000 would signal renewed bearish pressure.

BTC/USD 4-hour chart via Bitstamp on June 30, 2025.
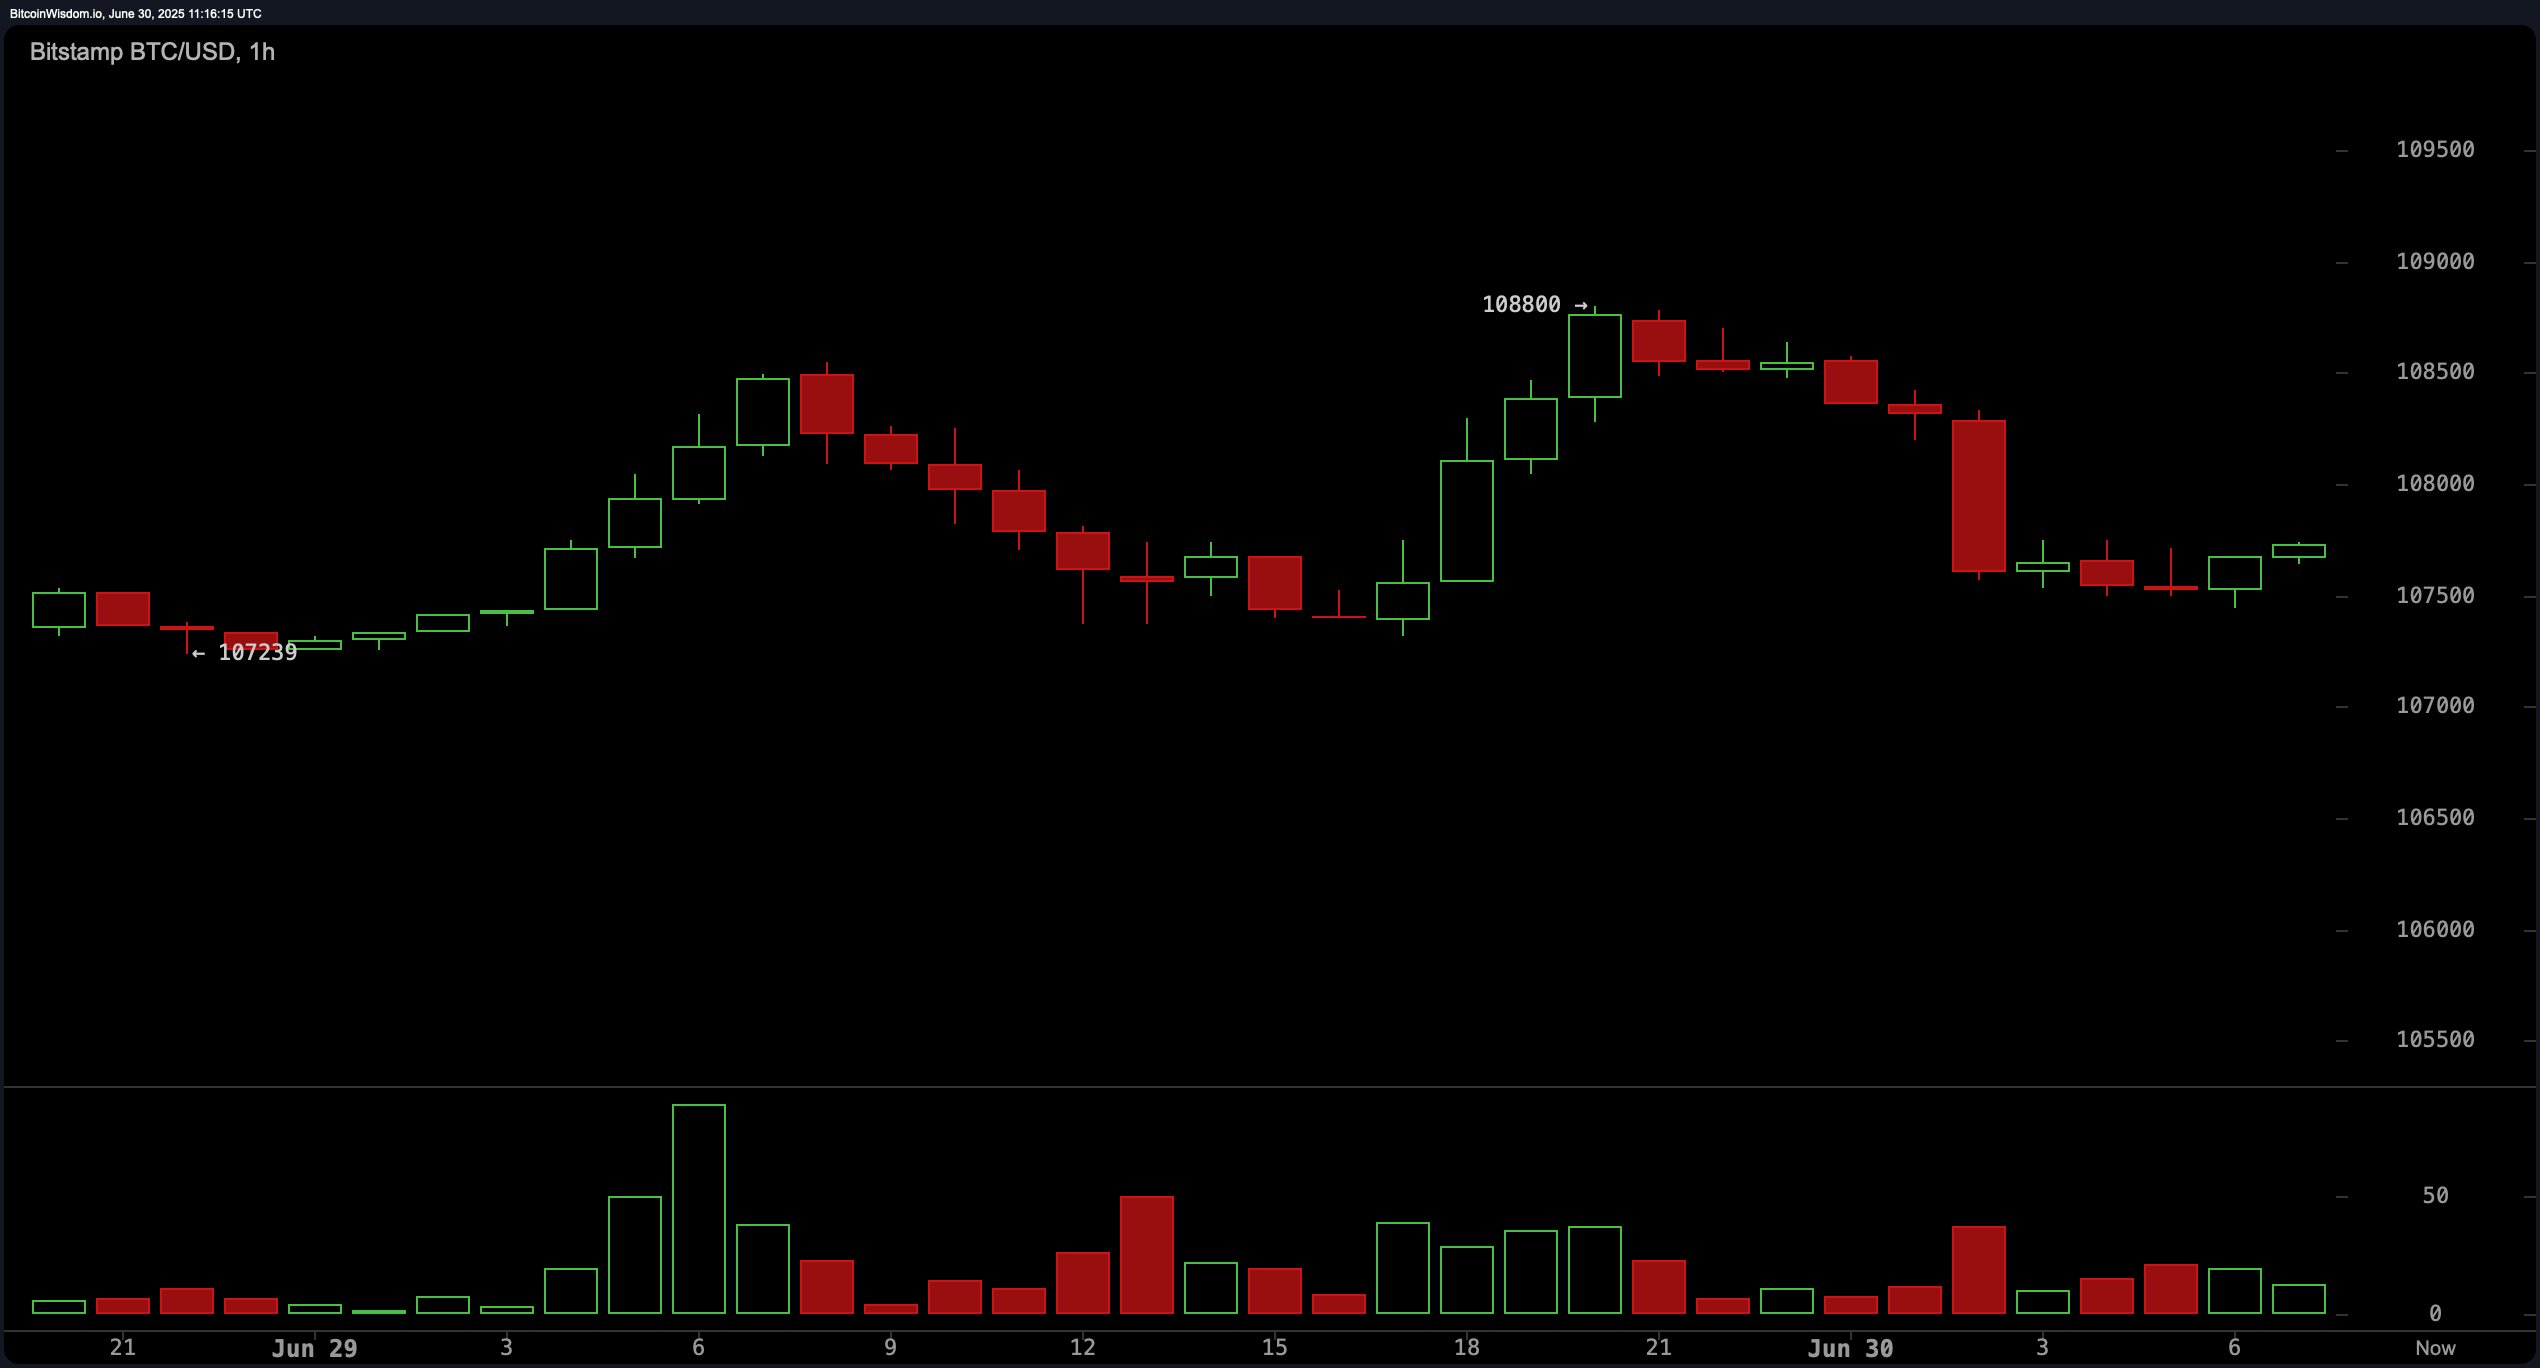
In the 1-hour timeframe, bitcoin shows a pattern of tight consolidation around $107,500 to $107,800 following a sharp pullback. An inverse head-and-shoulders pattern appears to be forming, pointing to potential short-term upside. The price is exhibiting early signs of recovery, with green candles reflecting buyer interest despite diminished volume. If this pattern confirms, bitcoin could revisit $108,500 and $108,800 in the near term, though any breakdown below $107,000 could jeopardize the bullish narrative.

BTC/USD 1-hour chart via Bitstamp on June 30, 2025.
Supporting this structure, a majority of moving averages (MAs) indicate bullish sentiment. The exponential moving averages (EMAs) and simple moving averages (SMAs) from the 10-period to the 200-period range—such as the 10-period EMA at $106,703 and the 200-period EMA at $94,608—all signal buying momentum. These moving averages help validate the market’s underlying strength and reinforce the case for sustained upward movement if key resistance levels are breached.
Oscillators offer a more mixed outlook, with most indicators in neutral territory. The relative strength index (RSI) at 56, the stochastic at 90, and the commodity channel index (CCI) at 94 all signal a neutral stance. The momentum indicator and the moving average convergence divergence (MACD) level, however, both flash buy signals, suggesting an underlying positive shift in price pressure. Notably, the stochastic RSI fast is in a sell position at 95, indicating the need for cautious optimism until more definitive confirmation appears.
In summary, while bitcoin maintains a bullish technical posture supported by favorable moving averages and strong daily structure, traders should monitor breakout levels closely. A sustained move above $108,800 with accompanying volume could act as the next catalyst for a test of the $110,000 mark.
Bull Verdict:
Bitcoin’s current price structure across all major timeframes suggests a bullish outlook, with consistent support from moving averages and a recovering daily trend. Should the price break above $108,800 with strong volume confirmation, the next leg toward $110,000 appears likely, validating the bullish case and signaling continued accumulation by market participants.
Bear Verdict:
Despite signs of recovery, bitcoin’s failure to decisively break $108,800 and mixed oscillator readings introduce caution. A drop below $107,000 would undermine bullish momentum, potentially triggering a deeper pullback toward the $105,000 area or even back to the $102,000–$100,000 support zone, nullifying short-term upside expectations.
免责声明:本文章仅代表作者个人观点,不代表本平台的立场和观点。本文章仅供信息分享,不构成对任何人的任何投资建议。用户与作者之间的任何争议,与本平台无关。如网页中刊载的文章或图片涉及侵权,请提供相关的权利证明和身份证明发送邮件到support@aicoin.com,本平台相关工作人员将会进行核查。


