When we can't hold on any longer, we need to give ourselves the biggest hug. Because dear self, we cannot let ourselves down, nor our dreams. We must tell ourselves that the wounds on our hearts cannot be watered with weak tears, but must be healed with the blood of struggle. We can be sad, but after our sadness, we need to adjust ourselves and walk out of it.

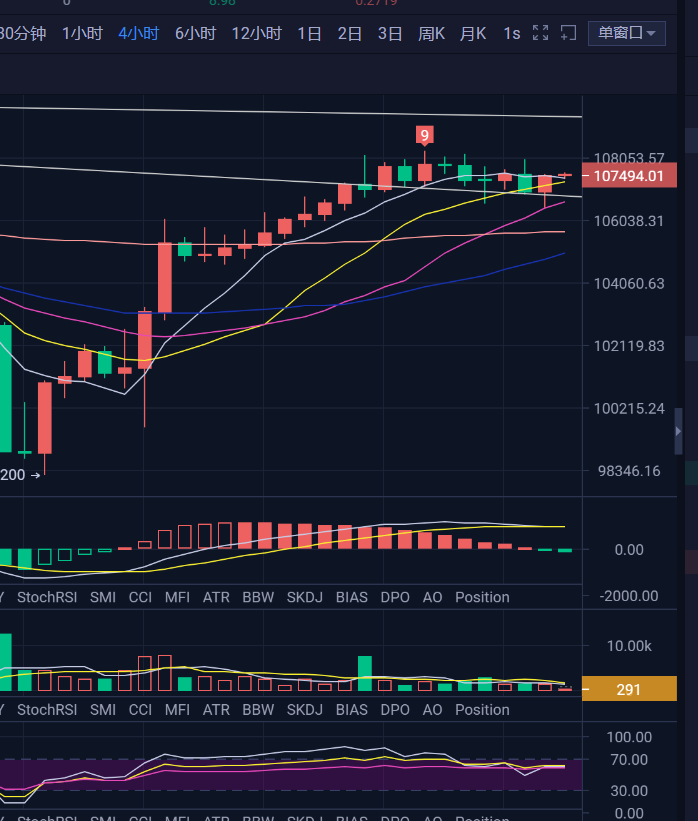
There isn't much to review about yesterday's market; it followed a fluctuating trend. The only notable fluctuation was the spike to 106400 this morning, which then rebounded. Considering the drop below 107000 last night and the subsequent recovery, the market has been oscillating back and forth at this position, giving the impression of a strong bullish performance that refuses to drop. However, it is important to note the trading volume here, which clearly shows a problem of shrinking volume; essentially, it is a volume-less rise. As we mentioned yesterday, the market is slowly rising but quickly falling. A market with low volume can easily experience sudden drops. From another perspective, the repeated spike and recovery in a market that has been steadily rising might give the bulls confidence, attracting them to enter the market, only for a drop to become a reality. Such situations are not unheard of. Until the market moves decisively, we can only wait. In terms of operations, the only change from yesterday's market is that we adjusted our original short position from 107200 to around 107600, resulting in no profit or loss; everything else remains largely unchanged. If the market moves upward, we are still prepared to add positions at 108600; if it moves downward, we could make a profit. We can defend above and attack below; it’s all good.
Returning to the market, in terms of liquidity, the fluctuations remain unchanged. As mentioned yesterday, we need to pay attention to the gathering of liquidity within the fluctuations. As lower highs and lows appear in the fluctuations, the bullish liquidity clearing intensity begins to increase around 105000, while liquidity at lower levels is around 103000. As we said earlier, in a repeated market, the market provides attraction for bulls, leading to increased positions. On the other hand, the spot premium continues to decline slightly, indicating that there is selling in the spot market during the current fluctuations, while the liquidity for shorts has not significantly increased. The average funding rate in the market has also started to rise, which clearly indicates that the increase in positions is indeed coming from the bulls. We have been emphasizing the idea that the market's movements are currently more influenced by the spot market. Therefore, if we do not see a significant rise in the spot premium and a breakthrough above 108000, we will be more convinced that a pullback will occur to clear the bullish liquidity below.
On the technical side, the daily level remains unchanged from yesterday; the price is still operating above all moving averages, and the K-line structure maintains a bullish arrangement. However, the issue we mentioned is that the market has been continuously closing bullish on the daily level, but the trading volume has been declining, forming a noticeable divergence between volume and price. In terms of technical indicators, MACD has entered a bullish cycle, but due to the prolonged bearish cycle at the daily level without strong volume, we are not overly optimistic about the strength of the bullish cycle. RSI shows some divergence, currently at a relatively high level with signs of downward divergence. The daily cycle requires more time to establish a trend, and no significant market changes can be seen in the short term.
The four-hour level is the opposite of the daily level; the high-level fluctuations have caused MACD to enter a bearish cycle. Currently, there has not been a significant bearish strength emerging from this bearish cycle, but the price has started to operate near the MA7 daily line. If the closing line remains below this moving average, we can observe how the short-term bearish performance will unfold. The RSI also indicates a relatively high level with downward divergence. The expectation for a pullback is quite evident in the four-hour cycle.
In terms of operations, I believe I have covered everything comprehensively. We currently hold a short position and have made preparations for future arrangements. If a pullback occurs, we expect a rebound around 105000, and then we will assess the subsequent market in real-time. If a breakout occurs, we will consider the worst-case scenario of reaching above 110000.
Ethereum has been profitable according to our operations; we shorted at 2500, and it reached the 2380 position, allowing us to easily take profits from the short position. Additionally, buying at 2380 also yielded some profits from the rebound, which is good. Now, around 2450, it seems feasible to short again, and we have profits to operate with, following the trend of Bitcoin.
【The above analysis and strategies are for reference only. Please bear the risks yourself. The article is subject to review and publication, and market changes in real-time may lead to delayed information. Specific operations should be based on real-time strategies. Feel free to contact us for discussions on the market.】

免责声明:本文章仅代表作者个人观点,不代表本平台的立场和观点。本文章仅供信息分享,不构成对任何人的任何投资建议。用户与作者之间的任何争议,与本平台无关。如网页中刊载的文章或图片涉及侵权,请提供相关的权利证明和身份证明发送邮件到support@aicoin.com,本平台相关工作人员将会进行核查。


