Shiba inu (SHIB) whales went bargain hunting early this week after prices dropped to a 16-month low of $0.00001005.
According to CoinDesk's AI research, whales purchased 10.4 trillion SHIB tokens, worth over $110 million, on Monday, marking the largest daily accumulation in five months.
The whale action has likely contributed to the cryptocurrency's 17% price bounce from the 16-month low reached Sunday. Note that the broader crypto market has stabilized following the initial knee-jerk reaction to the tensions in the Middle East. BTC, which fell below $100K over the weekend, last changed hands near $106,000.
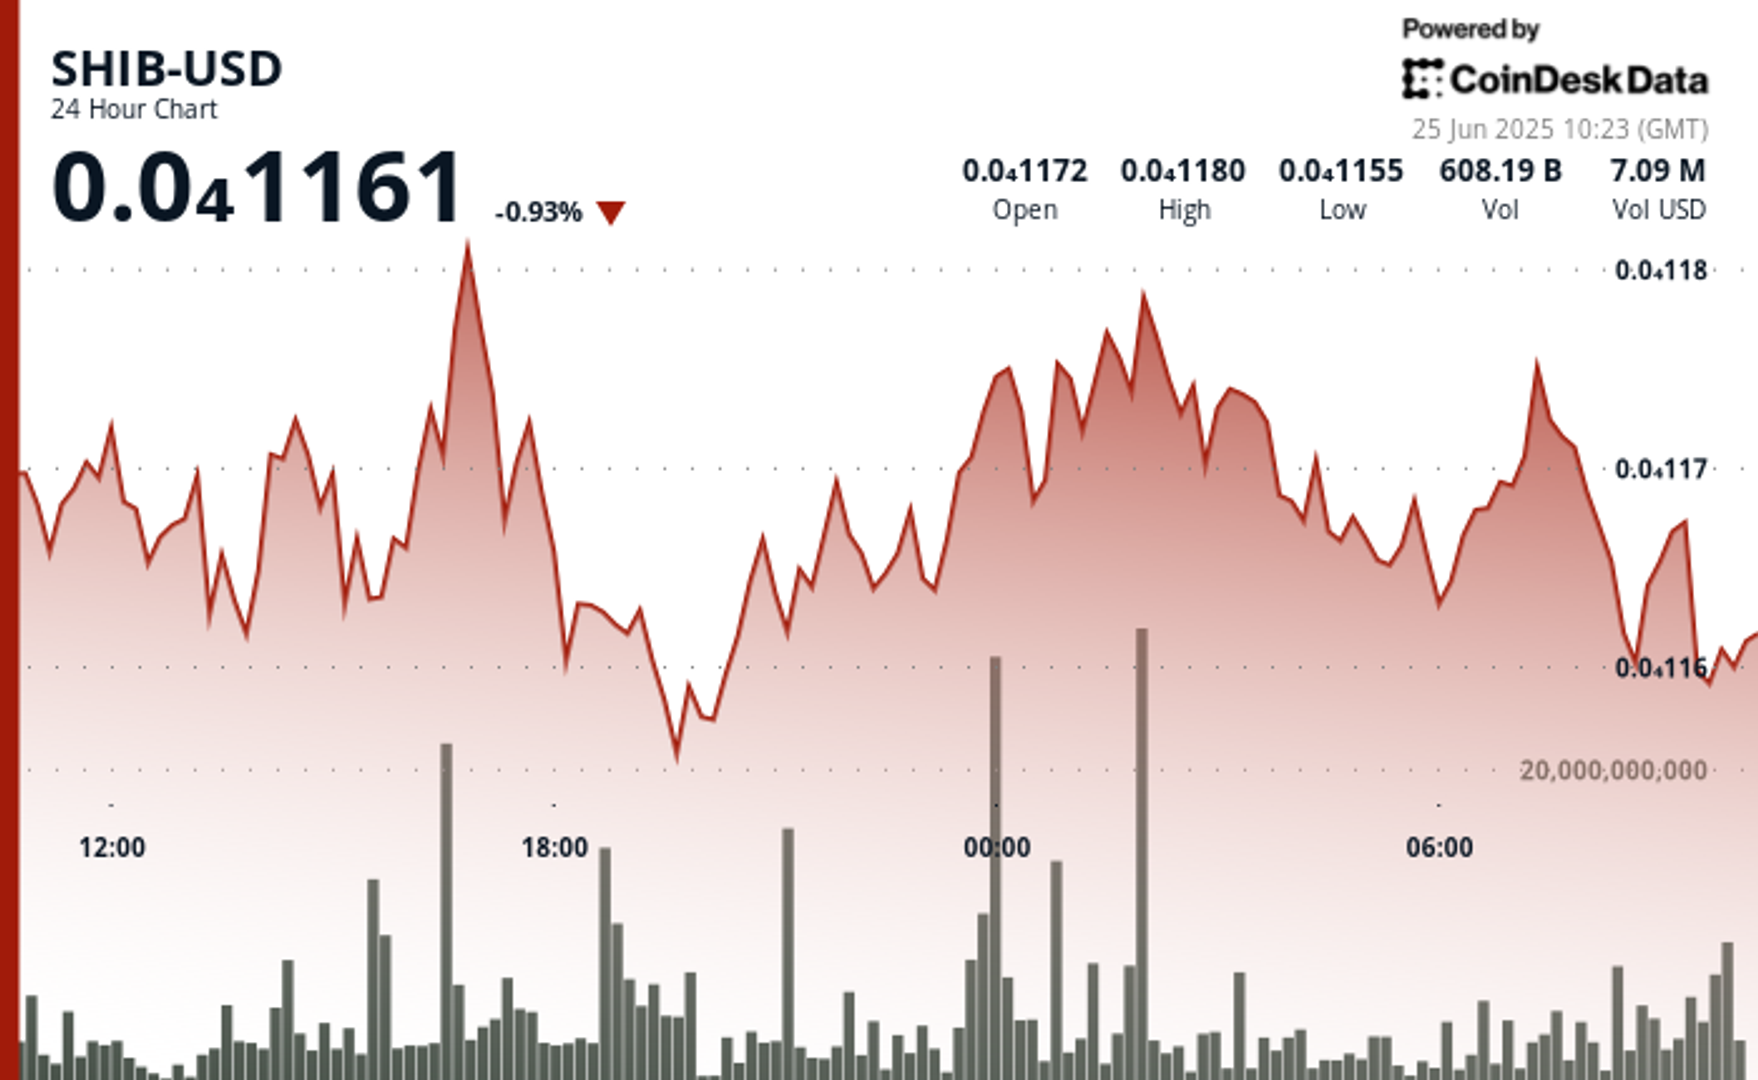
Market data indicate that SHIB is maintaining a generally constructive posture, with higher lows forming a subtle uptrend channel. The token found significant volume support at the $0.00001158 level during the 24 hours from June 24, 09:00 to June 25, 08:00, with trading volume surging to 439 billion, well above the daily average.
This accumulation at support levels suggests the potential for continued upside momentum if the $0.00001175 resistance can be decisively cleared. As of writing, SHIB traded at around $0.00001162 on major exchanges, according to CoinDesk data.
Key AI insights
- Higher lows formed a subtle uptrend channel, suggesting accumulation at support levels and potential for continued upside momentum if $0.00001175 resistance is cleared.
- During the 60 minutes from 25 June 07:06 to 08:05, SHIB climbed from $0.00001169 to $0.00001171, representing a 0.2% gain.
- A significant price surge occurred between 07:25-07:27, with volume peaking at 12.36 billion SHIB as prices reached the session high of $0.00001175.
- Price action formed an ascending channel with higher lows, though a sharp correction at 08:03 tested the $0.00001171 support level, suggesting consolidation after the earlier rally.
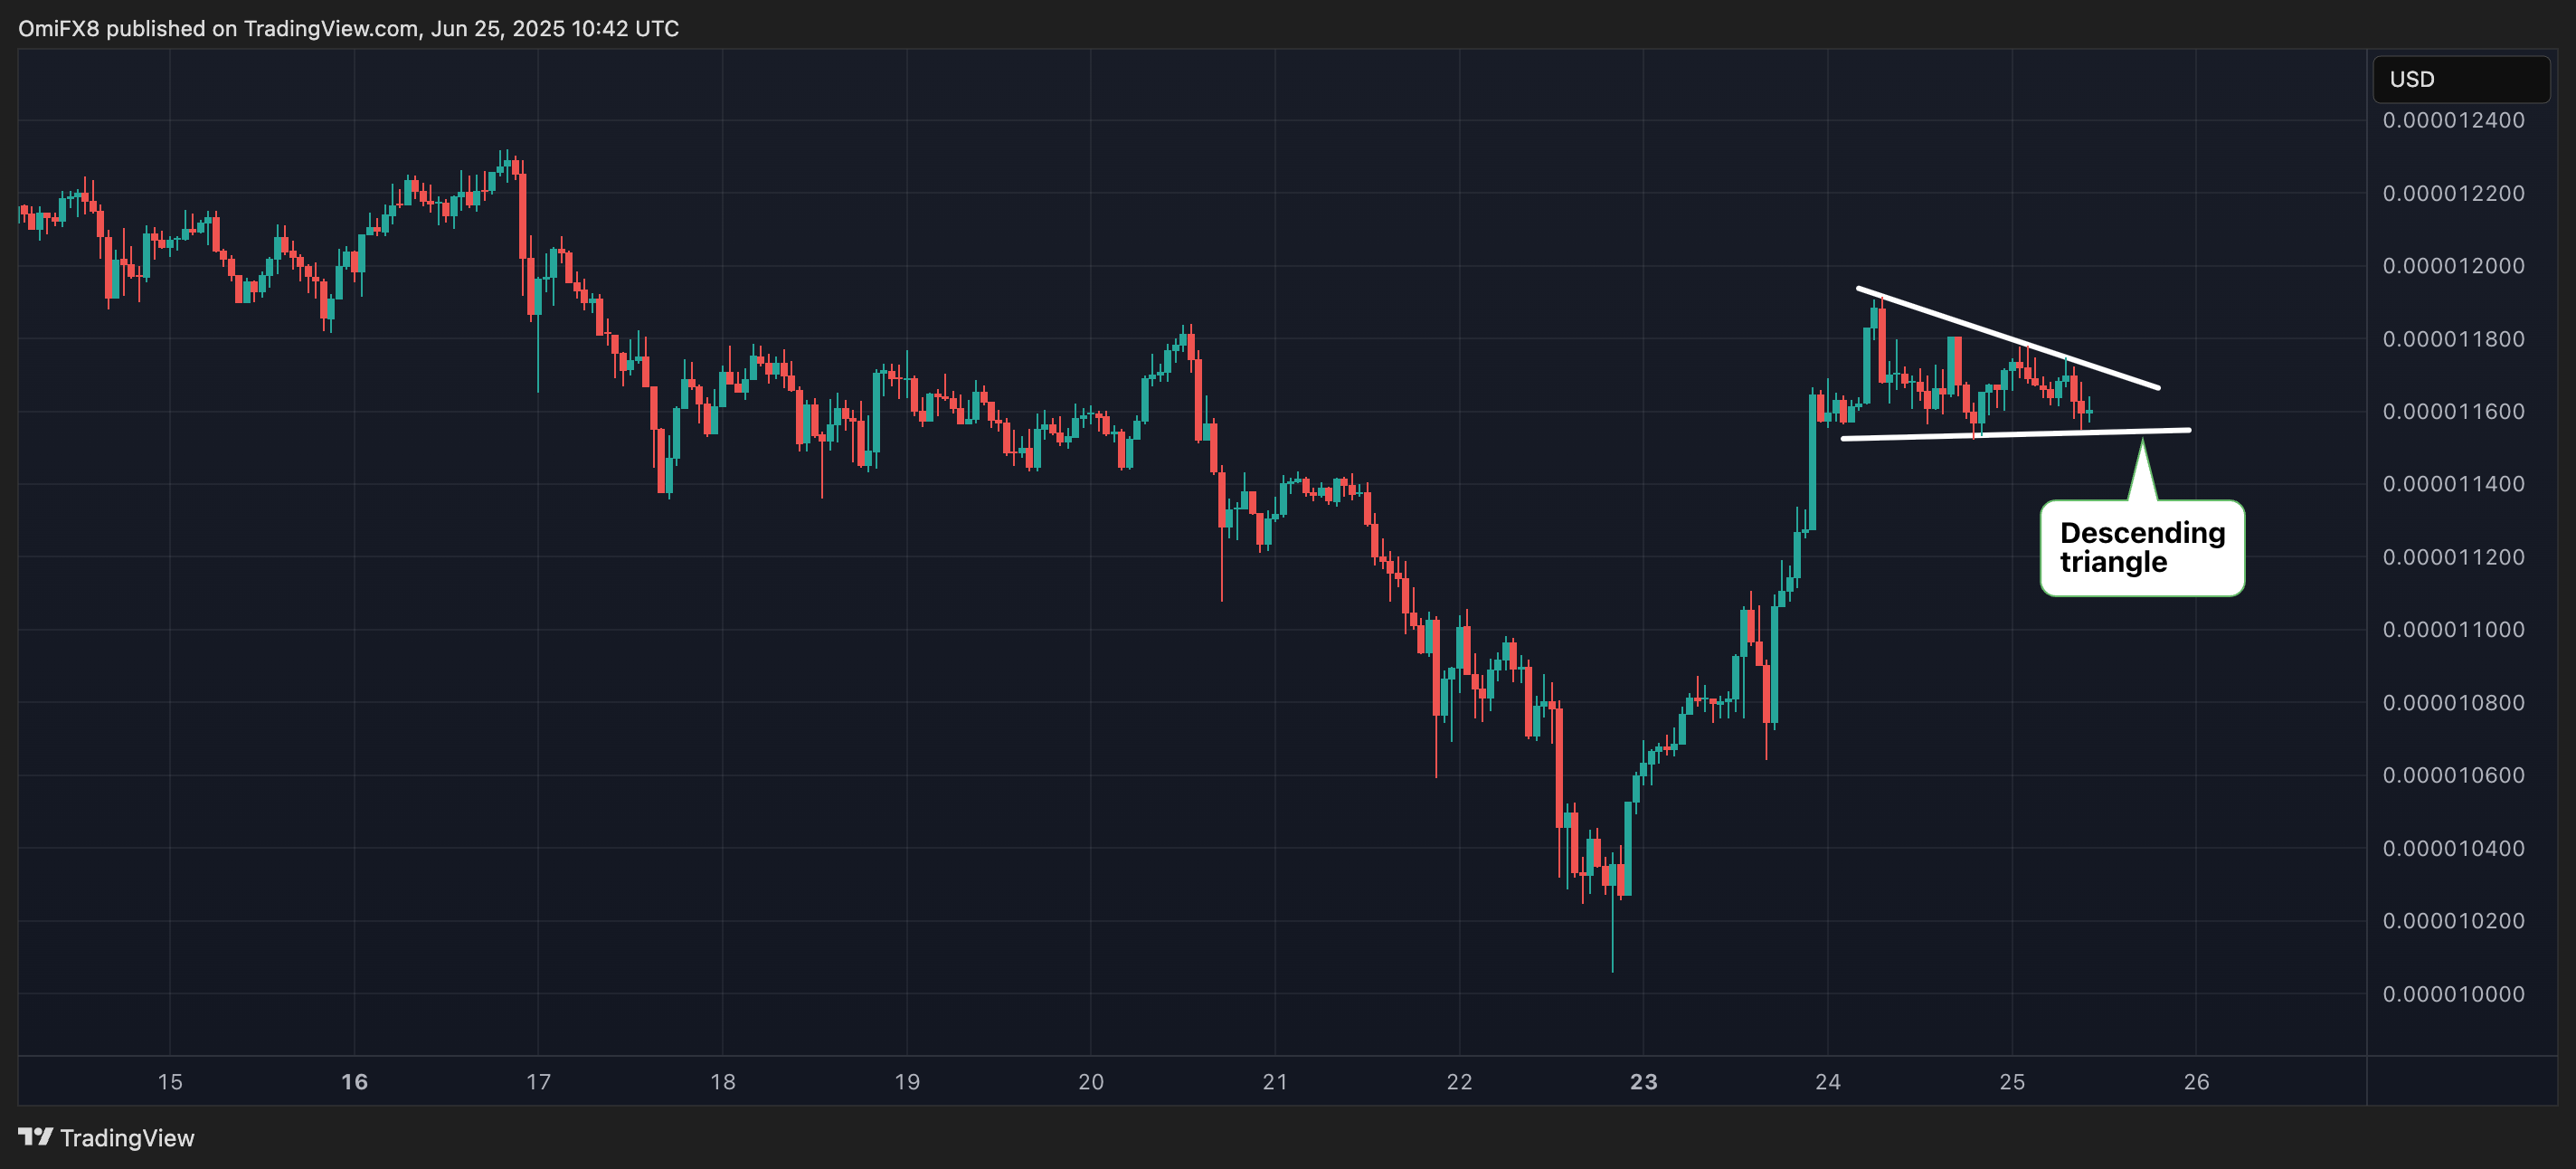
Hourly chart
SHIB's recovery has stalled since Tuesday, with prices trading in what appears to be a descending triangle, characterized by a falling trendline and a horizontal support line.

A price move through the descending trendline would signal a continuation of the recovery rally, exposing the June 16 resistance above $0.00001230. Conversely, a breakdown of the triangle would signal a bearish reversal lower.
免责声明:本文章仅代表作者个人观点,不代表本平台的立场和观点。本文章仅供信息分享,不构成对任何人的任何投资建议。用户与作者之间的任何争议,与本平台无关。如网页中刊载的文章或图片涉及侵权,请提供相关的权利证明和身份证明发送邮件到support@aicoin.com,本平台相关工作人员将会进行核查。


