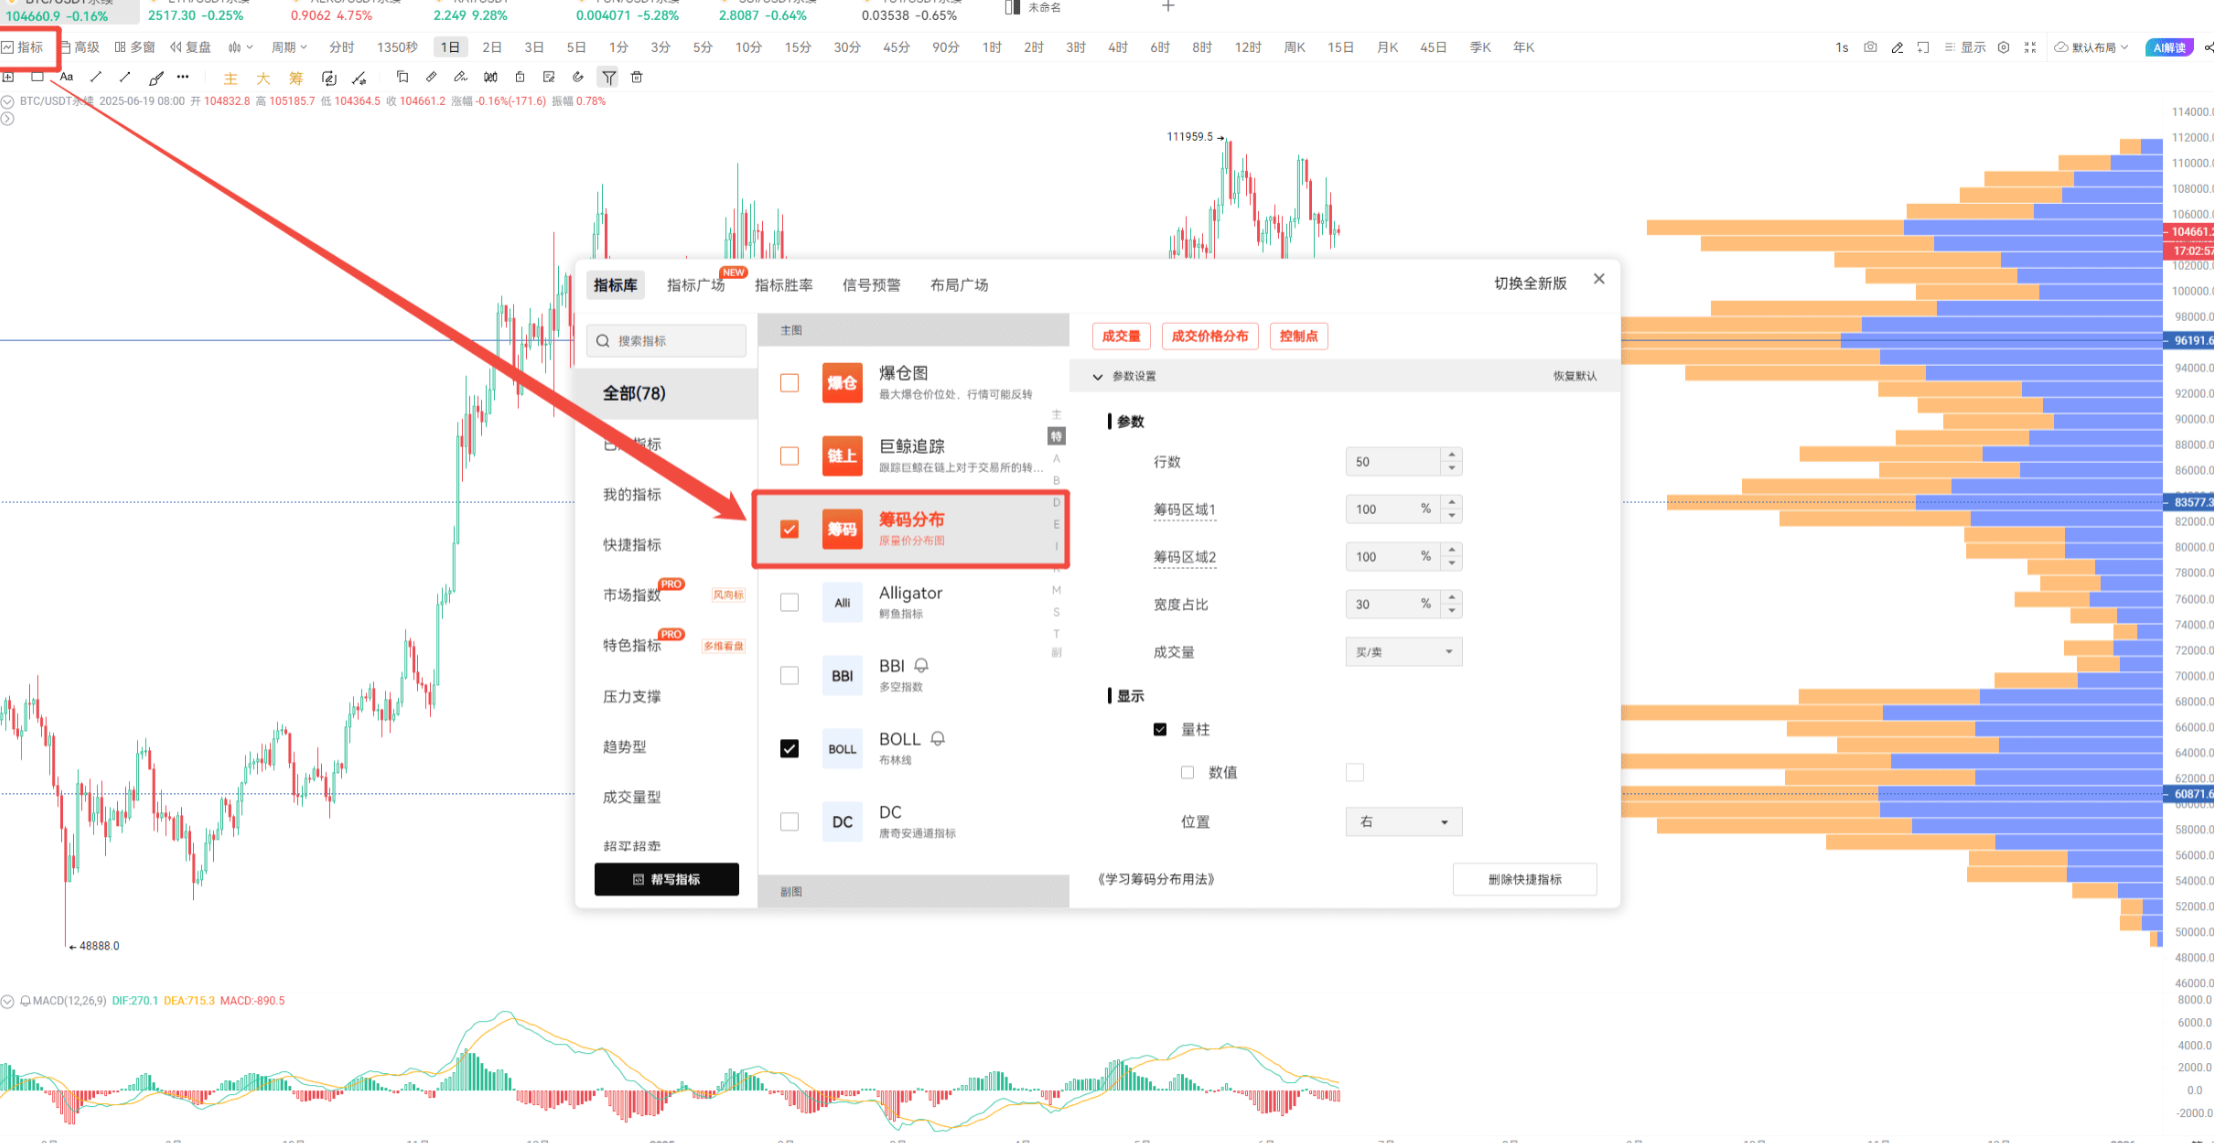
Dear traders, today I want to reveal a trading tool that professional institutions are using—Chip Distribution Chart. This seemingly simple chart is actually an X-ray machine for insights into market sentiment and the movements of major players. Let’s use this tool to see the most authentic competitive landscape of the market.
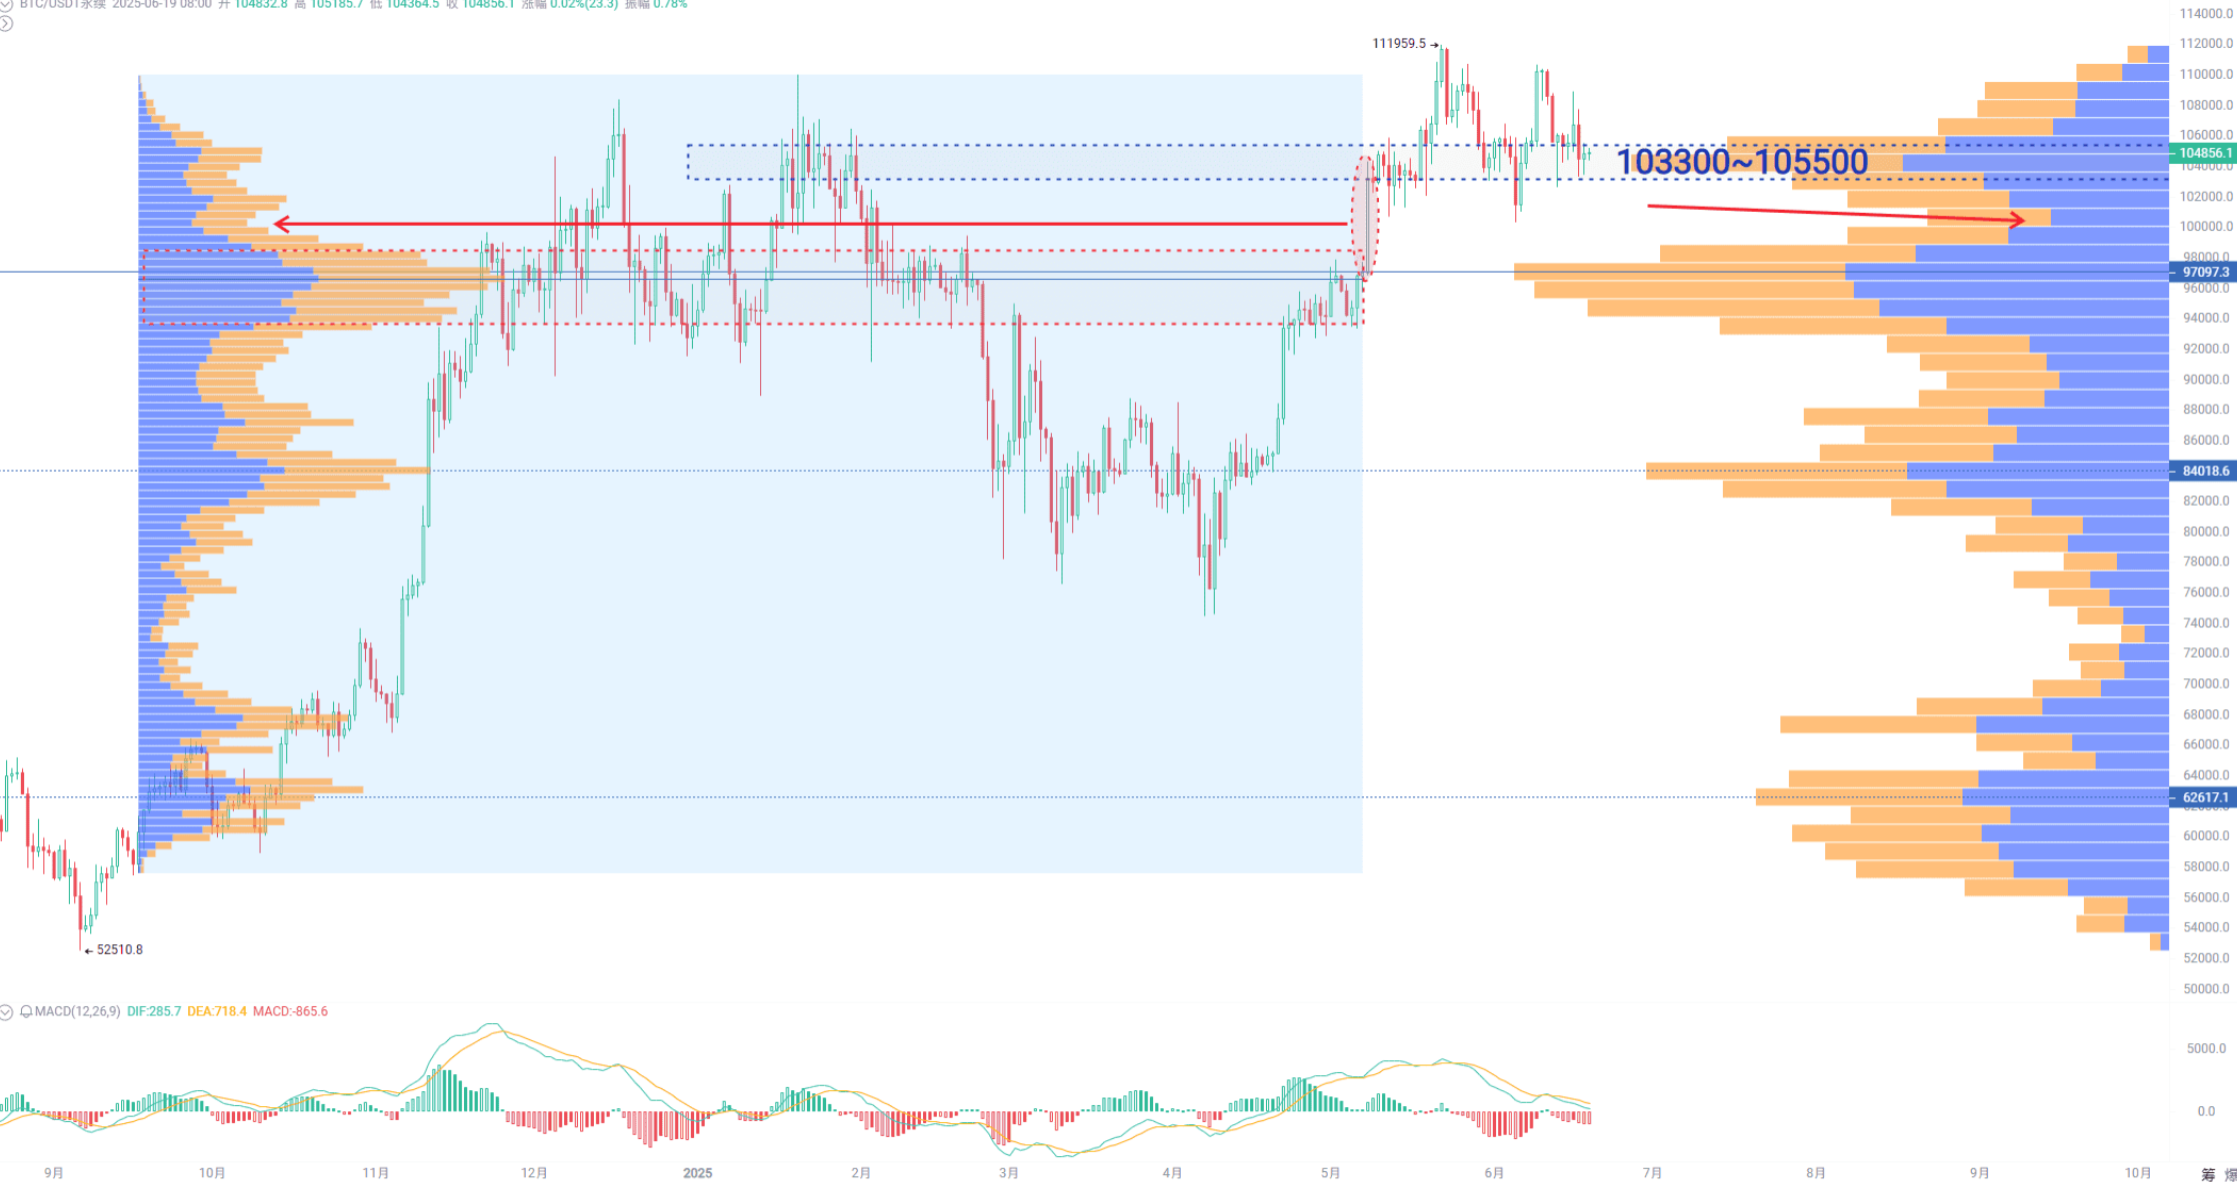
The essence of the Chip Distribution Chart is the perfect integration of historical trading volume and price levels. The horizontal axis represents price, while the density bars on the vertical axis clearly display the trading activity at each price level. The blue bars indicate areas where buyers are actively involved, while the orange marks the battleground of concentrated selling by sellers.
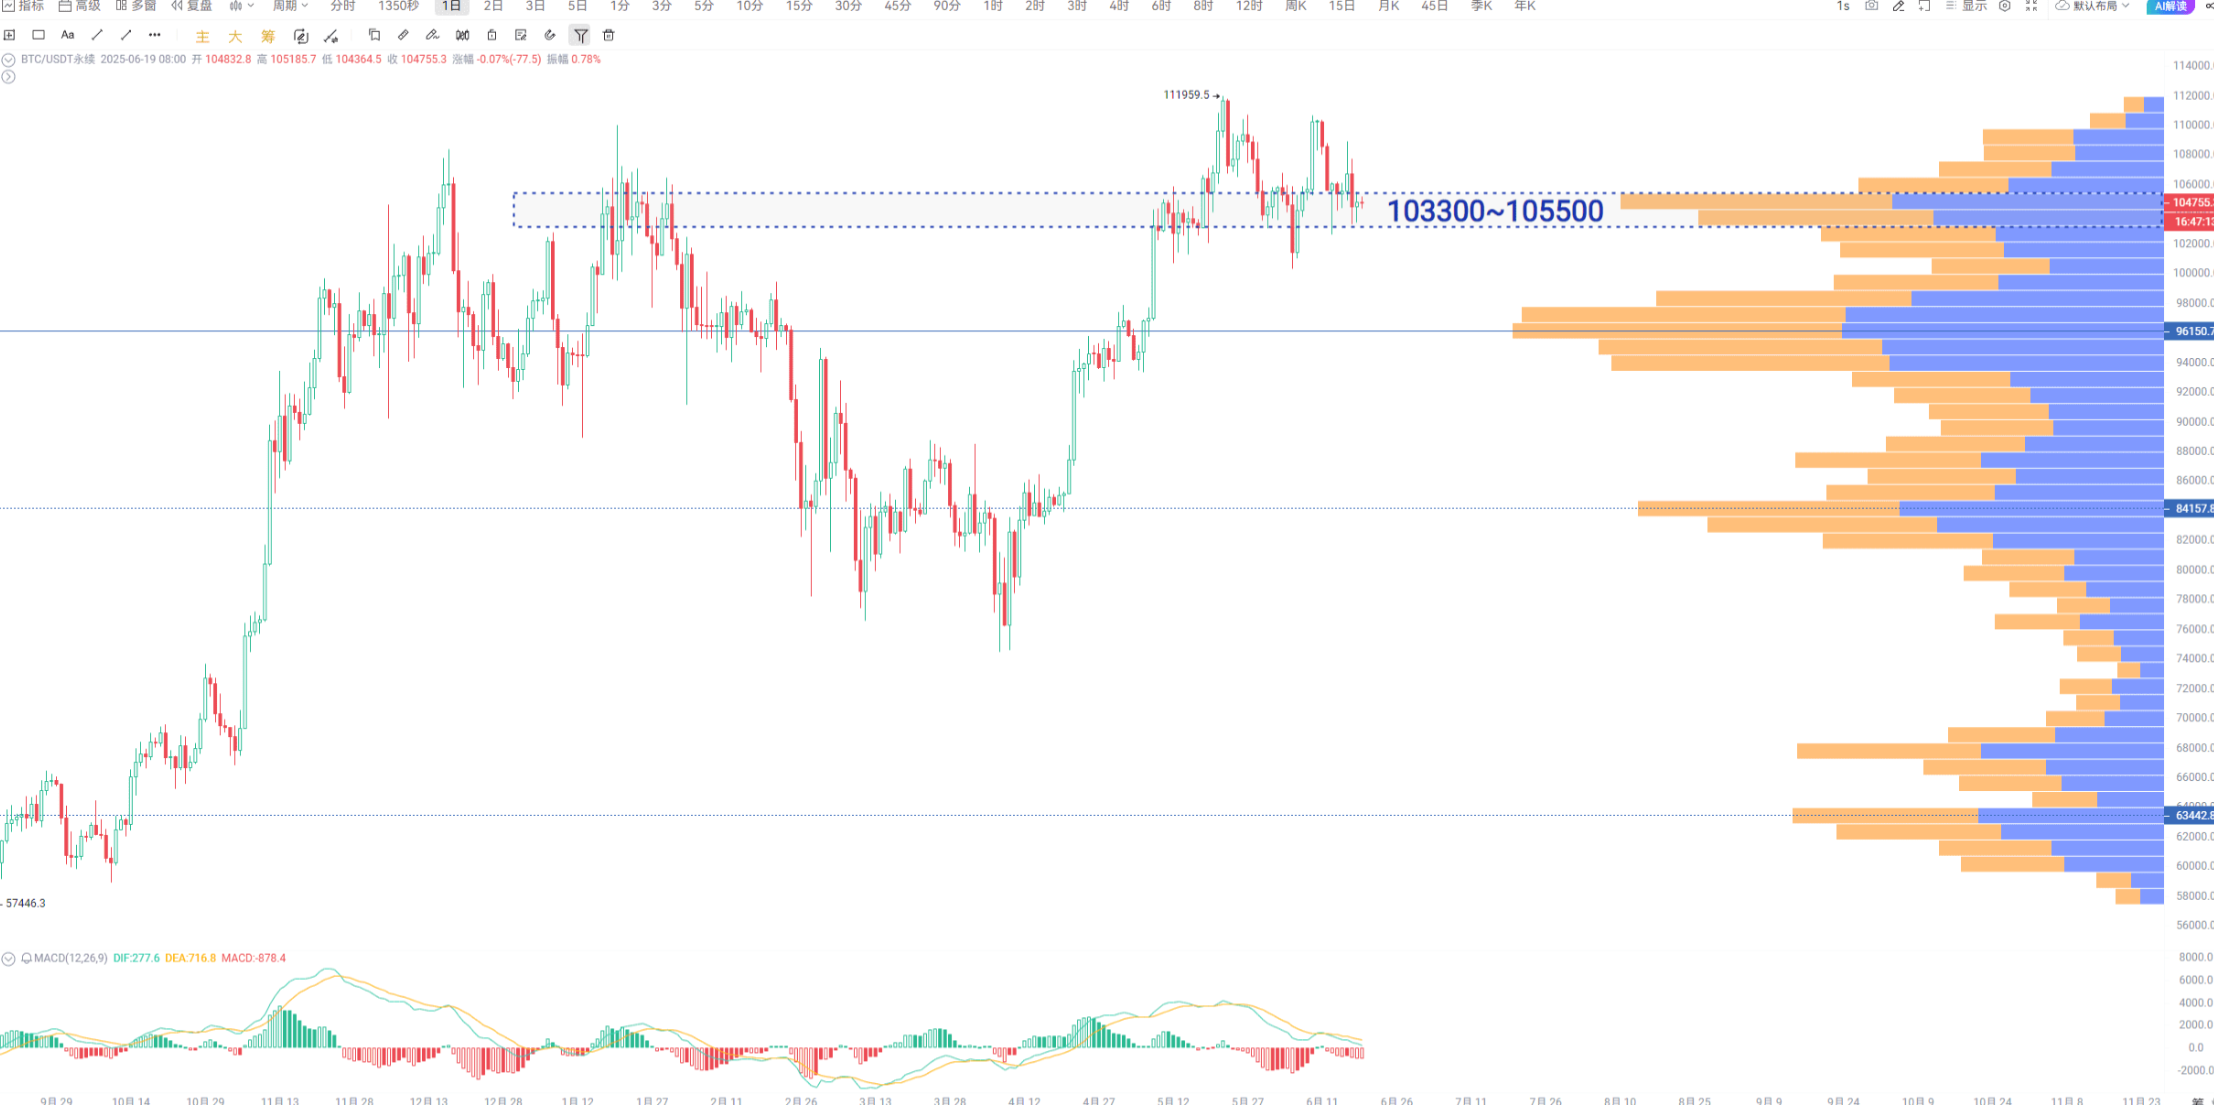
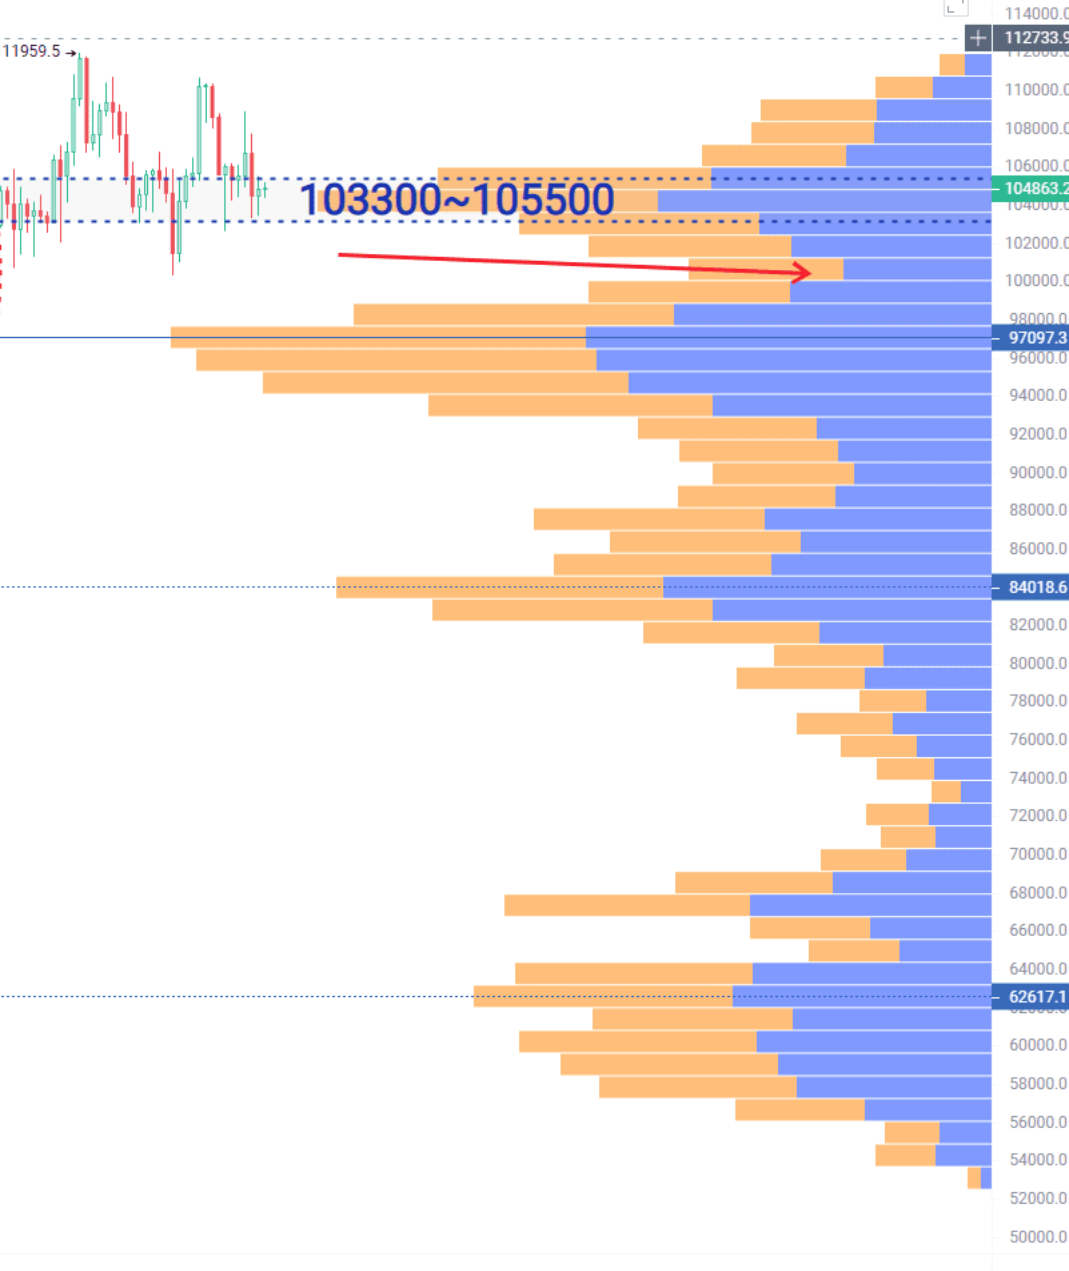
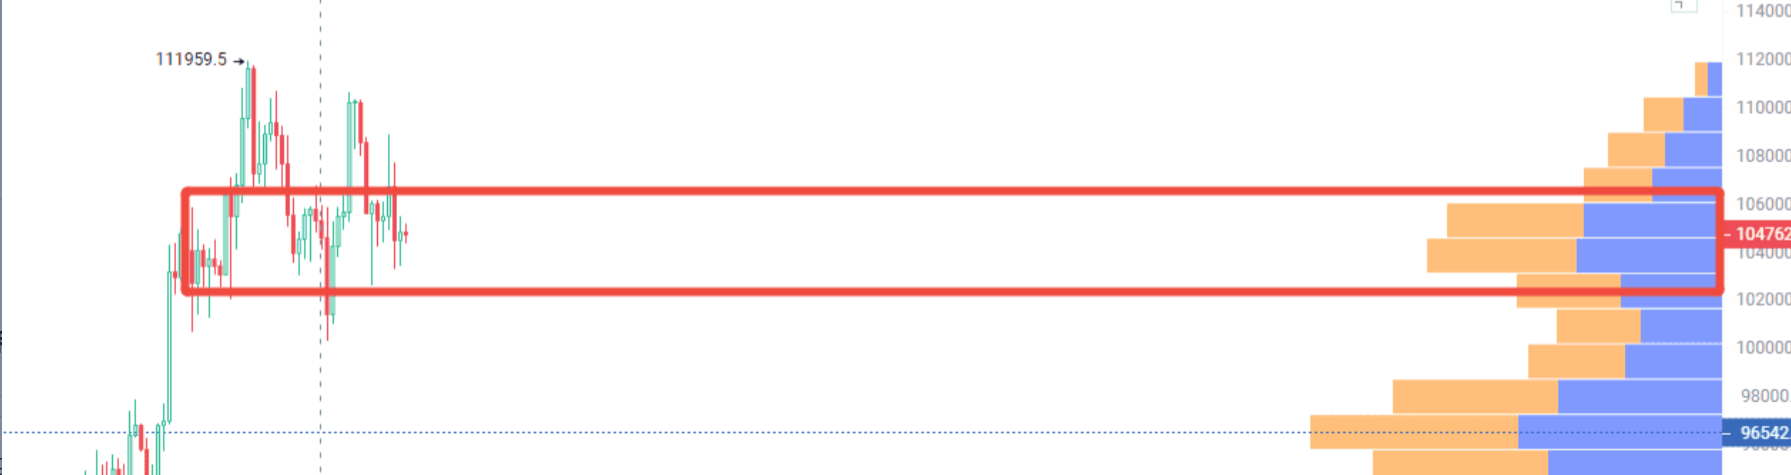
Taking Bitcoin (BTC) on a daily chart as an example, the current market has formed a significant chip concentration area in the range of $103,300 to $105,500. This means that a large volume of trading has occurred in this price range over the past period, resembling a frontline where both sides are heavily fortified. Such areas often have dual attributes: they serve as both support and resistance, and once broken, can trigger accelerated market movements.
Above image: "Major Player Accumulation / Retail Investor Trapped Concentration Area"
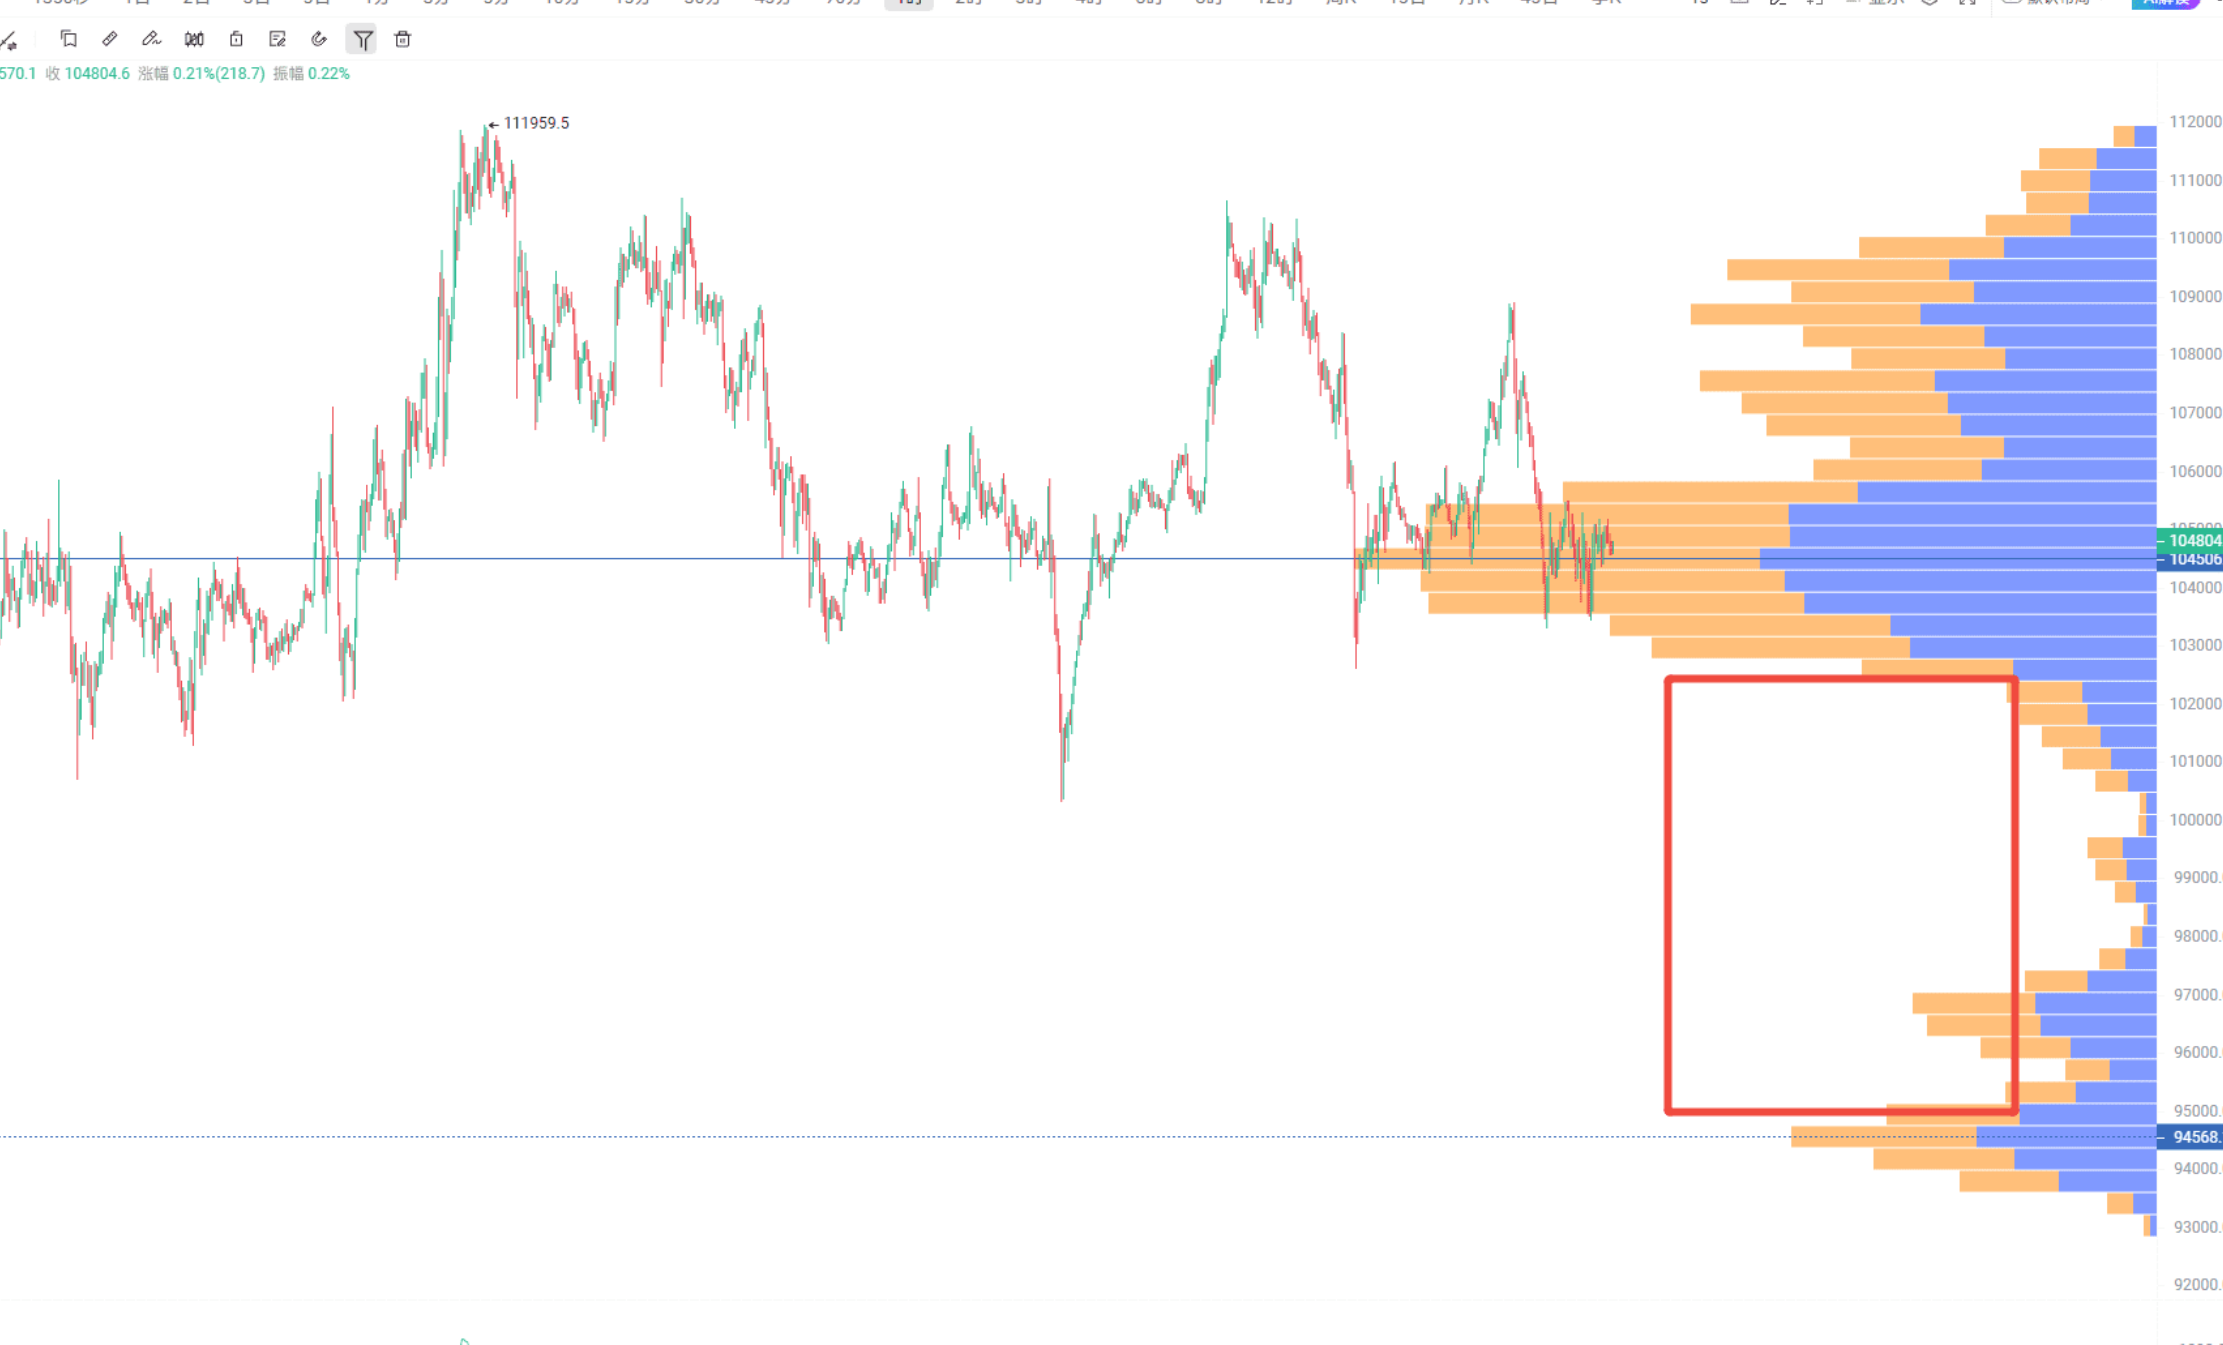
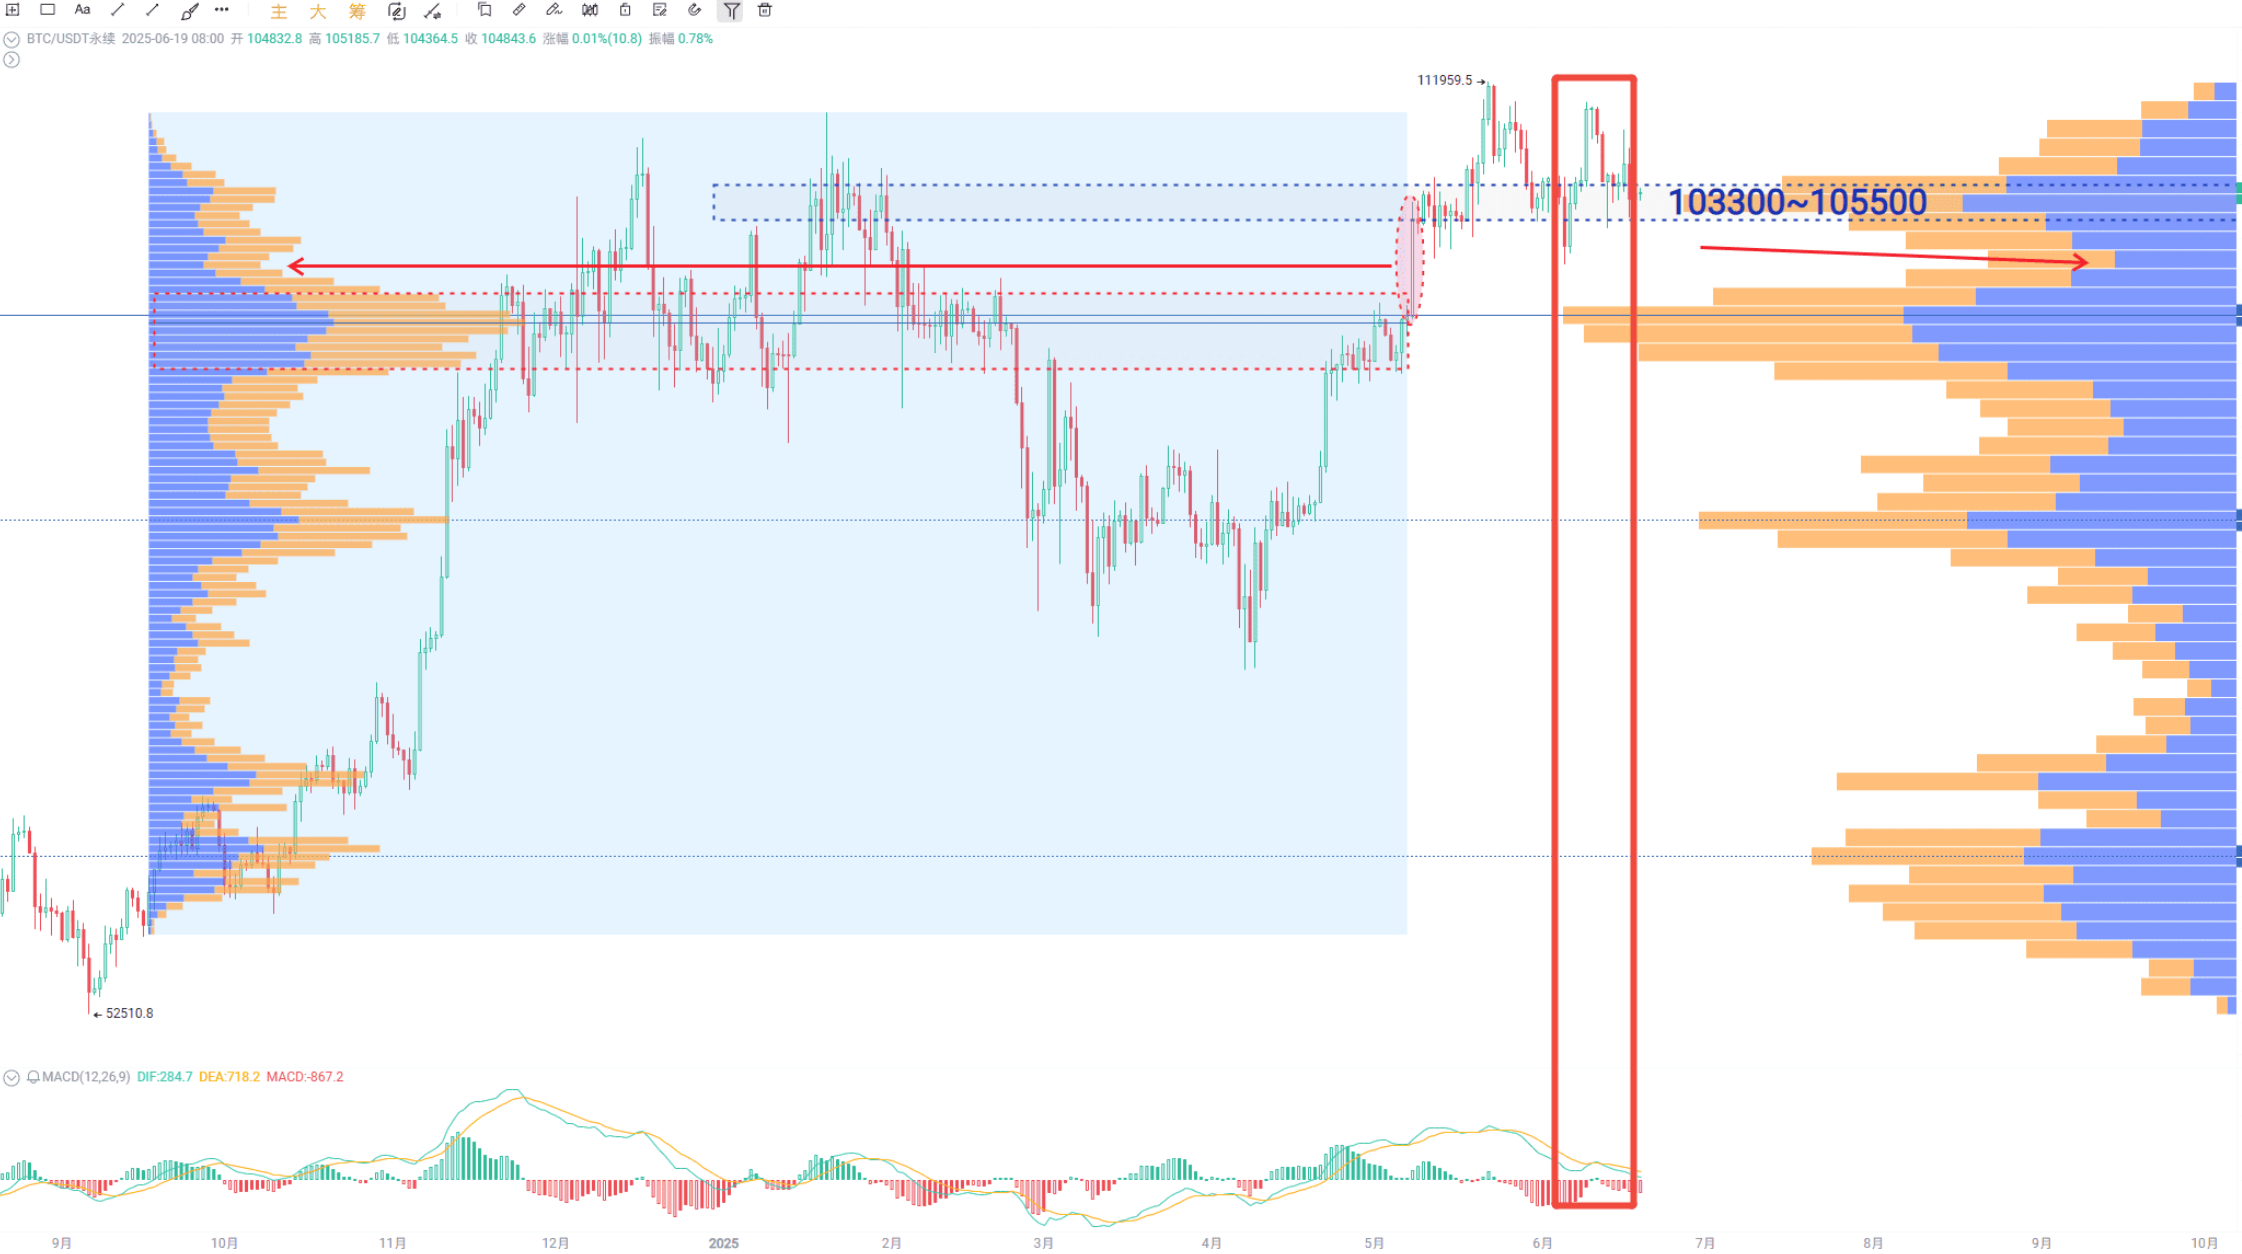
Above image: "Price Vacuum Acceleration Zone"
What’s even more noteworthy is the "vacuum zone" below $103,300.
The sparsity of chips in this area is like a clear stretch of highway, where prices can traverse with almost no resistance. Recalling the significant bullish candle on May 8,
BTC broke through the $100,000 mark thanks to this vacuum environment. However, the current MACD indicator shows a decrease in momentum, reminding us to be cautious of potential pullback risks.
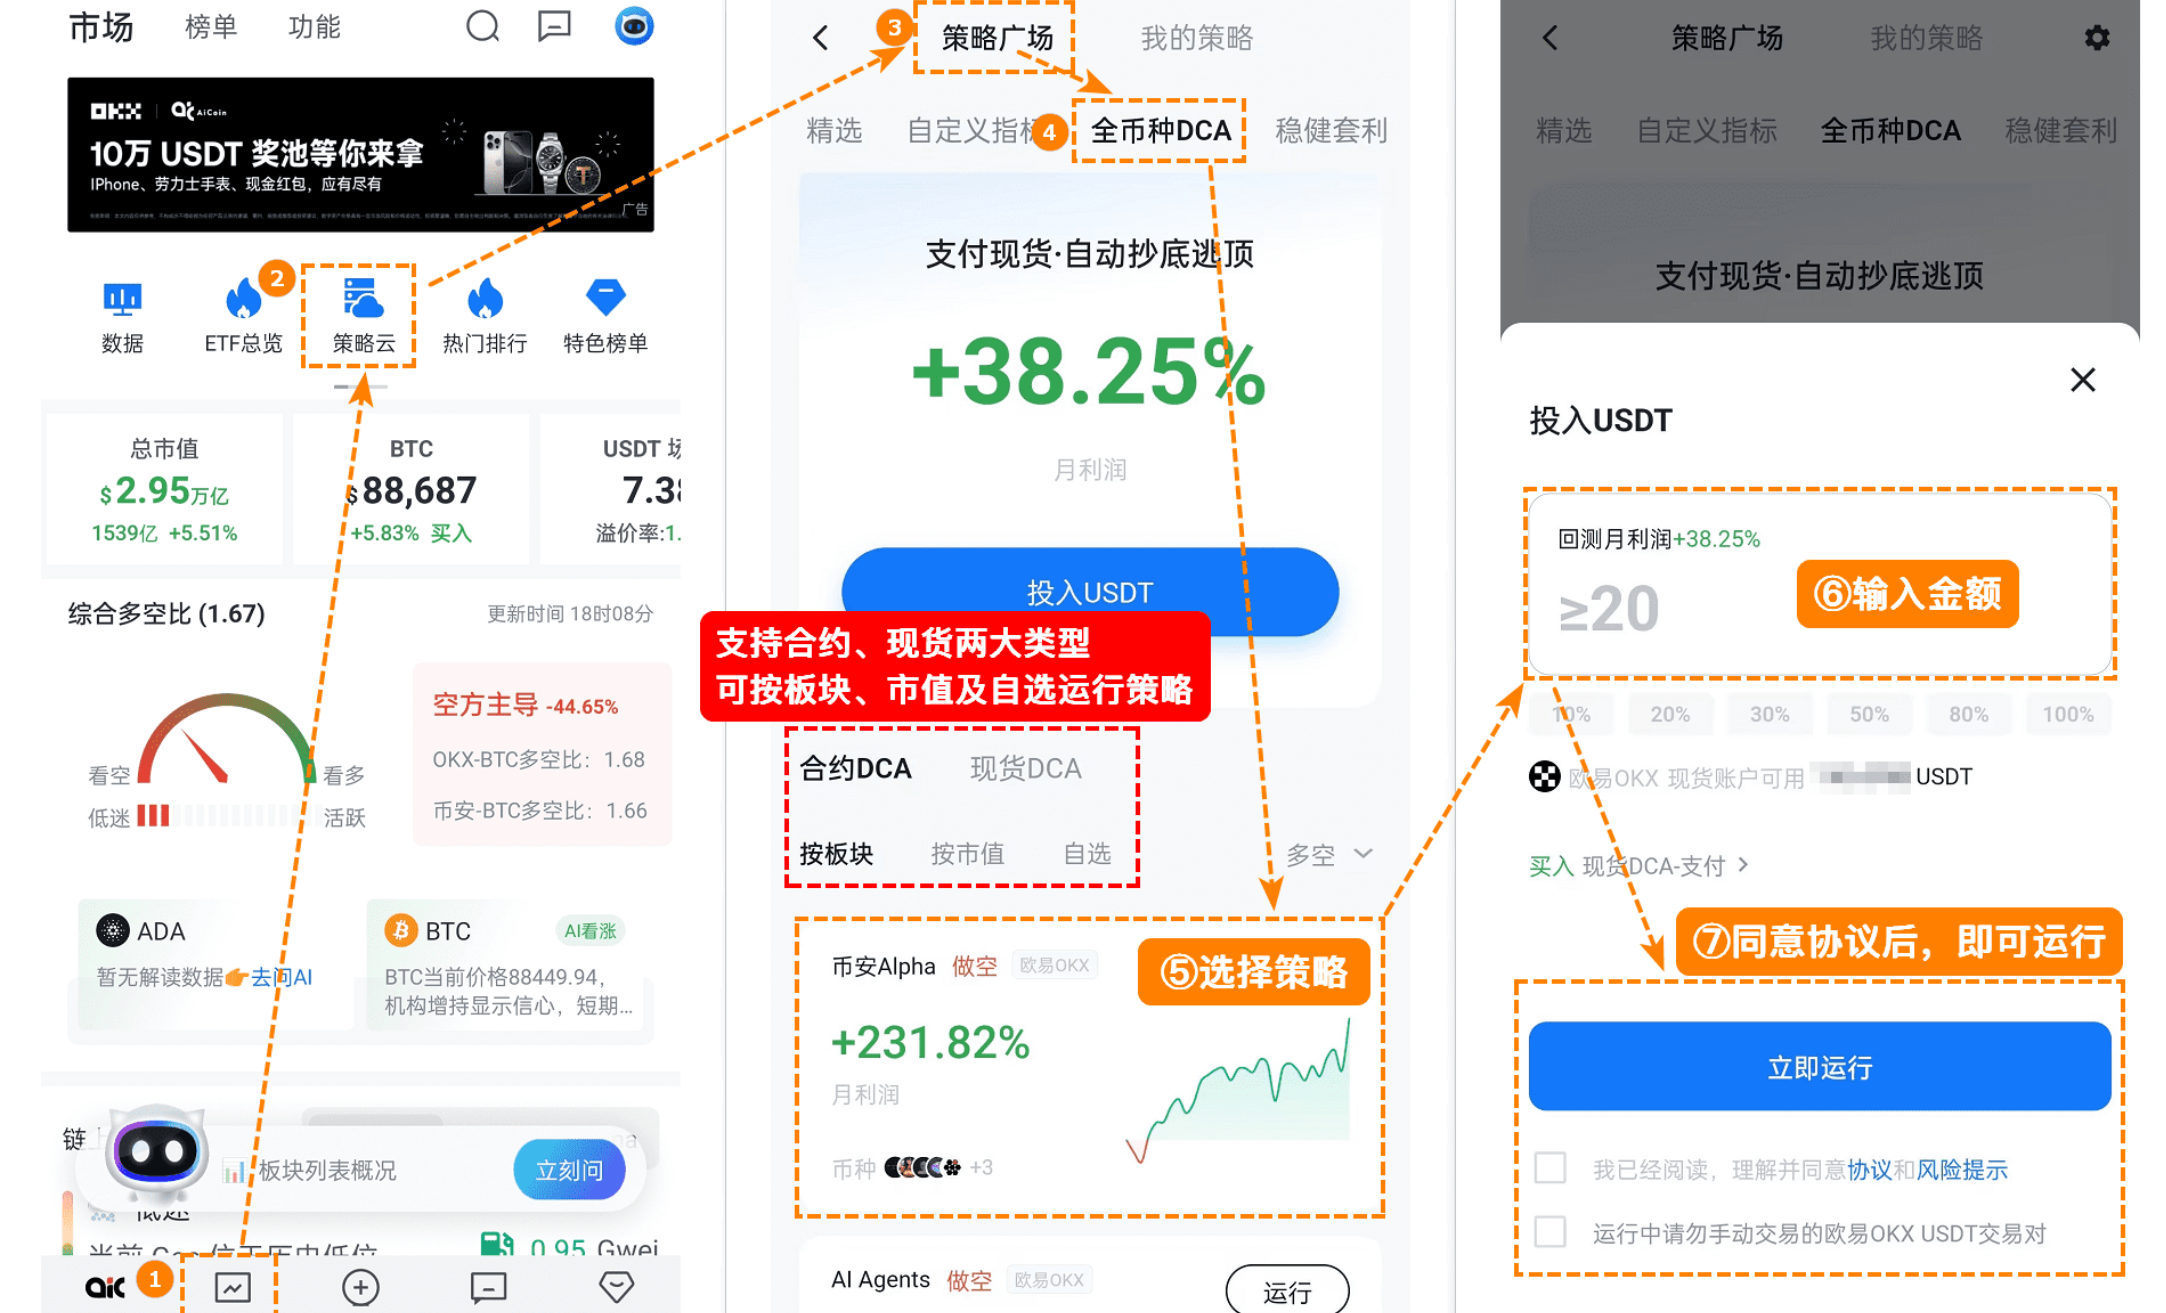
When prices approach key chip areas, smart traders will activate defensive strategies. Our all-coin DCA tool acts like an indefatigable tactical commander, automatically executing a "buy more as it drops" battle plan. Unlike traditional one-time bottom fishing, this strategy automatically increases positions every time the price drops by 1.5%, effectively averaging down the cost of holdings.
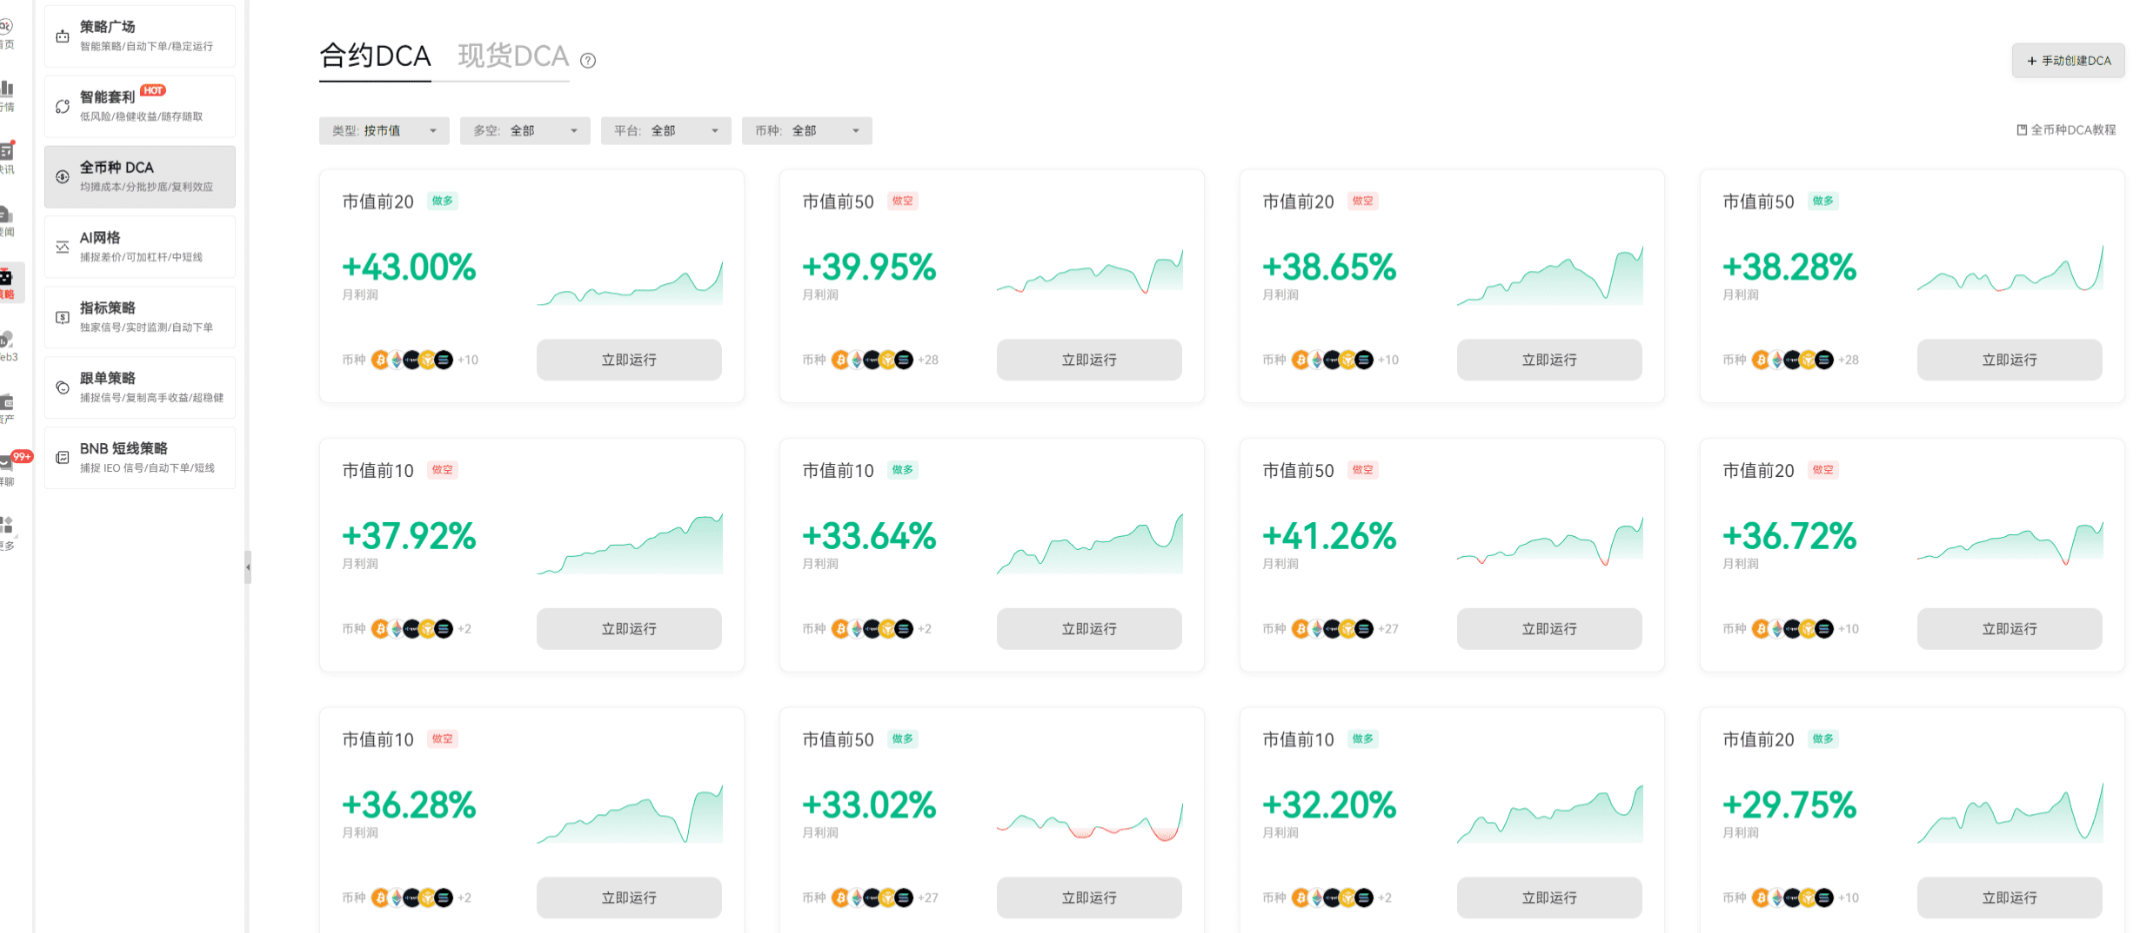
It is particularly worth mentioning that this intelligent system supports various trigger conditions:
Price Trigger: Waiting for the best entry point like a precision-guided missile
RSI/TD Indicator Trigger: Using technical indicators to filter out false signals
Fully Automatic Mode: Suitable for novice users who do not want complicated settings
Now, log in to the AiCoin APP, and you will find this trading tool in the "Strategy Square." Remember, when the price enters the lower chip concentration area, it is the best time to activate DCA. The market always rewards those traders who make good use of tools, and the Chip Distribution Chart is your night vision device to see through the fog of the battlefield.
In this age of information overload, the real trading advantage lies not in knowing more, but in understanding how to interpret the language of the market. Next time you open a candlestick chart, take an extra three seconds to look at the chip distribution—perhaps it is this brief three seconds that can help you avoid traps and seize the next accelerated market movement.
By the way, all the teaching content above will appear in the AiCoin PC live broadcast room every Monday and Thursday. Let’s get started!
免责声明:本文章仅代表作者个人观点,不代表本平台的立场和观点。本文章仅供信息分享,不构成对任何人的任何投资建议。用户与作者之间的任何争议,与本平台无关。如网页中刊载的文章或图片涉及侵权,请提供相关的权利证明和身份证明发送邮件到support@aicoin.com,本平台相关工作人员将会进行核查。


