
The situation in the Middle East has become extremely tense due to the escalating conflict between Israel and Iran. The U.S. continues its hardline policy towards Iran, emphasizing the need to prevent its nuclear program while seeking diplomatic breakthroughs to avoid a full-scale war. The U.S. maintains support for Israel but cautiously avoids direct involvement, with recent diplomatic efforts focusing on strengthening alliances with Gulf countries to counterbalance Iran. However, this policy faces challenges from a divided domestic support base and the unpredictable regional situation. The future trajectory will depend on U.S.-Iran negotiations and the further development of the Israel-Iran conflict.
As a result, the global situation is turbulent, and risk-averse sentiment is rising, which is favorable for Bitcoin and gold. However, short-term volatility is increasing, investment risks are rising, and the geopolitical conflict is unlikely to be resolved quickly, suggesting a longer duration. The entire financial system's response to geopolitical risks has far-reaching implications.
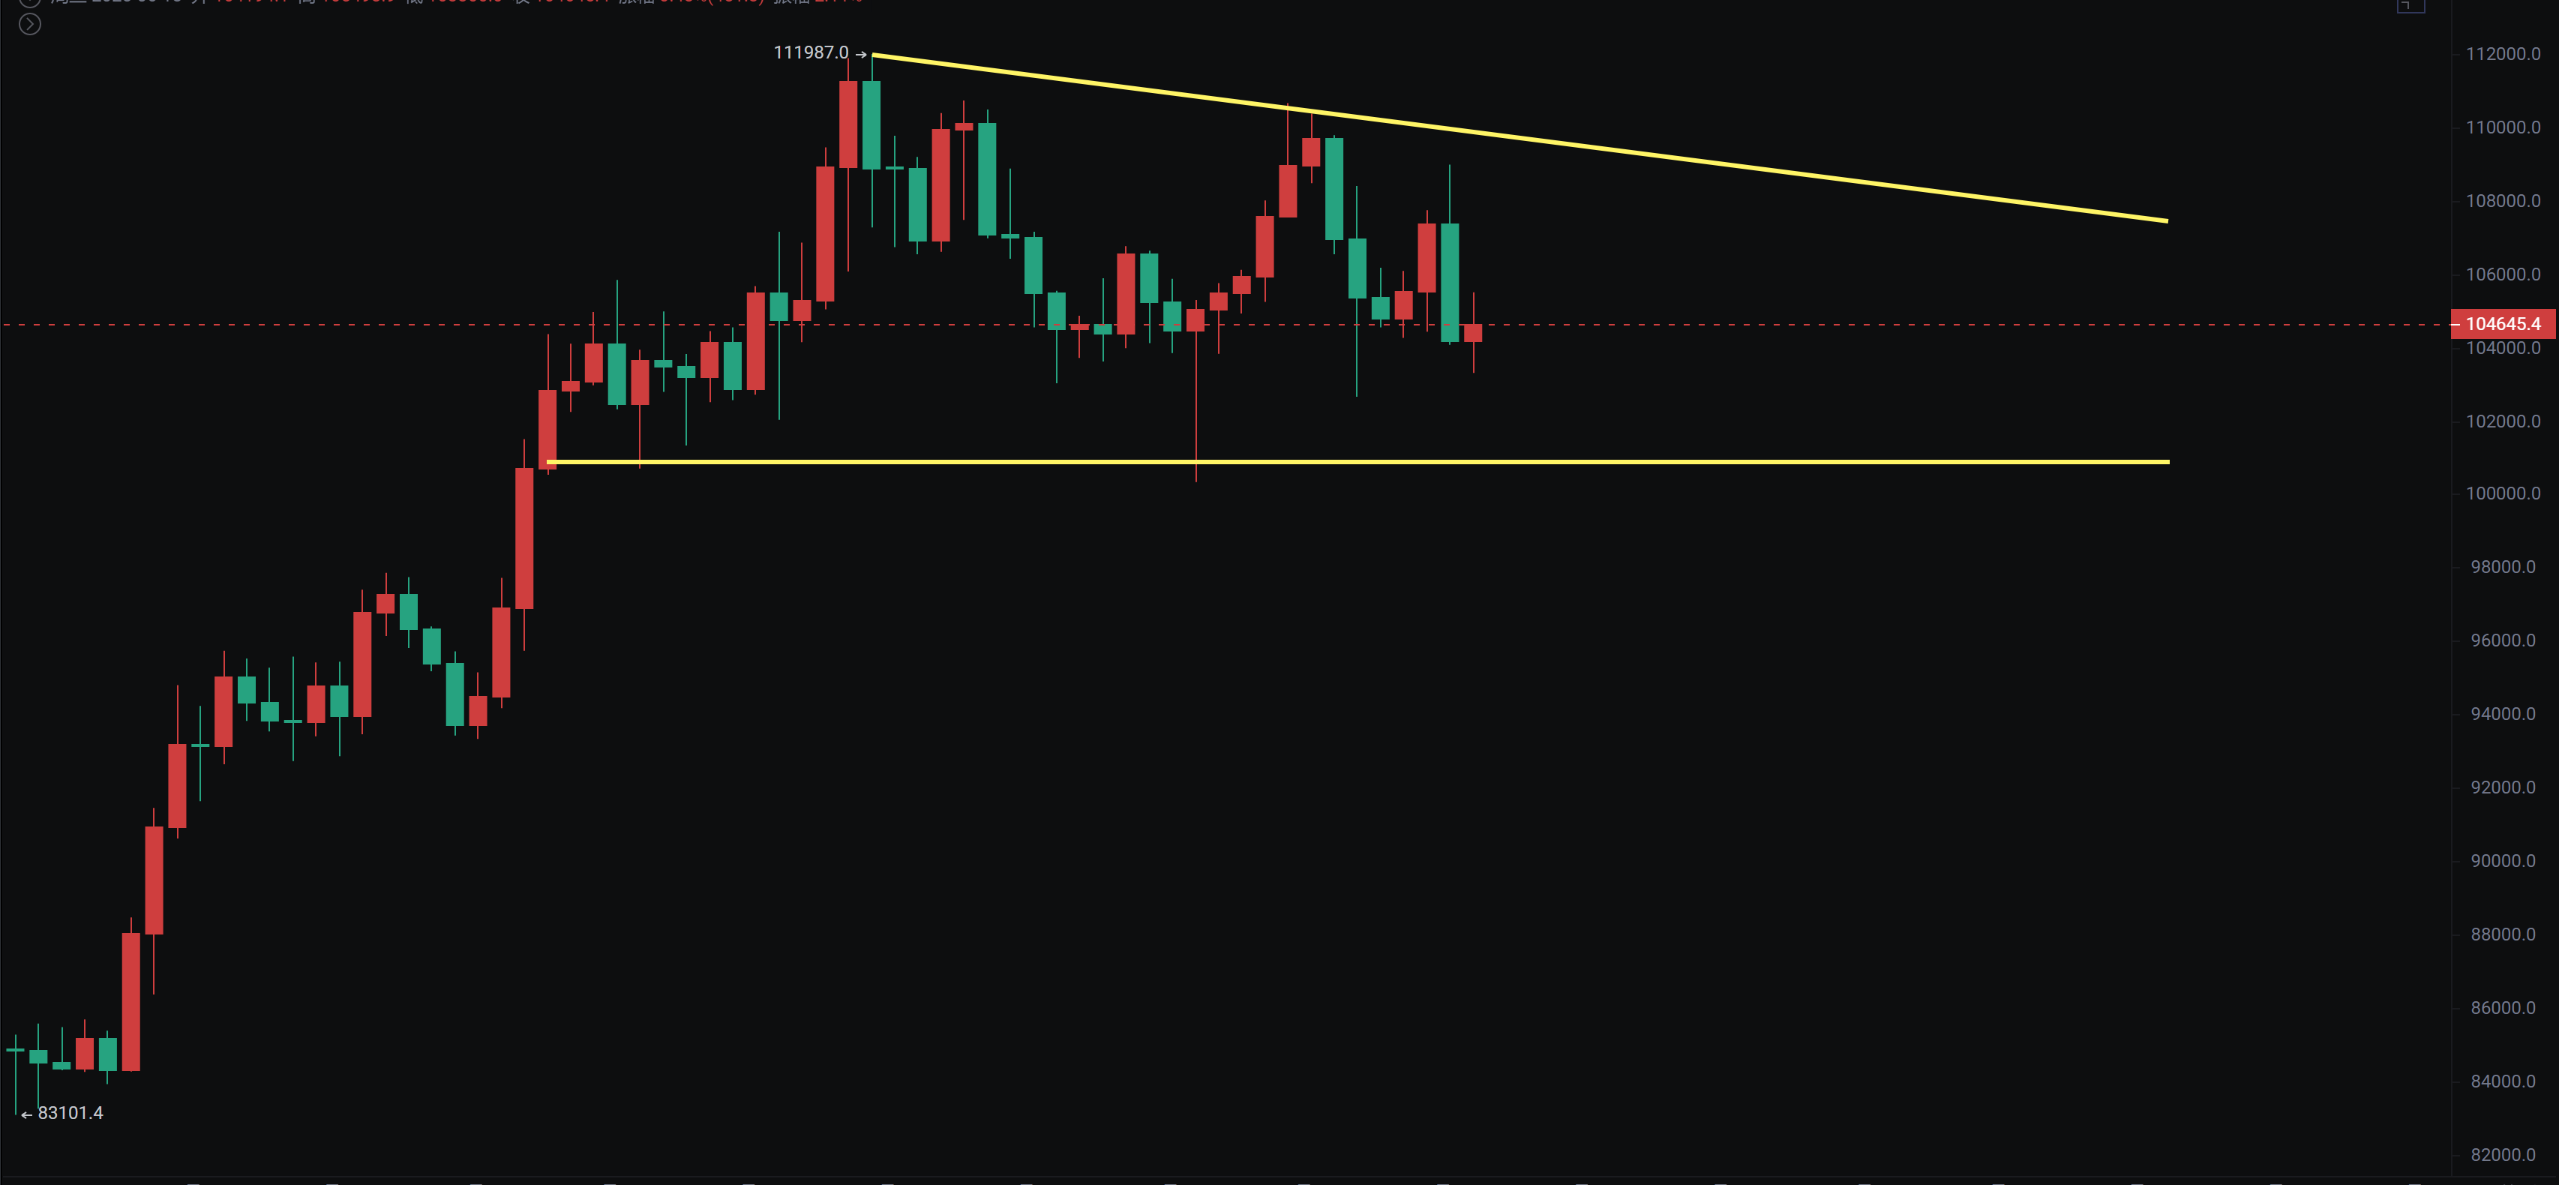
Bitcoin has been oscillating at high levels for nearly a month. Previously, I mentioned that Bitcoin would oscillate for a long time before rapidly rising and then adjusting again, as this has been the trend from 2023 to the present based on weekly charts.
Bitcoin
The daily chart still maintains a converging triangle, and it is currently close to testing support around 100,000. In the short term, the outlook is bearish, but I personally lean towards being bearish without shorting; we are waiting for a better cost-performance ratio to enter in batches.
The daily MACD has not crossed the zero axis, and if the price falls back below 107,000 again, it will be testing the support at 100,000. We can still place orders in batches at 97,000 and 94,000, waiting for value opportunities.
Support: 94,000—97,000—100,000
Resistance: 107,000—110,000—112,000
Ethereum
Ethereum's weekly chart has formed five doji candles. If we see another doji this week, it will be six, indicating a narrow range of oscillation for nearly 40 days. The overall strategy remains unchanged, with 2,800 being a critical dividing line between bulls and bears, and the weekly chart's pattern still suggests a bullish outlook. Therefore, any subsequent pullbacks or spikes will present good entry opportunities.
Support: 2,100—2,200—2,300
Resistance: 2,880—3,300—4,000

If you like my views, please like, comment, and share. Let's navigate through the bull and bear markets together!!!
This article is time-sensitive and for reference only; it is updated in real-time.
Focusing on K-line technical research, we aim to win global investment opportunities. Public account: BTC Trading Master Fu Su

免责声明:本文章仅代表作者个人观点,不代表本平台的立场和观点。本文章仅供信息分享,不构成对任何人的任何投资建议。用户与作者之间的任何争议,与本平台无关。如网页中刊载的文章或图片涉及侵权,请提供相关的权利证明和身份证明发送邮件到support@aicoin.com,本平台相关工作人员将会进行核查。


