
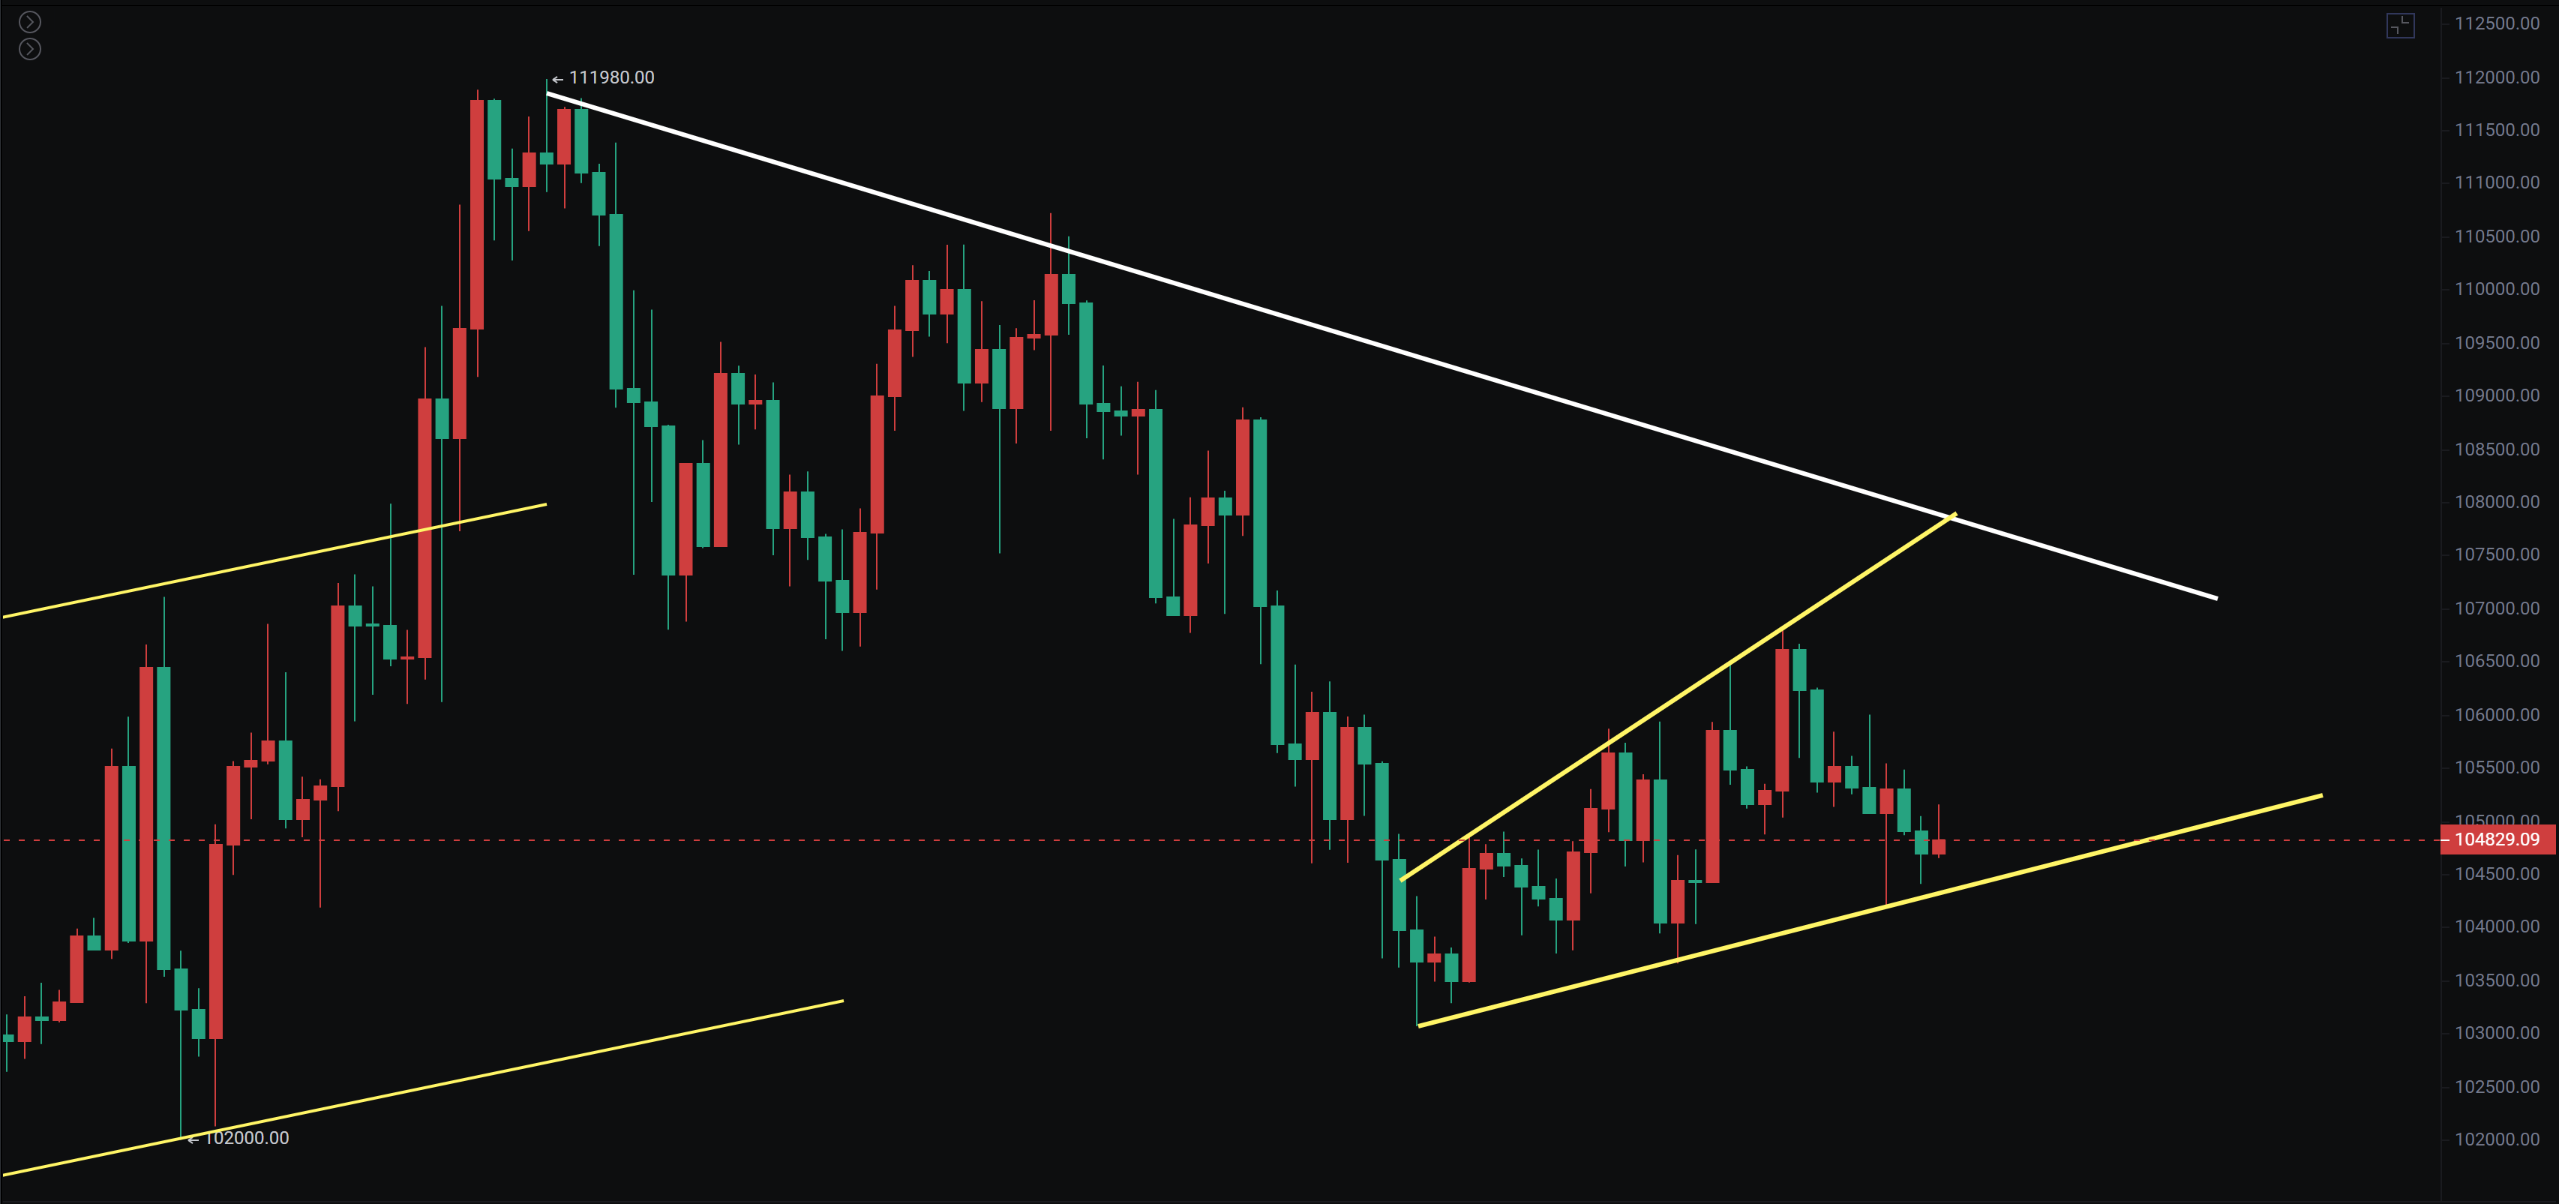
大饼昨天凌晨反弹至107000下方承压回调,公子提醒还是延续上升通道的走势,晚间插针至104200再向上反弹,目前四小时已经走出了喇叭口。

美股目前仍然还是延续向上势头,联动大饼也是回调较弱,所以美股这一波反弹会不会也是延续谐波形态1.13再回调,公子认为是不排除的就和大饼一样,所以对于当下的走势扑朔迷离不确定的因素较大。
当你以为经济衰退时所有资产都会暴跌,但真相是华尔街正在疯狂抄底原油。一边是摩根大通警告衰退概率飙升至60%,油价跌破60美元,创四年新低。另一边是高盛、黑石等巨头暗中囤积石油期货,净多头头寸暴增300%。这背后是一场认知差的暴力游戏,有空细说。
大饼
4小时走出喇叭口形态,美谷最近波动不大但还是上升势头,这也是大饼下跌表现的也是比较弱势,日线反弹BOLL中轨承压,公子一直相信时间空间和势能,这里还差一个下跌3浪。
支撑:96000—98000—103000
压力:107000—110000—112000
以太
日线短线还是维持震荡,日线BOLL缩口也是面临变盘,建议还是短线高抛低吸先撸短线,周线连续十字星也是走出抛砖引玉形态看涨信号。
支撑:2100—2200—2300
压力:2800—3300—4100
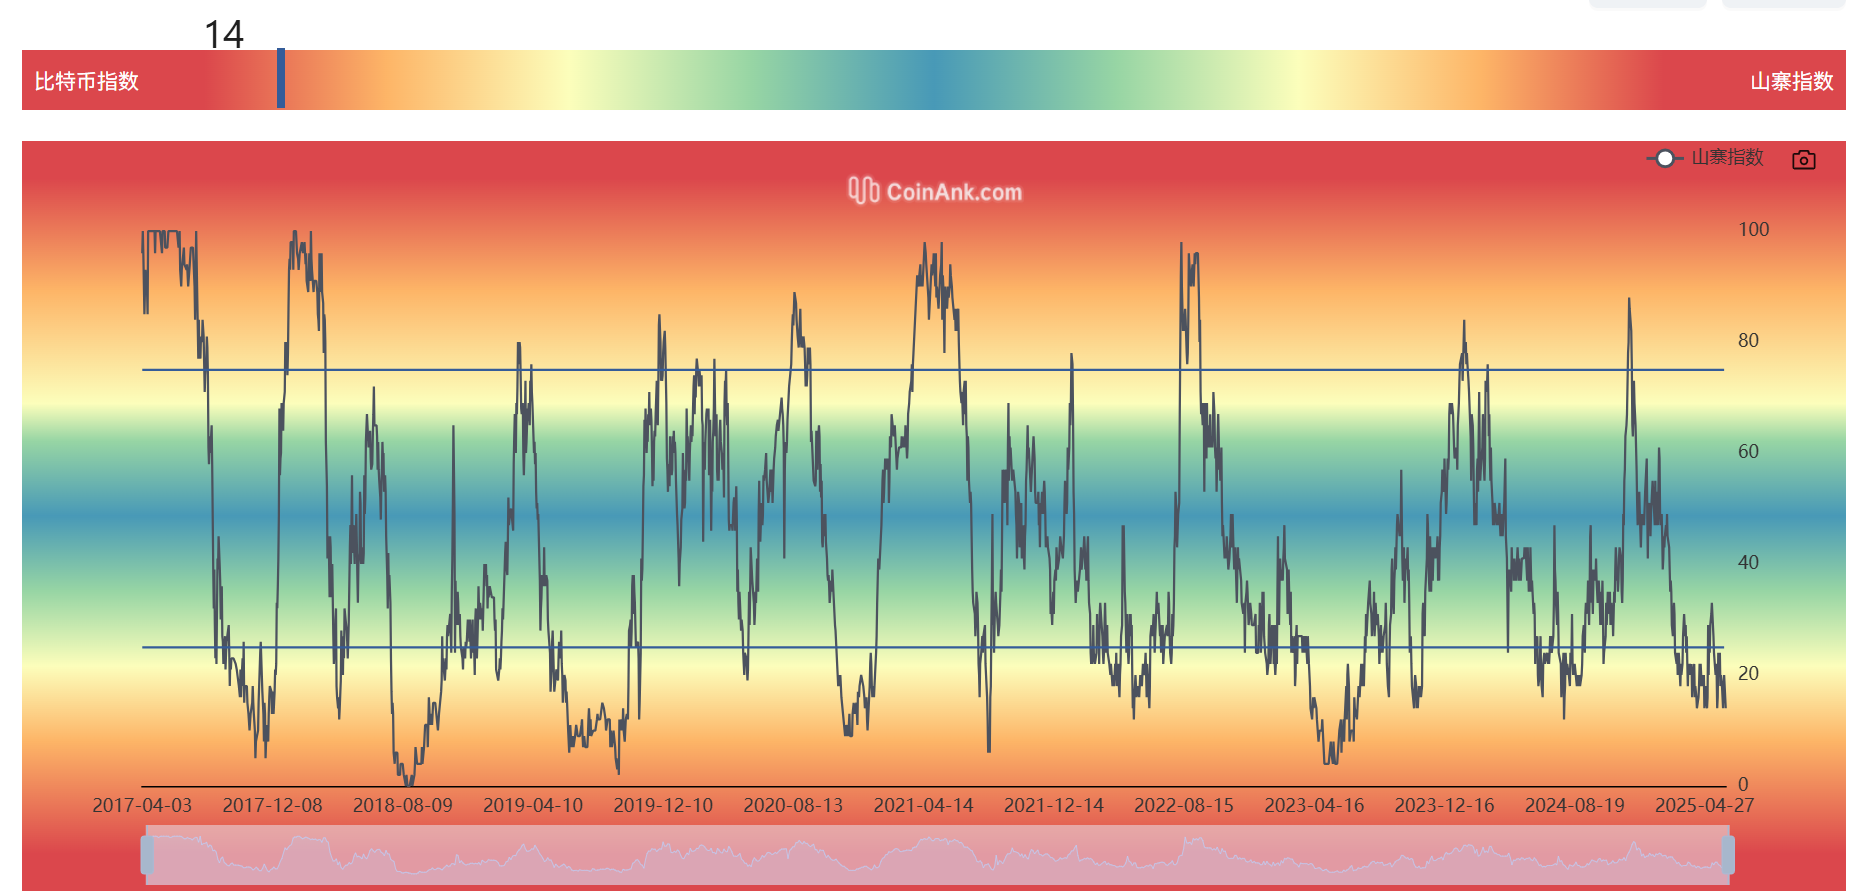
山寨季指标14又是跌到最近低点附近,SOL、SUI、STX、DOGE……等等已经跌至公子说的第一目标位,鉴于大饼目前仍未出底山寨等第二目标位附近靠近第一次分批接。
如果你喜欢我的观点,请点赞评论分享,我们一起穿越牛熊!!!
文章具有时效性,仅供参考实时更新
专注k线技术研究,共赢全球投资机会公众号:BTC交易公子扶苏

免责声明:本文章仅代表作者个人观点,不代表本平台的立场和观点。本文章仅供信息分享,不构成对任何人的任何投资建议。用户与作者之间的任何争议,与本平台无关。如网页中刊载的文章或图片涉及侵权,请提供相关的权利证明和身份证明发送邮件到support@aicoin.com,本平台相关工作人员将会进行核查。


