Cryptocurrency News
June 16 Highlights:
1. Trump recently vetoed the plan to assassinate Iran's supreme leader.
2. Michael Saylor has released Tracker information again, which may disclose BTC accumulation details next week.
3. Data: AguilaTrades opened a long position in BTC and plans to increase it to $262 million.
4. The military parade event on June 14 was sponsored by tech giants including cryptocurrency exchange Coinbase.
5. Vietnam's legislation recognizes crypto assets, with the Digital Technology Industry Law set to take effect in 2026.
Trading Insights
After years in the cryptocurrency space, I've summarized how to judge the movements of major players, making it easy for beginners to understand! In the ever-changing cryptocurrency market, recognizing the signals from major players is key to profitability! Master these four core patterns to easily identify market traps and seize trading opportunities!
Rapid Rise + Slow Decline — Major Player Accumulation Signal When a cryptocurrency experiences a short-term surge followed by a slow decline, it indicates that major players are quietly accumulating! They create short-term price increases to attract attention, then slowly decline to wash out retail investors. If trading volume increases simultaneously, pay close attention and wait for the right moment to act.
Rapid Decline + Slow Recovery — Major Player Selling Warning If the price of a cryptocurrency plummets sharply and then slowly rebounds, it is likely that major players are selling off. They create panic through rapid declines, and as retail investors sell, they slowly buy back their positions. If this pattern appears, it is advisable to take profits or cut losses promptly to avoid subsequent risks.
Volume at the Top — Escape the Peak Survival Rule ① Huge Volume at the Top: A massive trading volume at the peak indicates intense competition between bulls and bears. While there may be a chance for a second peak, the risk is very high, so it is recommended to reduce positions in batches. ② Divergence in Volume and Price: A sudden drop in trading volume at the top indicates that upward momentum is waning. At this point, decisively liquidate positions to avoid being trapped at high levels.
Emotional Codes Behind Trading Volume The rise and fall of cryptocurrency prices are essentially a battle of market emotions, and trading volume is a direct reflection of that emotion: ① Volume and Price Rise Together: Market sentiment is high, with bulls in control. ② Volume Shrinks While Price Falls: Market sentiment is pessimistic, with heavy wait-and-see emotions. ③ Divergence in Volume and Price: Be cautious of trend reversals and adjust strategies in a timely manner.
LIFE IS LIKE
A JOURNEY ▲
Below are the actual trades from the Big White Community's group this week. Congratulations to those who followed along; if your trades are not going well, you can come and test the waters.
The data is real, and each trade has a screenshot from when it was issued.
**Search for the public account: *Big White Talks About Coins*
BTC
Analysis
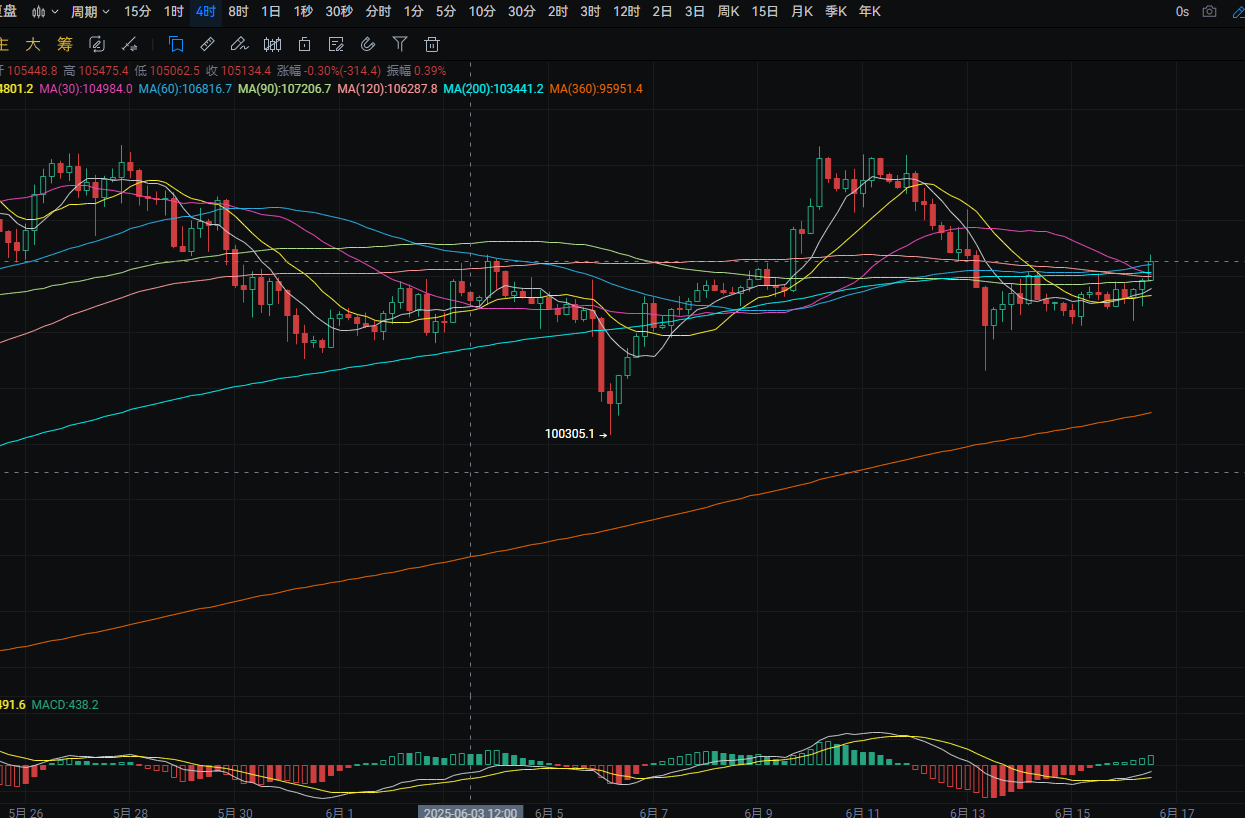
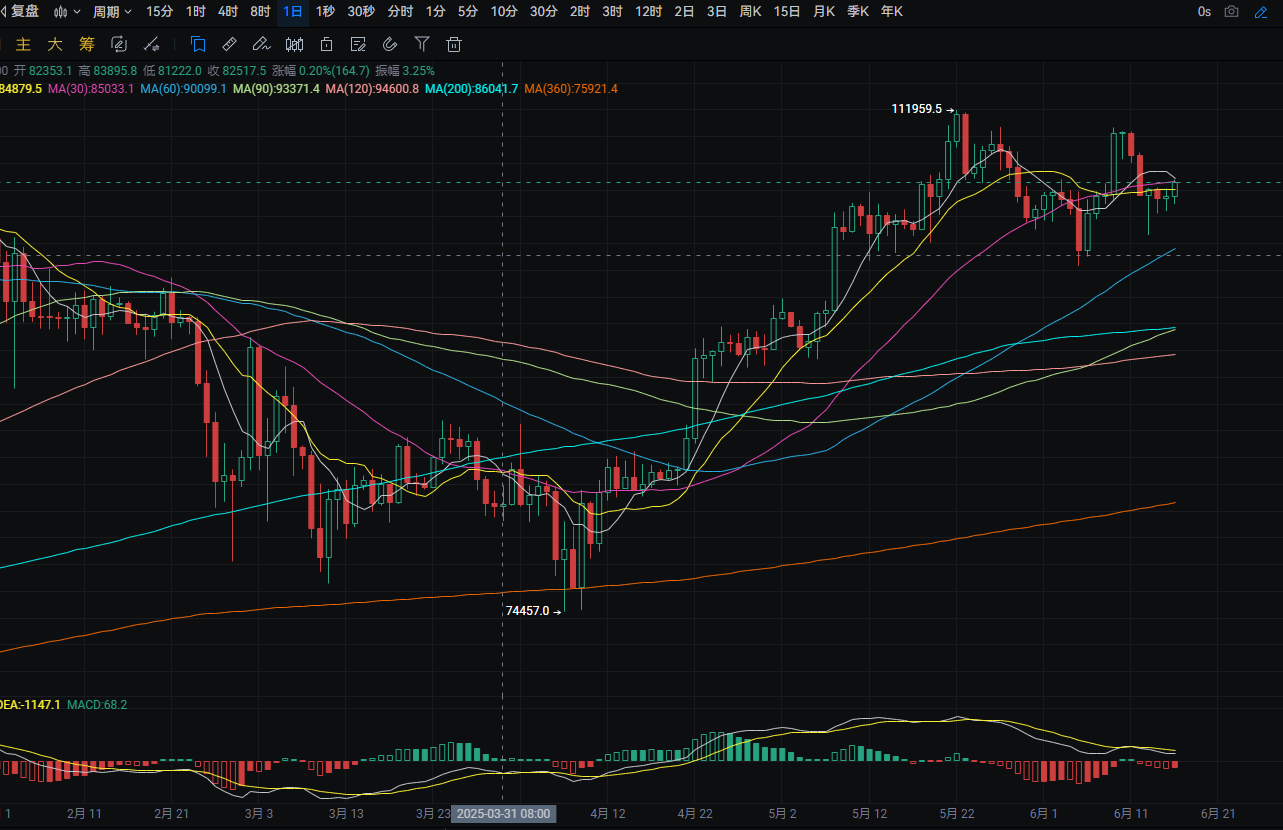
Bitcoin's daily line rose from a low of around 104,400 to a high of around 106,100 yesterday, closing around 105,550. The support level is around 104,950; if it breaks, it could drop to around 103,650. A pullback can be used to buy near this level. The resistance level is around 107,150; if it breaks, it could rise to around 109,250. A rebound to this level can be used to sell short. MACD shows increasing bearish momentum. The four-hour support level is near the MA7 moving average; if it breaks, it could drop to around 104,650. A pullback can be used to buy near this level. MACD shows increasing bullish momentum, forming a golden cross.
ETH
Analysis
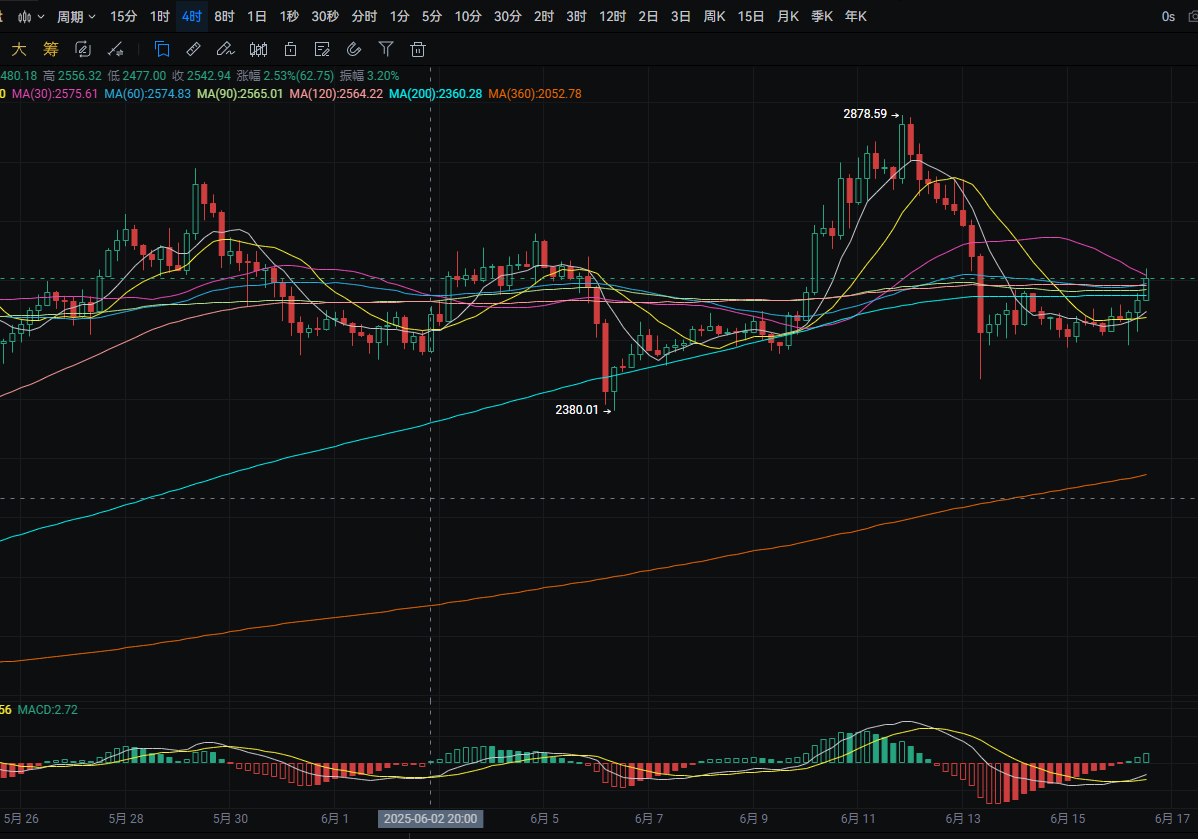
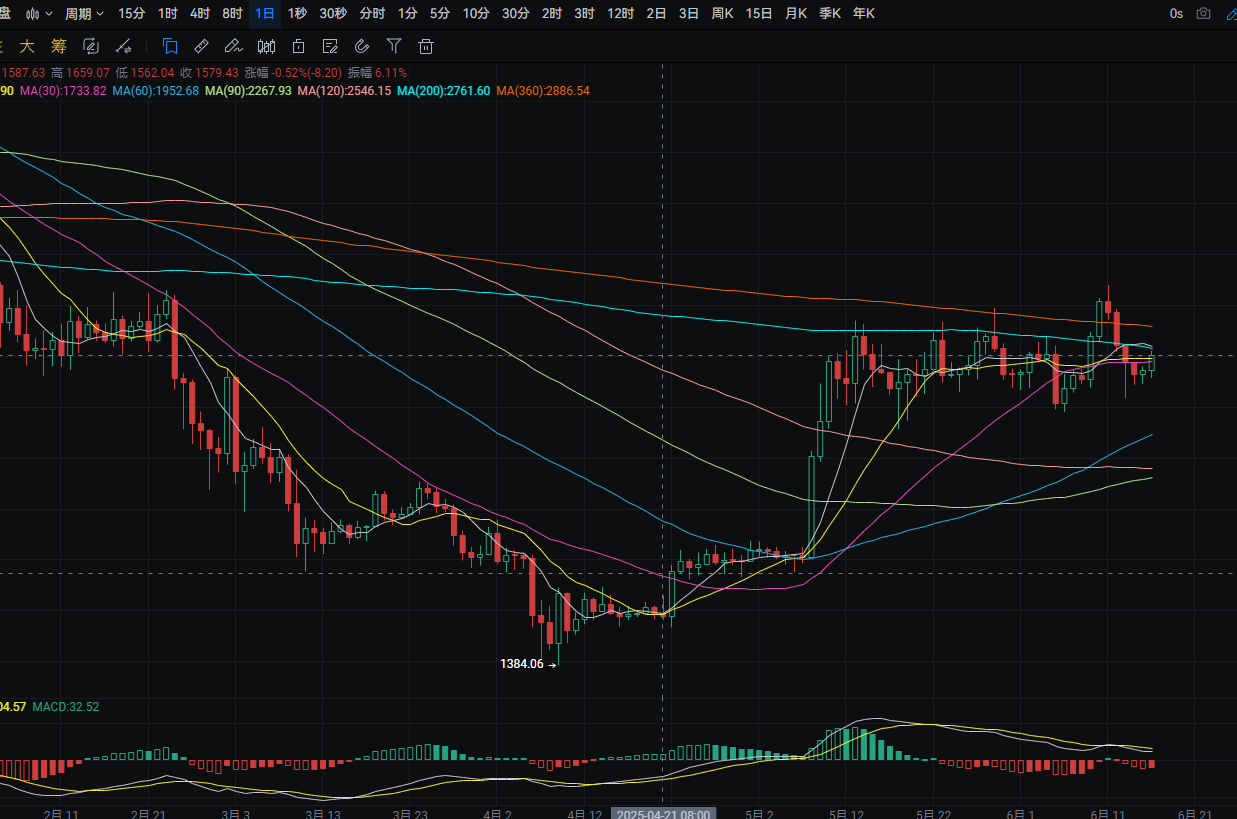
Ethereum's daily line rose from a low of around 2,490 to a high of around 2,560 yesterday, closing around 2,545. The support level is around 2,505; if it breaks, it could drop to around 2,450. A pullback can be used to buy near this level. The resistance level is around the MA200; if it breaks, it could rise to around MA360. A rebound to this level can be used to sell short. MACD shows increasing bearish momentum. The four-hour support level is near the MA7 moving average; if it breaks, it could drop to around 2,510. A pullback can be used to buy near this level. MACD shows increasing bullish momentum, forming a golden cross.
Disclaimer: The above content is personal opinion and for reference only! It does not constitute specific operational advice and does not bear legal responsibility. Market conditions change rapidly, and the article may have some lag. If you have any questions, feel free to consult.
免责声明:本文章仅代表作者个人观点,不代表本平台的立场和观点。本文章仅供信息分享,不构成对任何人的任何投资建议。用户与作者之间的任何争议,与本平台无关。如网页中刊载的文章或图片涉及侵权,请提供相关的权利证明和身份证明发送邮件到support@aicoin.com,本平台相关工作人员将会进行核查。


