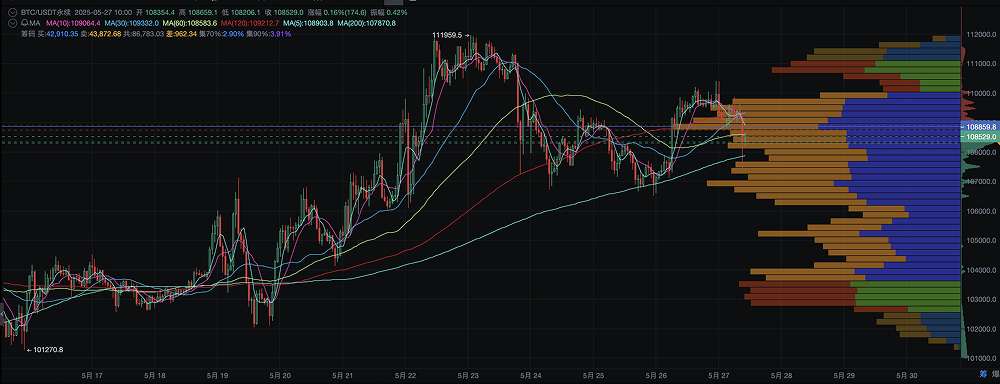
In May 2025, Bitcoin briefly broke through the $111,000 mark, setting a new annual high. However, after a strong peak, the price quickly entered a consolidation range, trading around $108,000 as of May 27, with the trend becoming stagnant. Currently, both bulls and bears are at a stalemate, influenced by a complex interplay of capital flows, on-chain data, technical indicators, and macroeconomic positives.

K-Line Structure Analysis: High-Level Stagnation, Forming a Double Top Pattern
Bitcoin broke through $110,000 on May 22, reaching a new high for the phase. However, bullish momentum significantly weakened afterward, with the price failing to break through the $111,000 mark multiple times, and a bearish candlestick appeared on the evening of May 26, indicating a volume drop.
Currently, the 1-hour and 4-hour K-line patterns show a preliminary formation of a "double top" structure, with the neckline around $107,300. If this neckline support is effectively broken, it will technically confirm a short-term head pattern, with target retracement levels possibly looking towards the $105,000 area, which is a zone of high trading volume.
Additionally, from May 23 to May 27, Bitcoin made several attempts to stay above the 5-day moving average but failed, indicating a shift in the short-term trend from upward to a bearish consolidation. The Bollinger Bands are showing signs of tightening, suggesting that a change in trend is approaching, with the direction awaiting the main players' choice.
Capital Flow: Increased Short Positions from Large Holders, Marginal Tightening of On-Chain Liquidity
According to the latest data from SoSoValue, as of May 23, the "Large Holder Long/Short Ratio (Open Interest)" for Binance BTC/USDT perpetual contracts was 1.61, indicating that bulls still hold an advantage, but there has been a significant drop from previous highs; the "Total Open Interest Long/Short Ratio" was 0.46, meaning the overall account long ratio is relatively low, reflecting insufficient retail participation.
Notably, during the high-level consolidation period, the frequency of large on-chain transfers increased, with some addresses holding over 10,000 BTC showing net outflows, suggesting that major players may have intentions to cash out at this stage. Furthermore, Glassnode data shows that net inflows to exchanges increased from May 25 to 26, indicating that some market participants are inclined to bring funds back to exchanges in preparation for cashing out.
At the same time, the on-chain issuance of USDT has slowed, indicating a weakened willingness for new capital to enter the market, and speculative enthusiasm has cooled. Considering trading volume and open interest changes, Bitcoin is currently in a "turnover period" rather than an "explosive period."

Technical Indicators: Initial MACD Death Cross, RSI Approaching Weak Zone
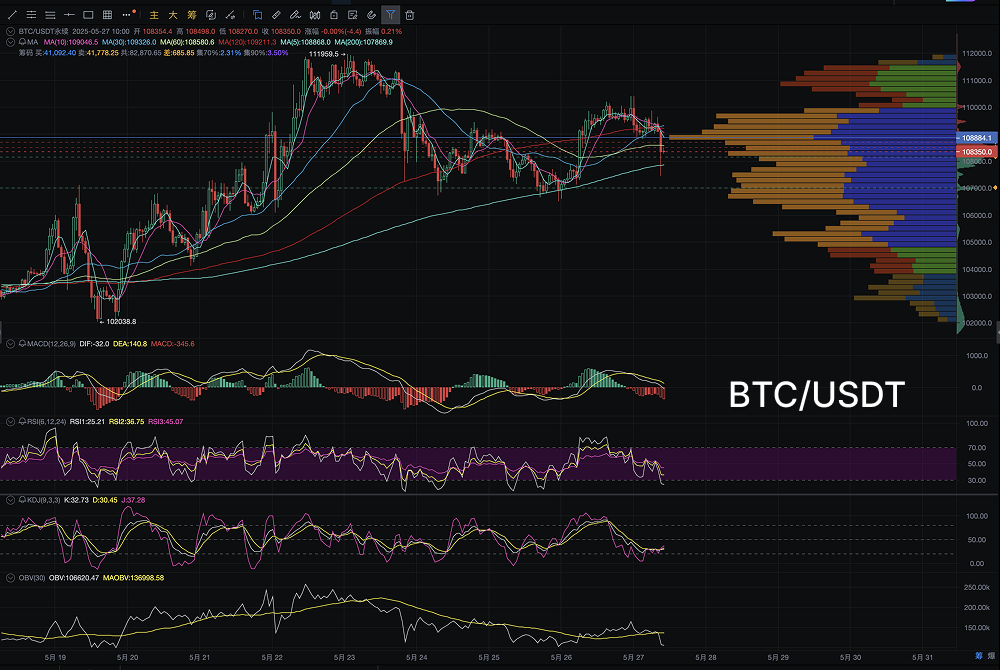
From the AiCoin K-line chart, several mainstream technical indicators are signaling a bearish trend:
MACD: On the 4-hour chart, the MACD fast and slow lines have formed a death cross, with the histogram turning from green to red, indicating an increase in short-term bearish momentum and heightened price pullback pressure.
RSI: The current value is around 36, not yet in the severely oversold range, but significantly below the previous high of 70, showing a "divergent downward" pattern.
KDJ: The J value has dipped below 20, increasing the probability of a short-term rebound, but if it cannot quickly recover the midline, it is more likely to fall into a downward trend.
OBV (On-Balance Volume): Indicates a weakening trend of capital inflow, diverging from price increases, forming a typical "top divergence" warning.
In summary, the technical outlook has not completely turned bearish, but the support strength is weakening. If bulls cannot reclaim the critical support area of $109,000 within the next 1-2 trading days, the market may enter a deeper adjustment.
High Trading Volume Area and Open Interest Cost: $108,000 Forms a Short-Term Defense Line
Combining the right-side VPVR (Volume Profile Visible Range), the current high trading volume area is mainly concentrated in the $107,500 to $109,000 range, which serves as the current "price-volume support zone." If the price loses this area, a large number of long positions may trigger stop-loss actions, leading to a local sell-off.
Additionally, according to Binance contract data, the average opening cost for major long positions is around $108,800, while the average short position is above $110,200. The close proximity of long and short position costs indicates that this is a critical battleground, where even slight fluctuations could trigger large-scale liquidations.
Conclusion and Outlook: Bulls and Bears Confront, Short-Term Defense, Mid-Term Consolidation Bias Towards Bullish
Based on the analysis of K-line patterns, technical indicators, and capital flow factors:
Short-Term: Bitcoin is forming a "high-level consolidation" platform; if it loses $107,300, it will trigger a technical adjustment, with target support levels looking towards $105,000, or even the previous gap at $100,800.
Mid-Term: As long as $111,000 is not effectively broken, the "wide-range consolidation" judgment remains. However, due to stable ETF holdings and the absence of systemic selling pressure on-chain, the mid-term structure does not have a basis for a deep collapse.
Operational Advice: The risk of chasing long positions at high levels is increasing; it is advisable to pay attention to whether a "false drop, true absorption" structure is forming, and to wait for a reduction in trading volume and a K-line rebound before positioning.
The market is currently entering a "phase of uncertain game," and from both the logic of major capital allocation and the dynamics of technical indicators, the direction has not yet clearly broken through. Investors should closely monitor whether the key level of $109,000 can be reclaimed in the next 48 hours or if it will further break below the neckline to confirm the "double top pattern."
This article represents the author's personal views and does not reflect the stance or views of this platform. This article is for information sharing only and does not constitute any investment advice to anyone.
Join our community to discuss this event
Official Telegram community: t.me/aicoincn
Chat room: Wealth Group
免责声明:本文章仅代表作者个人观点,不代表本平台的立场和观点。本文章仅供信息分享,不构成对任何人的任何投资建议。用户与作者之间的任何争议,与本平台无关。如网页中刊载的文章或图片涉及侵权,请提供相关的权利证明和身份证明发送邮件到support@aicoin.com,本平台相关工作人员将会进行核查。


