The hourly BTC/USD chart indicates bitcoin is attempting to base after a micro downtrend, stabilizing around $106,765. Recent price action suggests the formation of a potential double bottom or a subtle bullish divergence between price and volume. Volume has been declining on downward moves but has shown a modest uptick accompanying green candles, signaling a potential momentum shift. Scalping opportunities may be present for aggressive intraday traders entering between $107,000 and $107,300, with tight stops below $106,700. More cautious participants may consider entering after a break above $108,000, aiming for a near-term target between $108,800 and $109,500 while trailing stop-losses as price ascends.
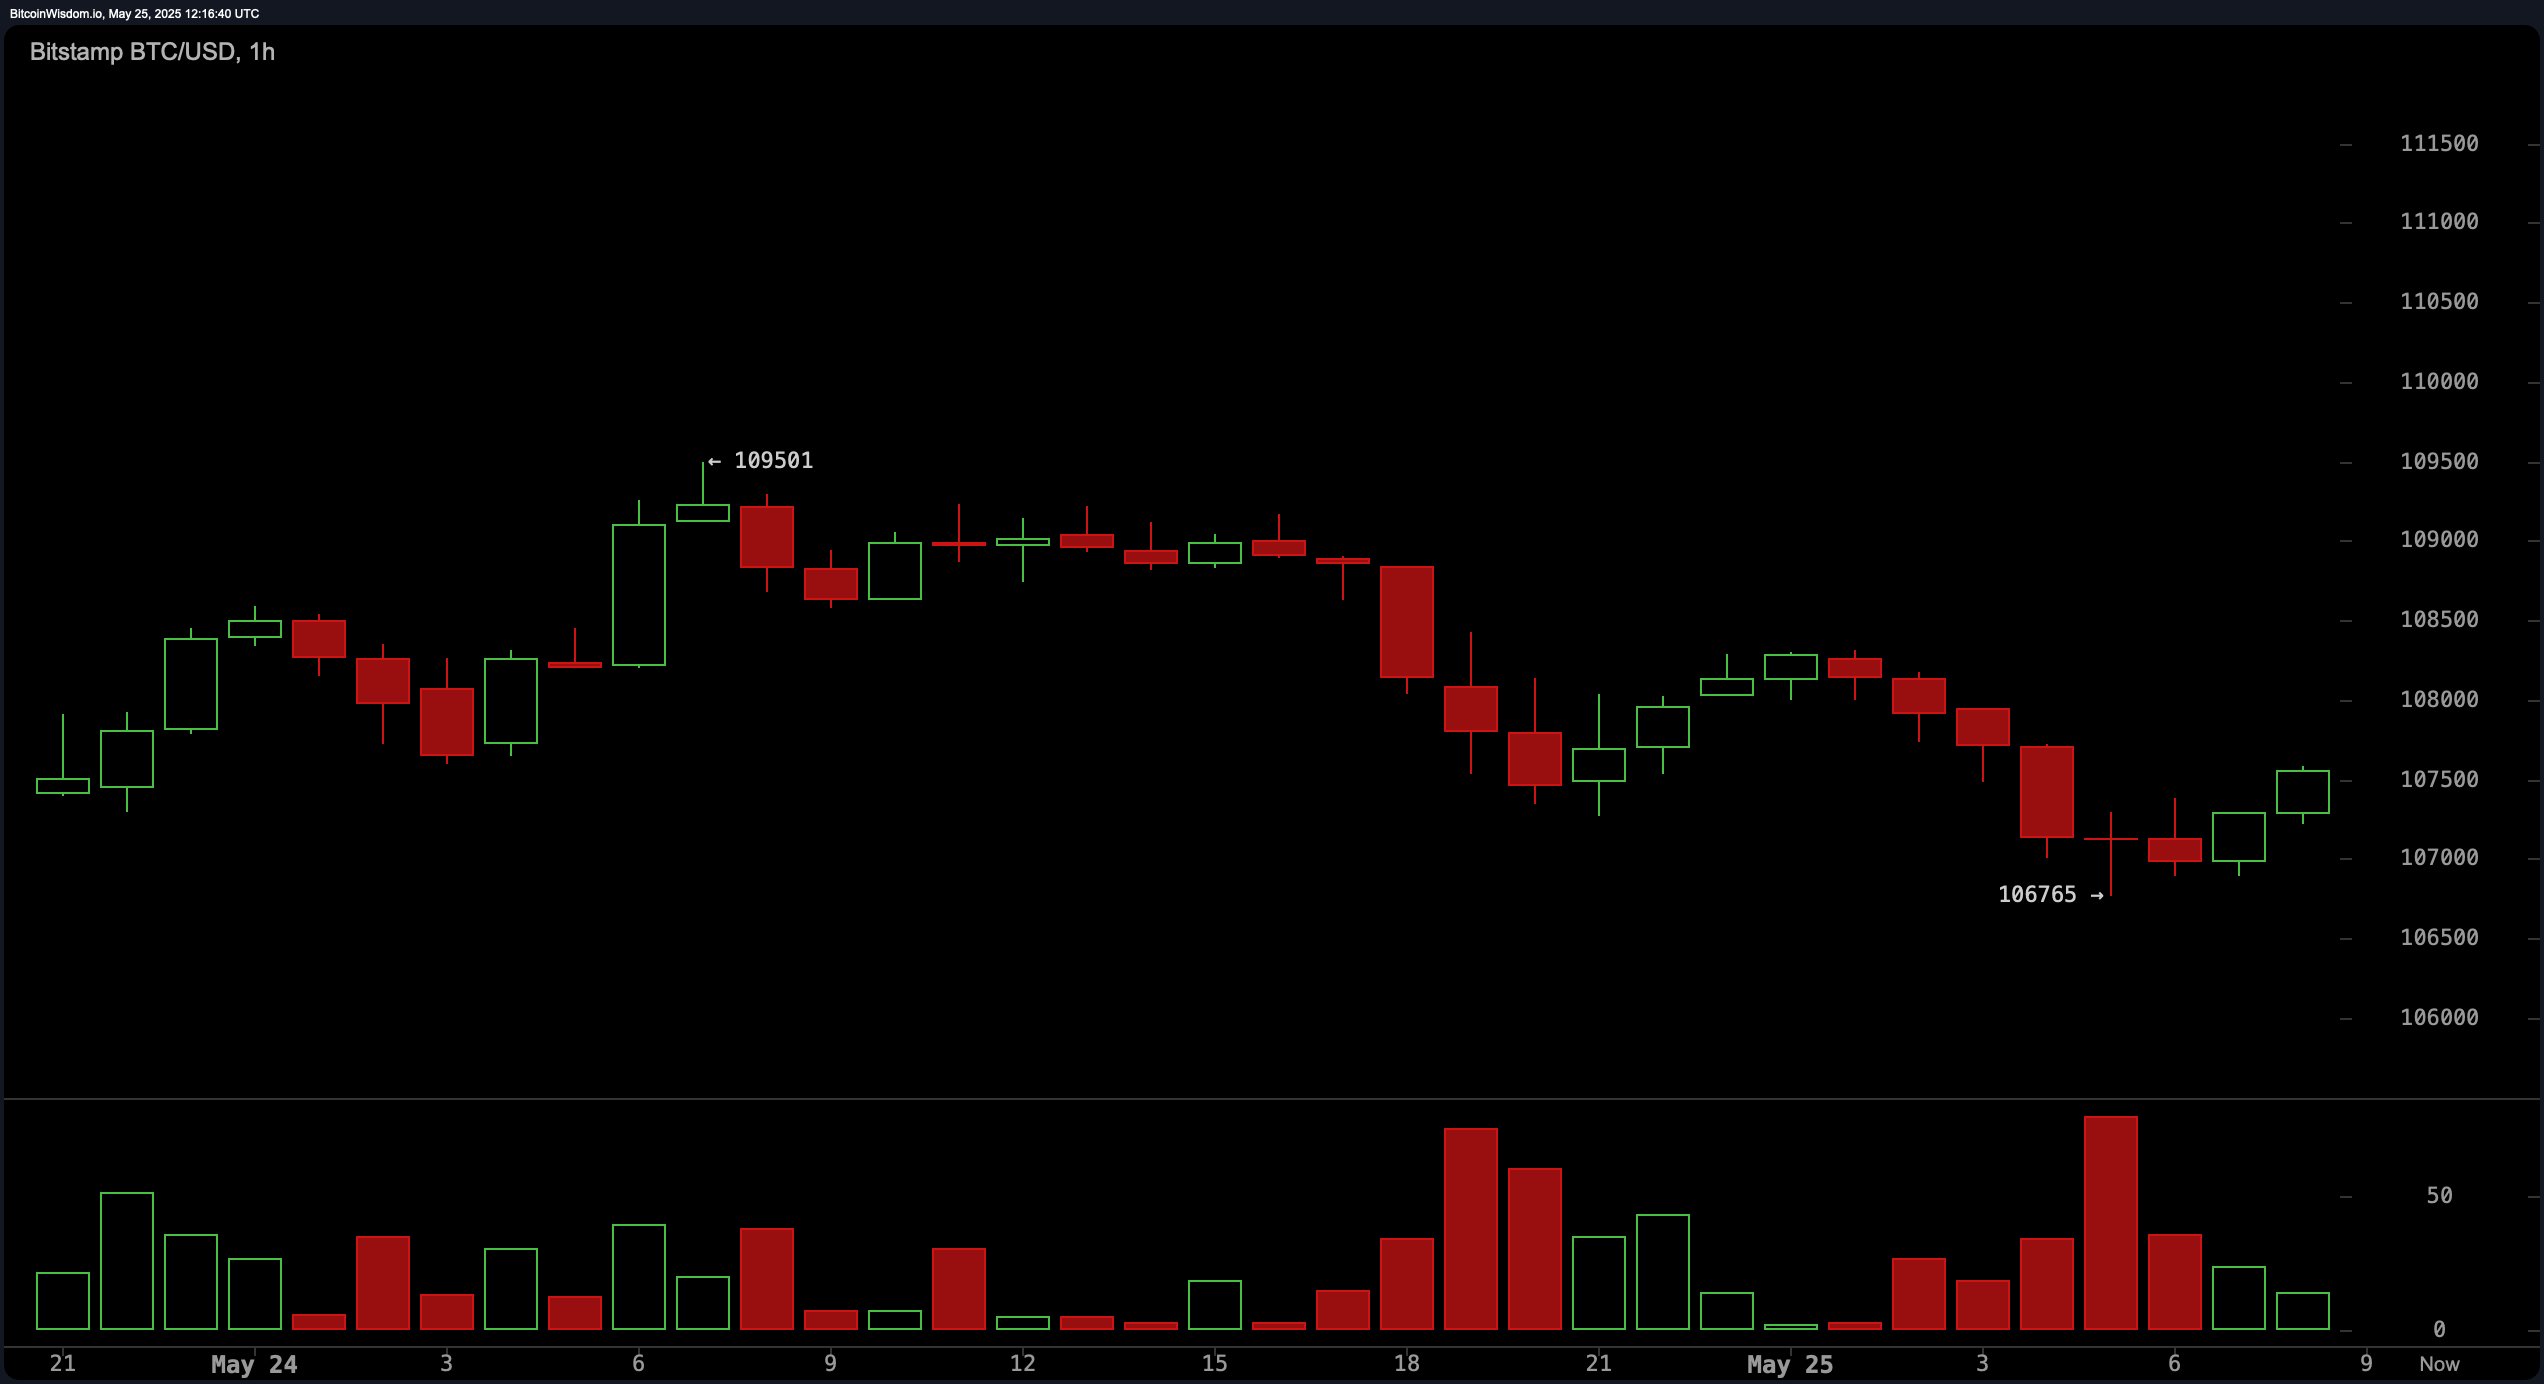
BTC/USD 1-hour chart via Bitstamp on Sunday, May 25.
On the 4-hour chart, bitcoin is following a rounded top pattern, initiating a downward structure post the $112,000 peak. A sequence of lower highs and lows has materialized, with bearish volume surging during the drop from $111,000 to $107,000, underlining seller dominance. Short-term traders may identify an opportunity if the price rebounds from the $106,500–$107,000 region with diminishing sell volume. Conversely, a bullish crossover above $108,500 with supporting volume could represent a valid reversal entry point. Potential exits reside within the $109,500 to $110,000 range, but a decisive move above $110,000 is needed to shift the current bias.
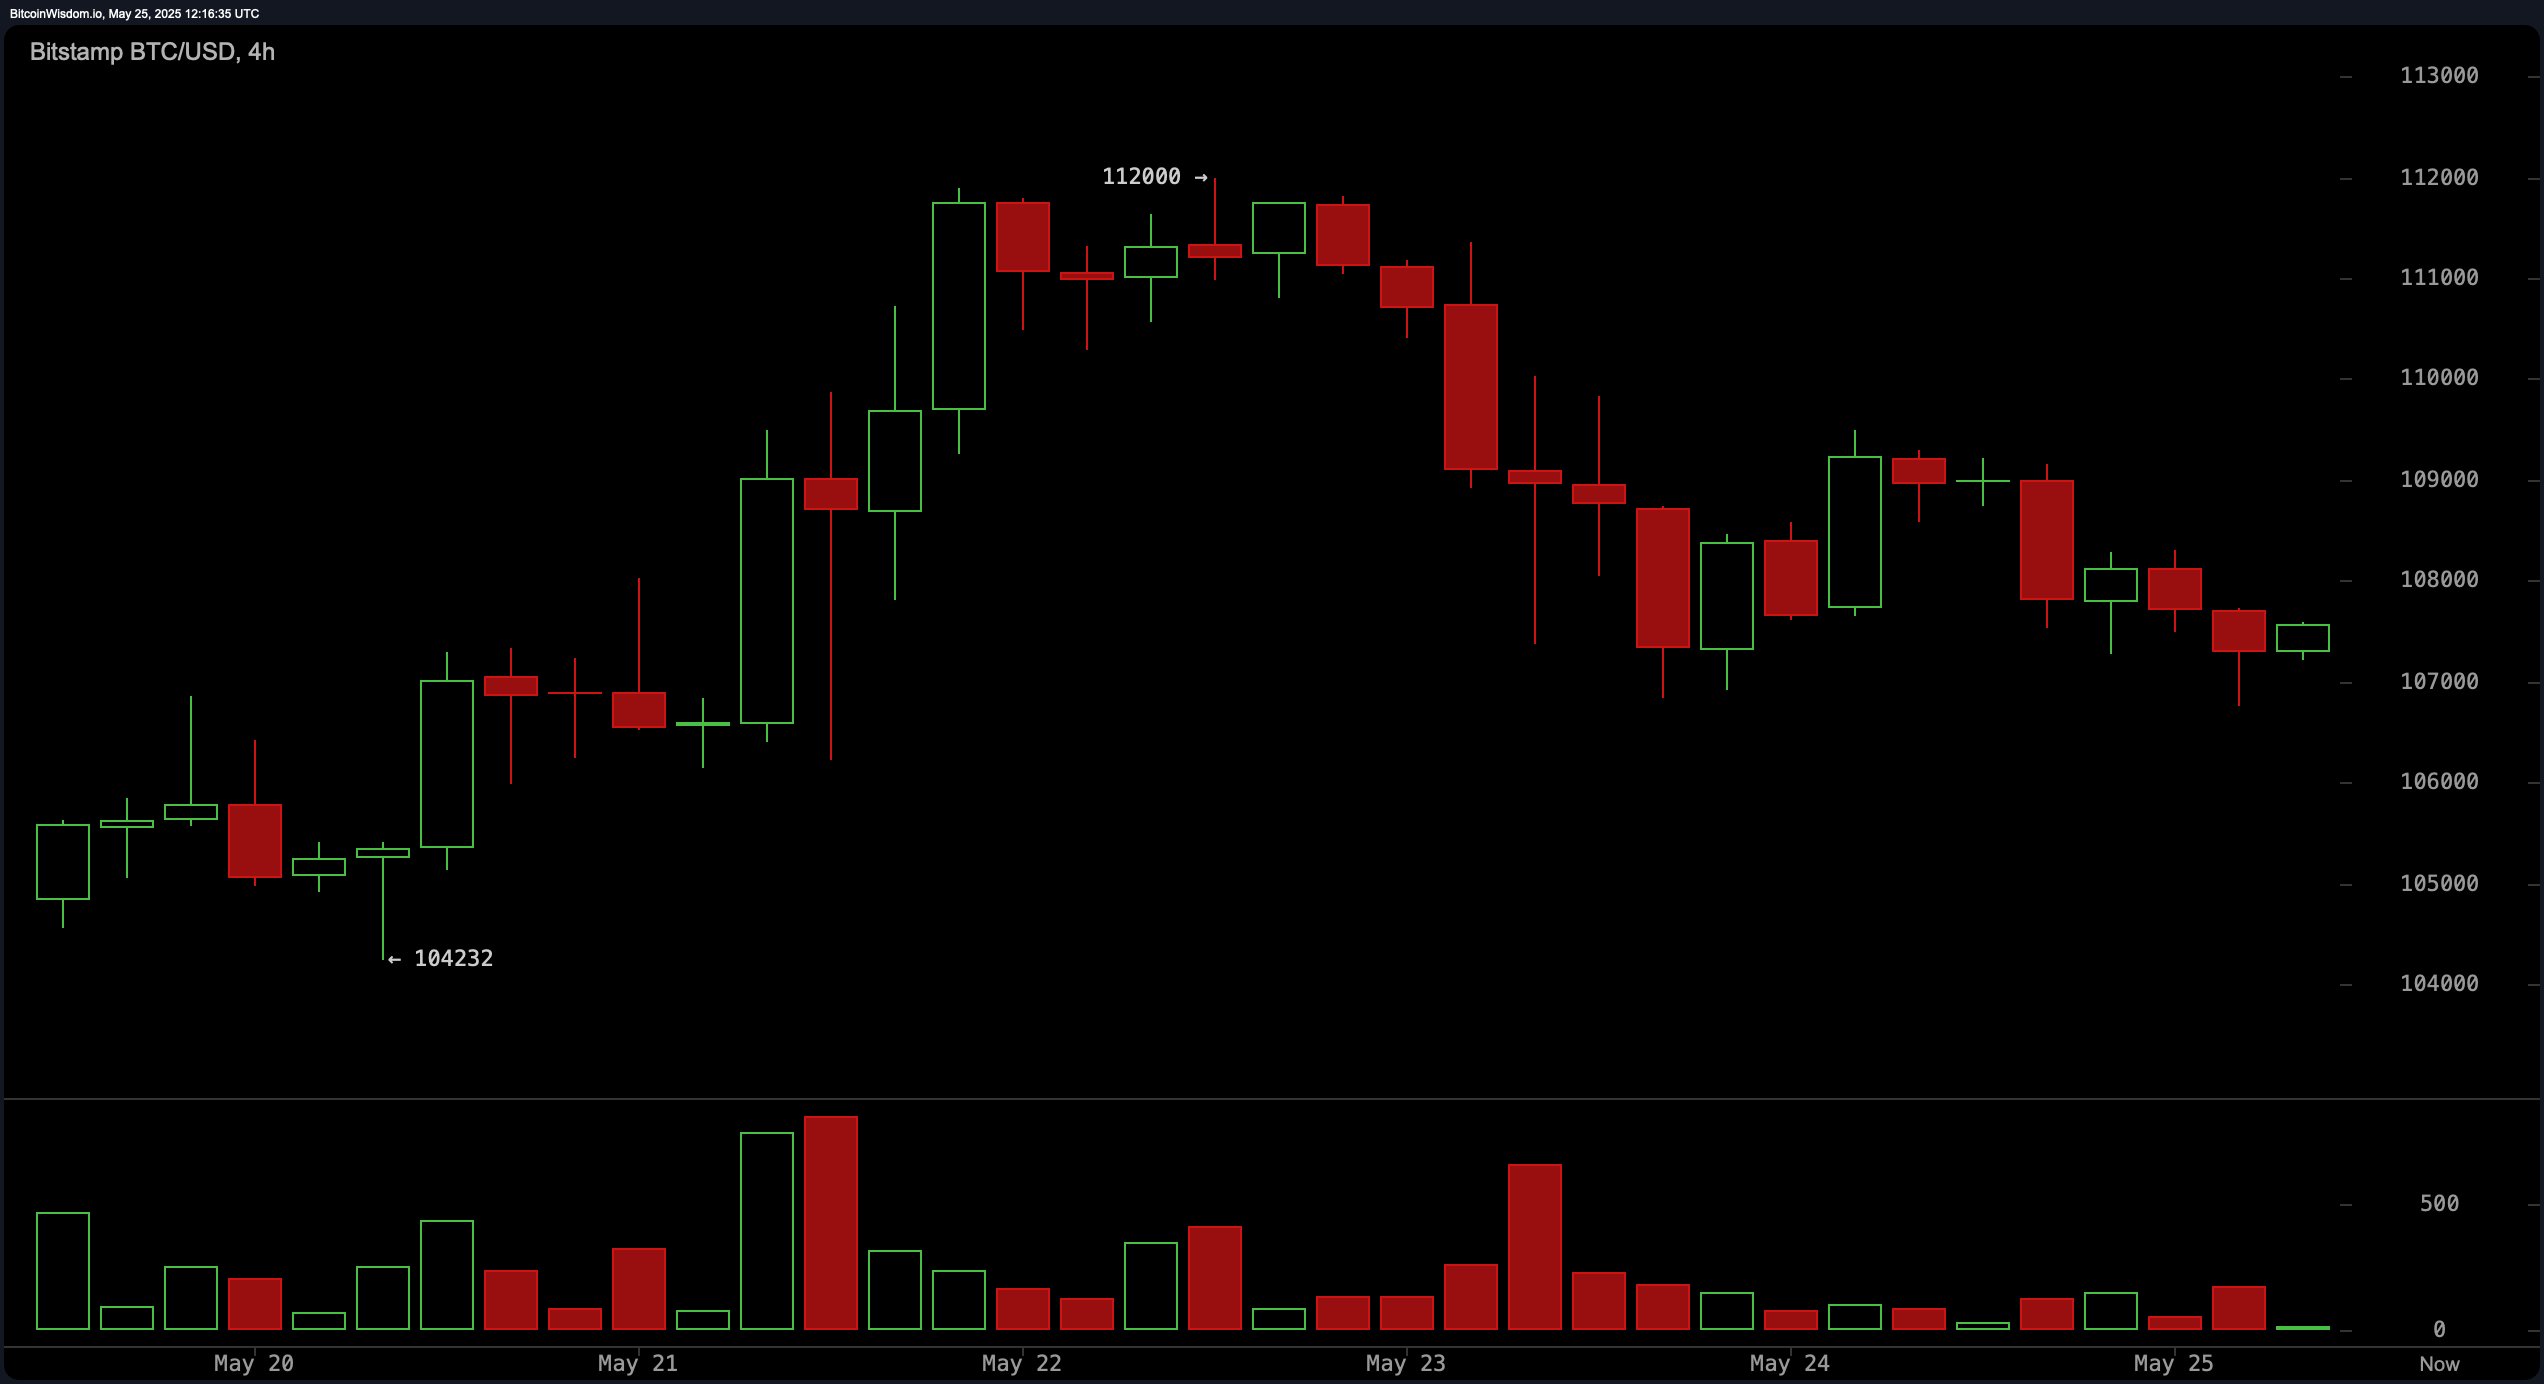
BTC/USD 4-hour chart via Bitstamp on Sunday, May 25.
From a daily perspective, bitcoin (BTC) remains in a broader uptrend despite experiencing rejection at the psychological resistance of $112,000. Support lies between $104,000 and $106,000, an area to monitor for stabilization and possible bullish reversal signals. Volume data from this timeframe highlights a surge in selling during the retreat from $112,000, indicative of profit-taking rather than structural weakness. Swing traders should look for strong bullish confirmation near the $106,000 mark before initiating long positions, targeting the $112,000 resistance for profit realization.
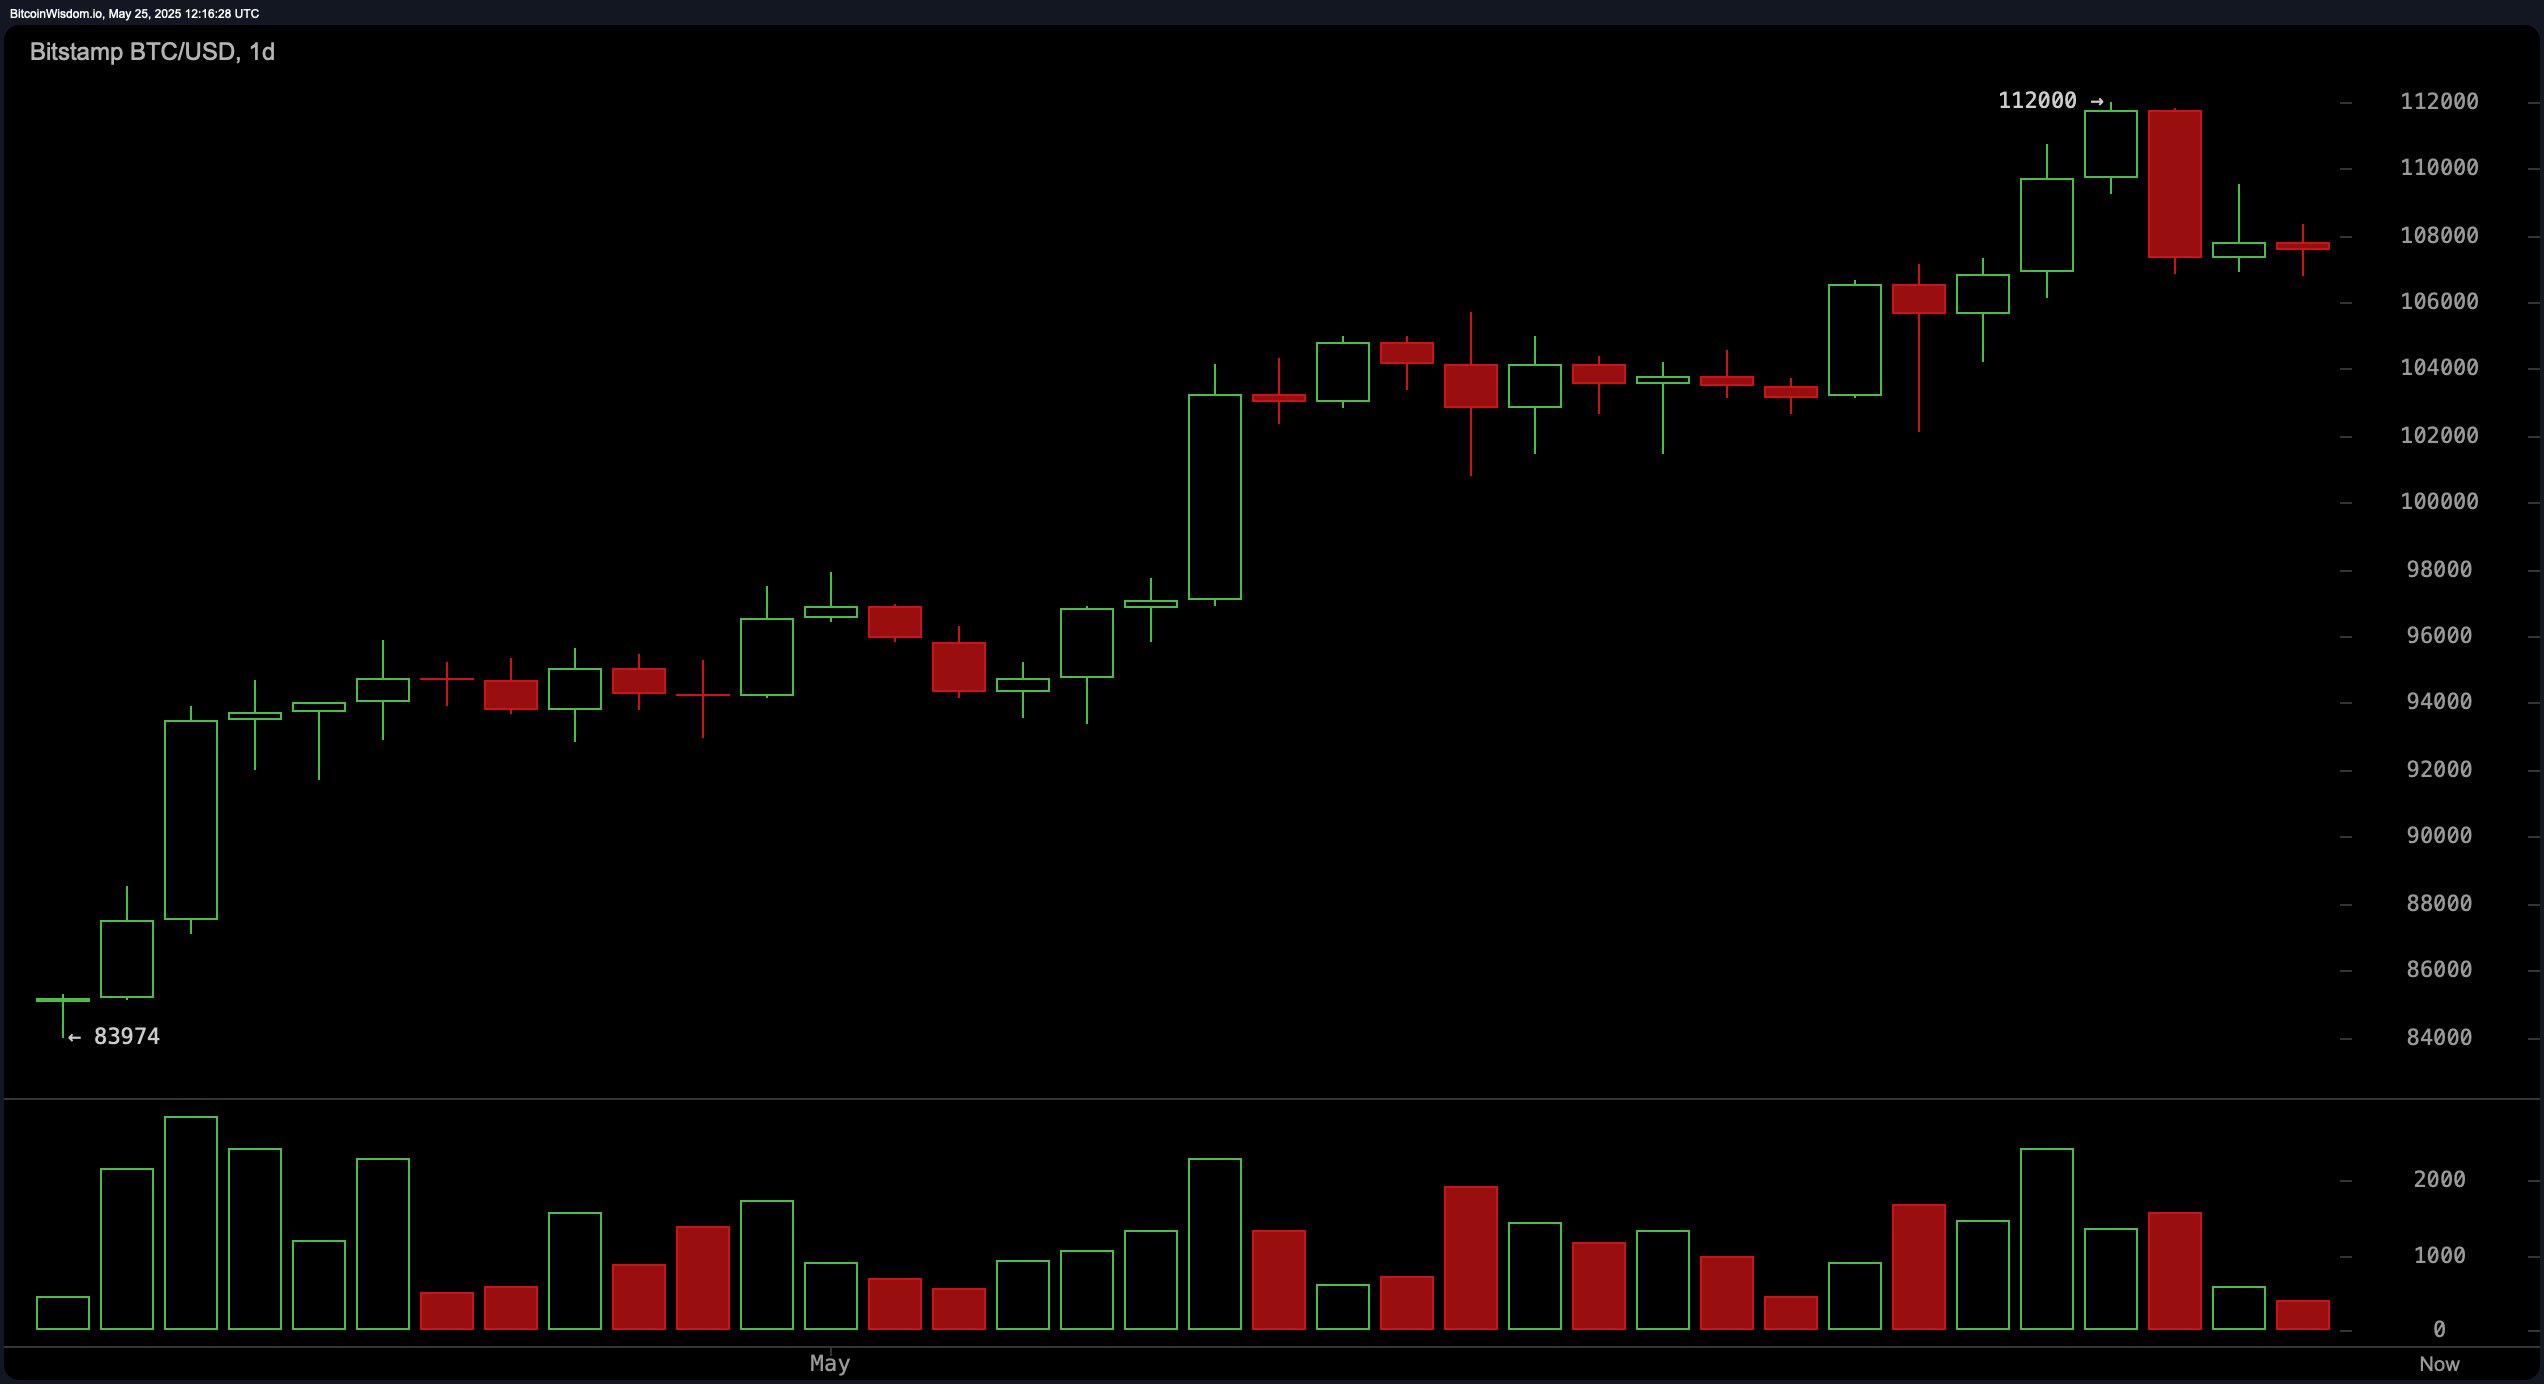
BTC/USD 1-day chart via Bitstamp on Sunday, May 25.
Analyzing key oscillators, most indicators portray neutrality with subtle bearish undertones. The relative strength index (RSI) is at 63, signaling a non-committal stance. The Stochastic oscillator and the commodity channel index (CCI) are at 60 and 81, respectively, both indicating neutral momentum. The average directional index (ADX) stands at 33, revealing a lack of dominant trend strength. However, both the momentum indicator at 3,575 and the moving average convergence divergence (MACD) at 3,700 signal sell actions, hinting at short-term bearish pressure that traders should factor into positioning.
Fibonacci retracement levels across all timeframes delineate crucial support and resistance zones. On the daily chart, key levels include 38.2% at $101,294 and 50% at $97,987, both acting as potential accumulation zones in the event of further declines. The 4-hour chart emphasizes support between $107,199 (61.8%) and $108,116 (50%), aligning with intraday bounce zones. Meanwhile, the hourly chart marks critical retracements at $107,810 and $108,133, strengthening the case for near-term support around $107,800, particularly for traders watching for a rebound.
Moving averages (MAs) continue to support a bullish longer-term outlook. All exponential moving averages (EMAs) and simple moving averages (SMAs) from 10-period to 200-period are currently aligned in buy mode. Short-term signals are evident with the 10-period EMA and SMA both above $106,890. Longer-term confidence is reinforced with the 200-period EMA at $89,658 and SMA at $93,966, underscoring broad upward price structure. This layered support suggests that unless significant downside pressure emerges, the overall trend remains constructive, giving investors reasons to remain optimistic.
Bull Verdict:
The alignment of all major moving averages in buy territory, alongside potential double-bottom formation on the hourly chart, favors a bullish continuation. If bitcoin holds above $107,000 and reclaims the $108,500 level with volume confirmation, a renewed attempt at $112,000 appears viable. Longer-term trend structures remain intact, supporting upward momentum barring any macroeconomic shocks.
Bear Verdict:
Despite the upward trajectory on broader timeframes, recent price rejection at $112,000 and sell signals from the momentum indicator and moving average convergence divergence (MACD) suggest caution. Failure to hold support near $107,000 or a break below $106,700 could accelerate a move toward deeper retracement levels at $104,000 and $101,294, exposing bitcoin to further correction.
Final Take:
Bitcoin is at a technical crossroads, with bullish structure still valid but facing short-term headwinds. Traders should stay adaptive—favoring long setups above $108,500 and preparing for deeper support testing if $106,700 fails. Confirmation through volume and price action is essential before committing to directional trades. Risk management remains paramount in this volatile phase.
免责声明:本文章仅代表作者个人观点,不代表本平台的立场和观点。本文章仅供信息分享,不构成对任何人的任何投资建议。用户与作者之间的任何争议,与本平台无关。如网页中刊载的文章或图片涉及侵权,请提供相关的权利证明和身份证明发送邮件到support@aicoin.com,本平台相关工作人员将会进行核查。


