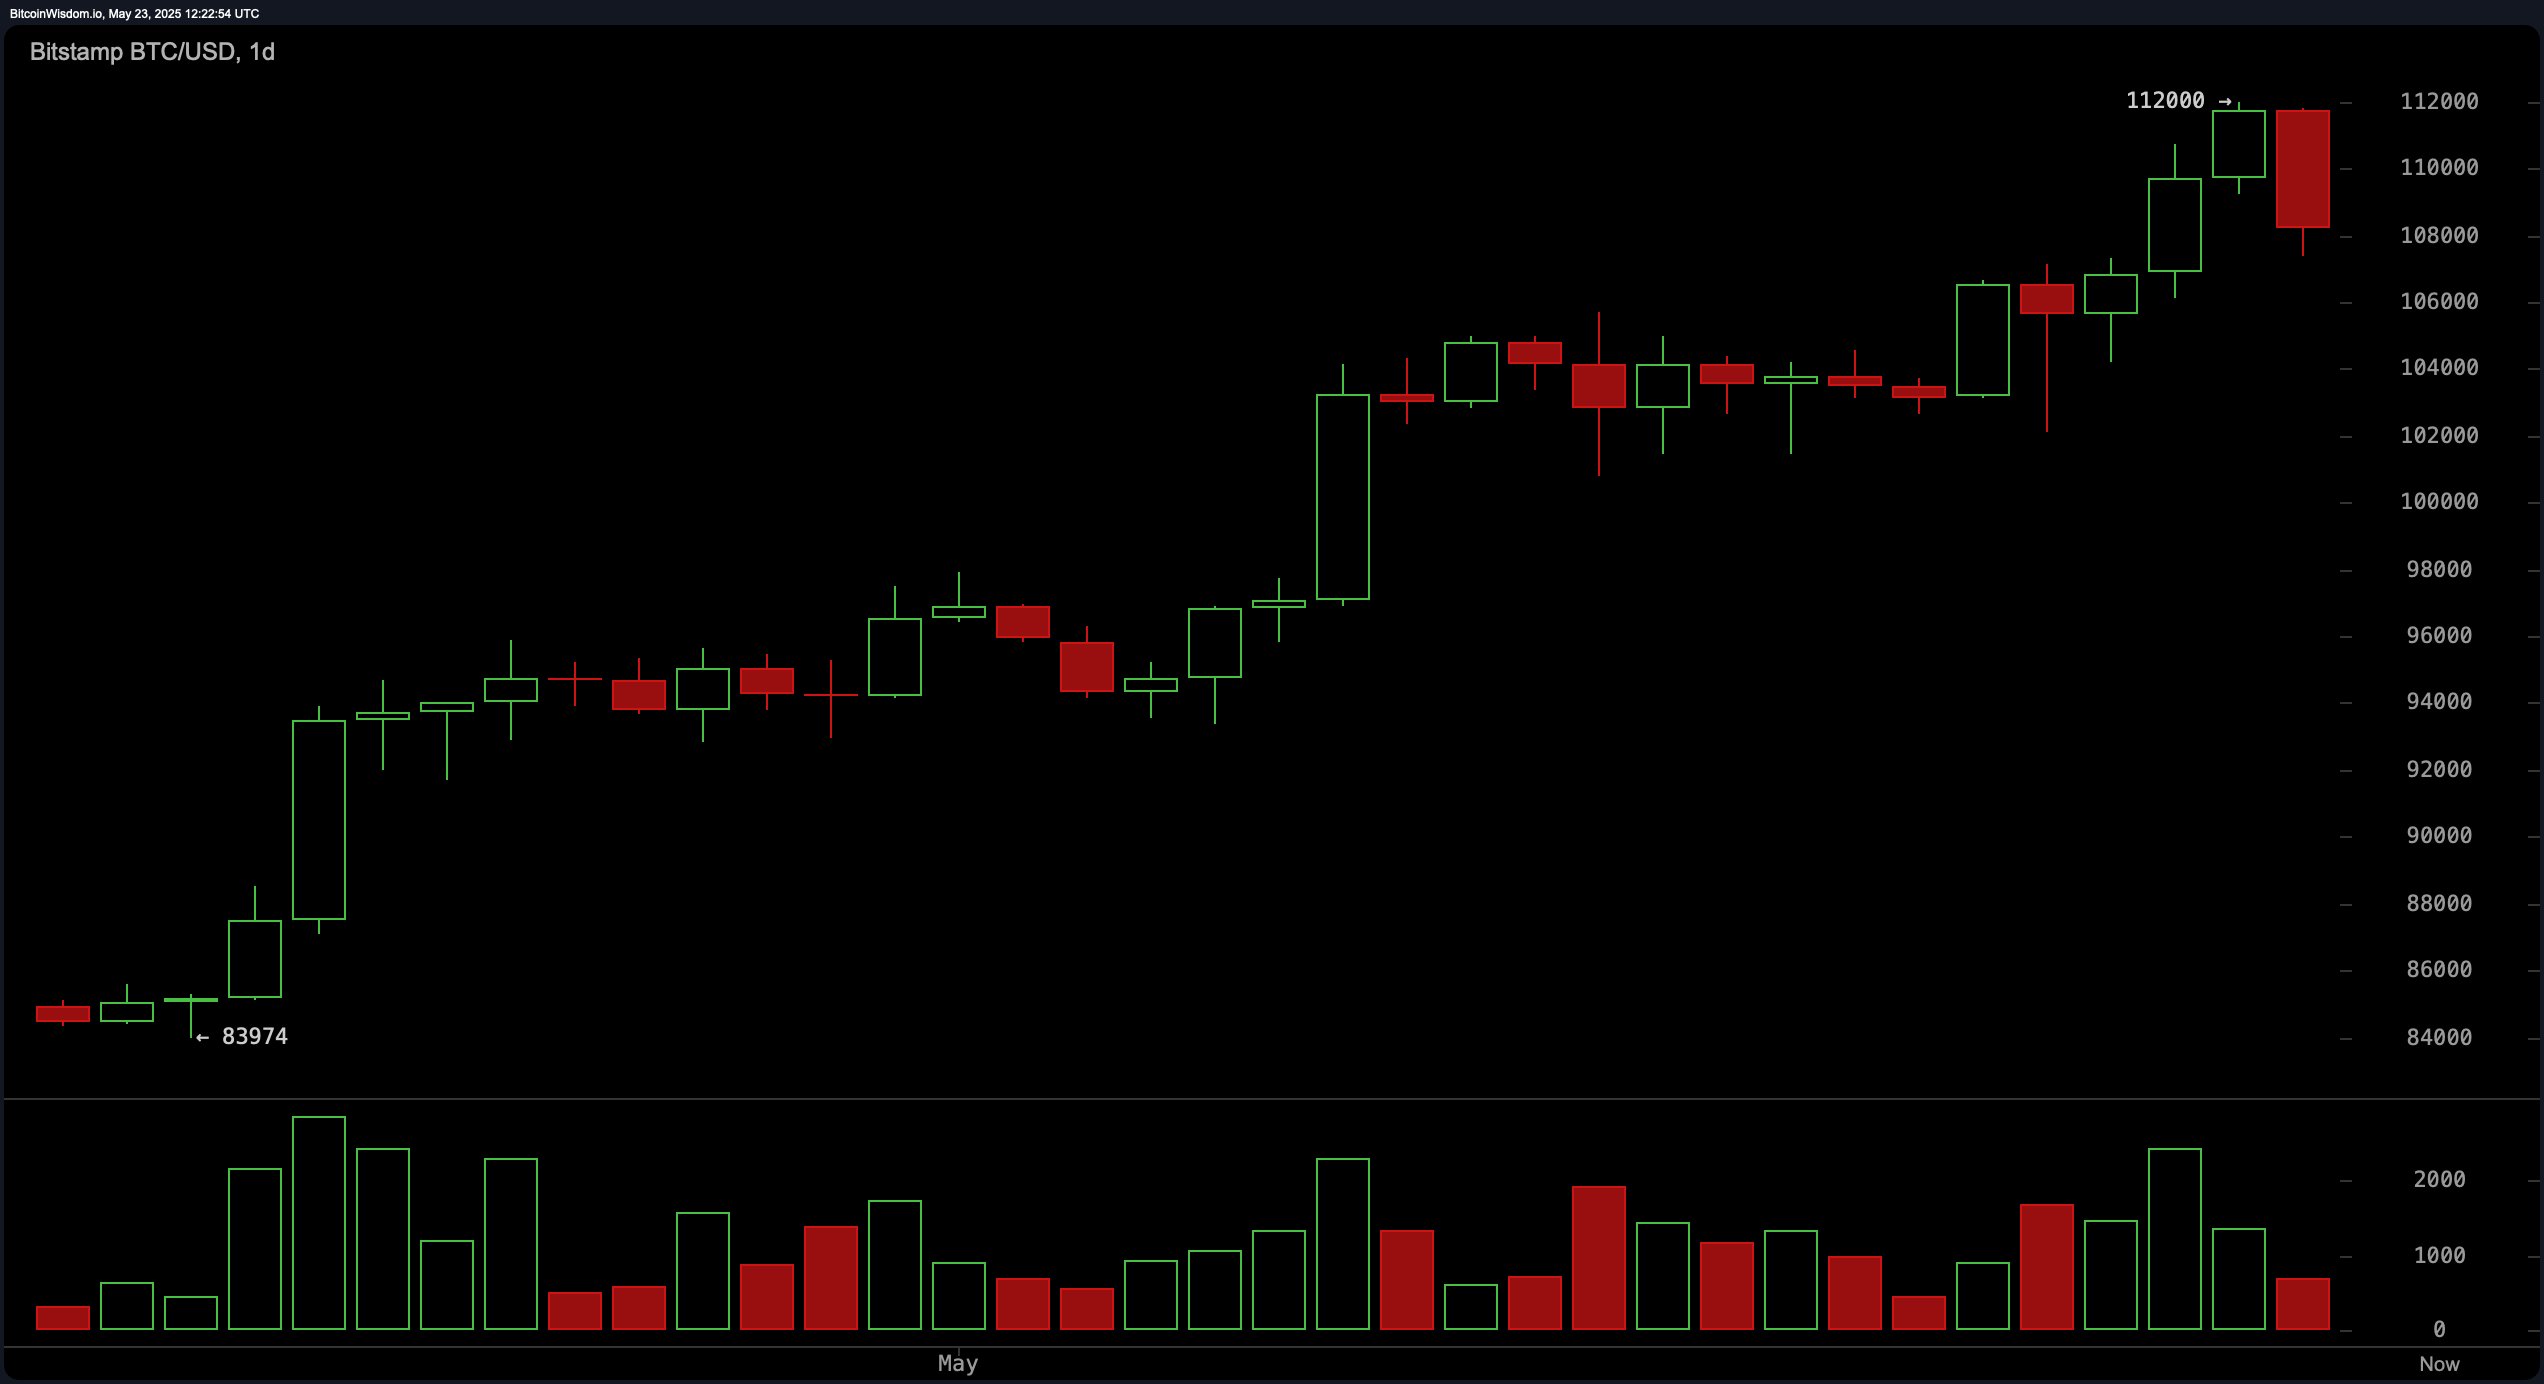
Bitcoin’s daily chart presents a cautiously optimistic macro perspective despite today’s decline. The price reached a recent high of $112,000, signaling a strong bullish trend, although the emergence of a bearish engulfing candlestick pattern suggests potential for short-term exhaustion. Volume surged during the ascent to $112,000 but has since receded, indicating a divergence between price and volume that typically precedes pullbacks.

BTC/USD daily chart on May 23, 2025.
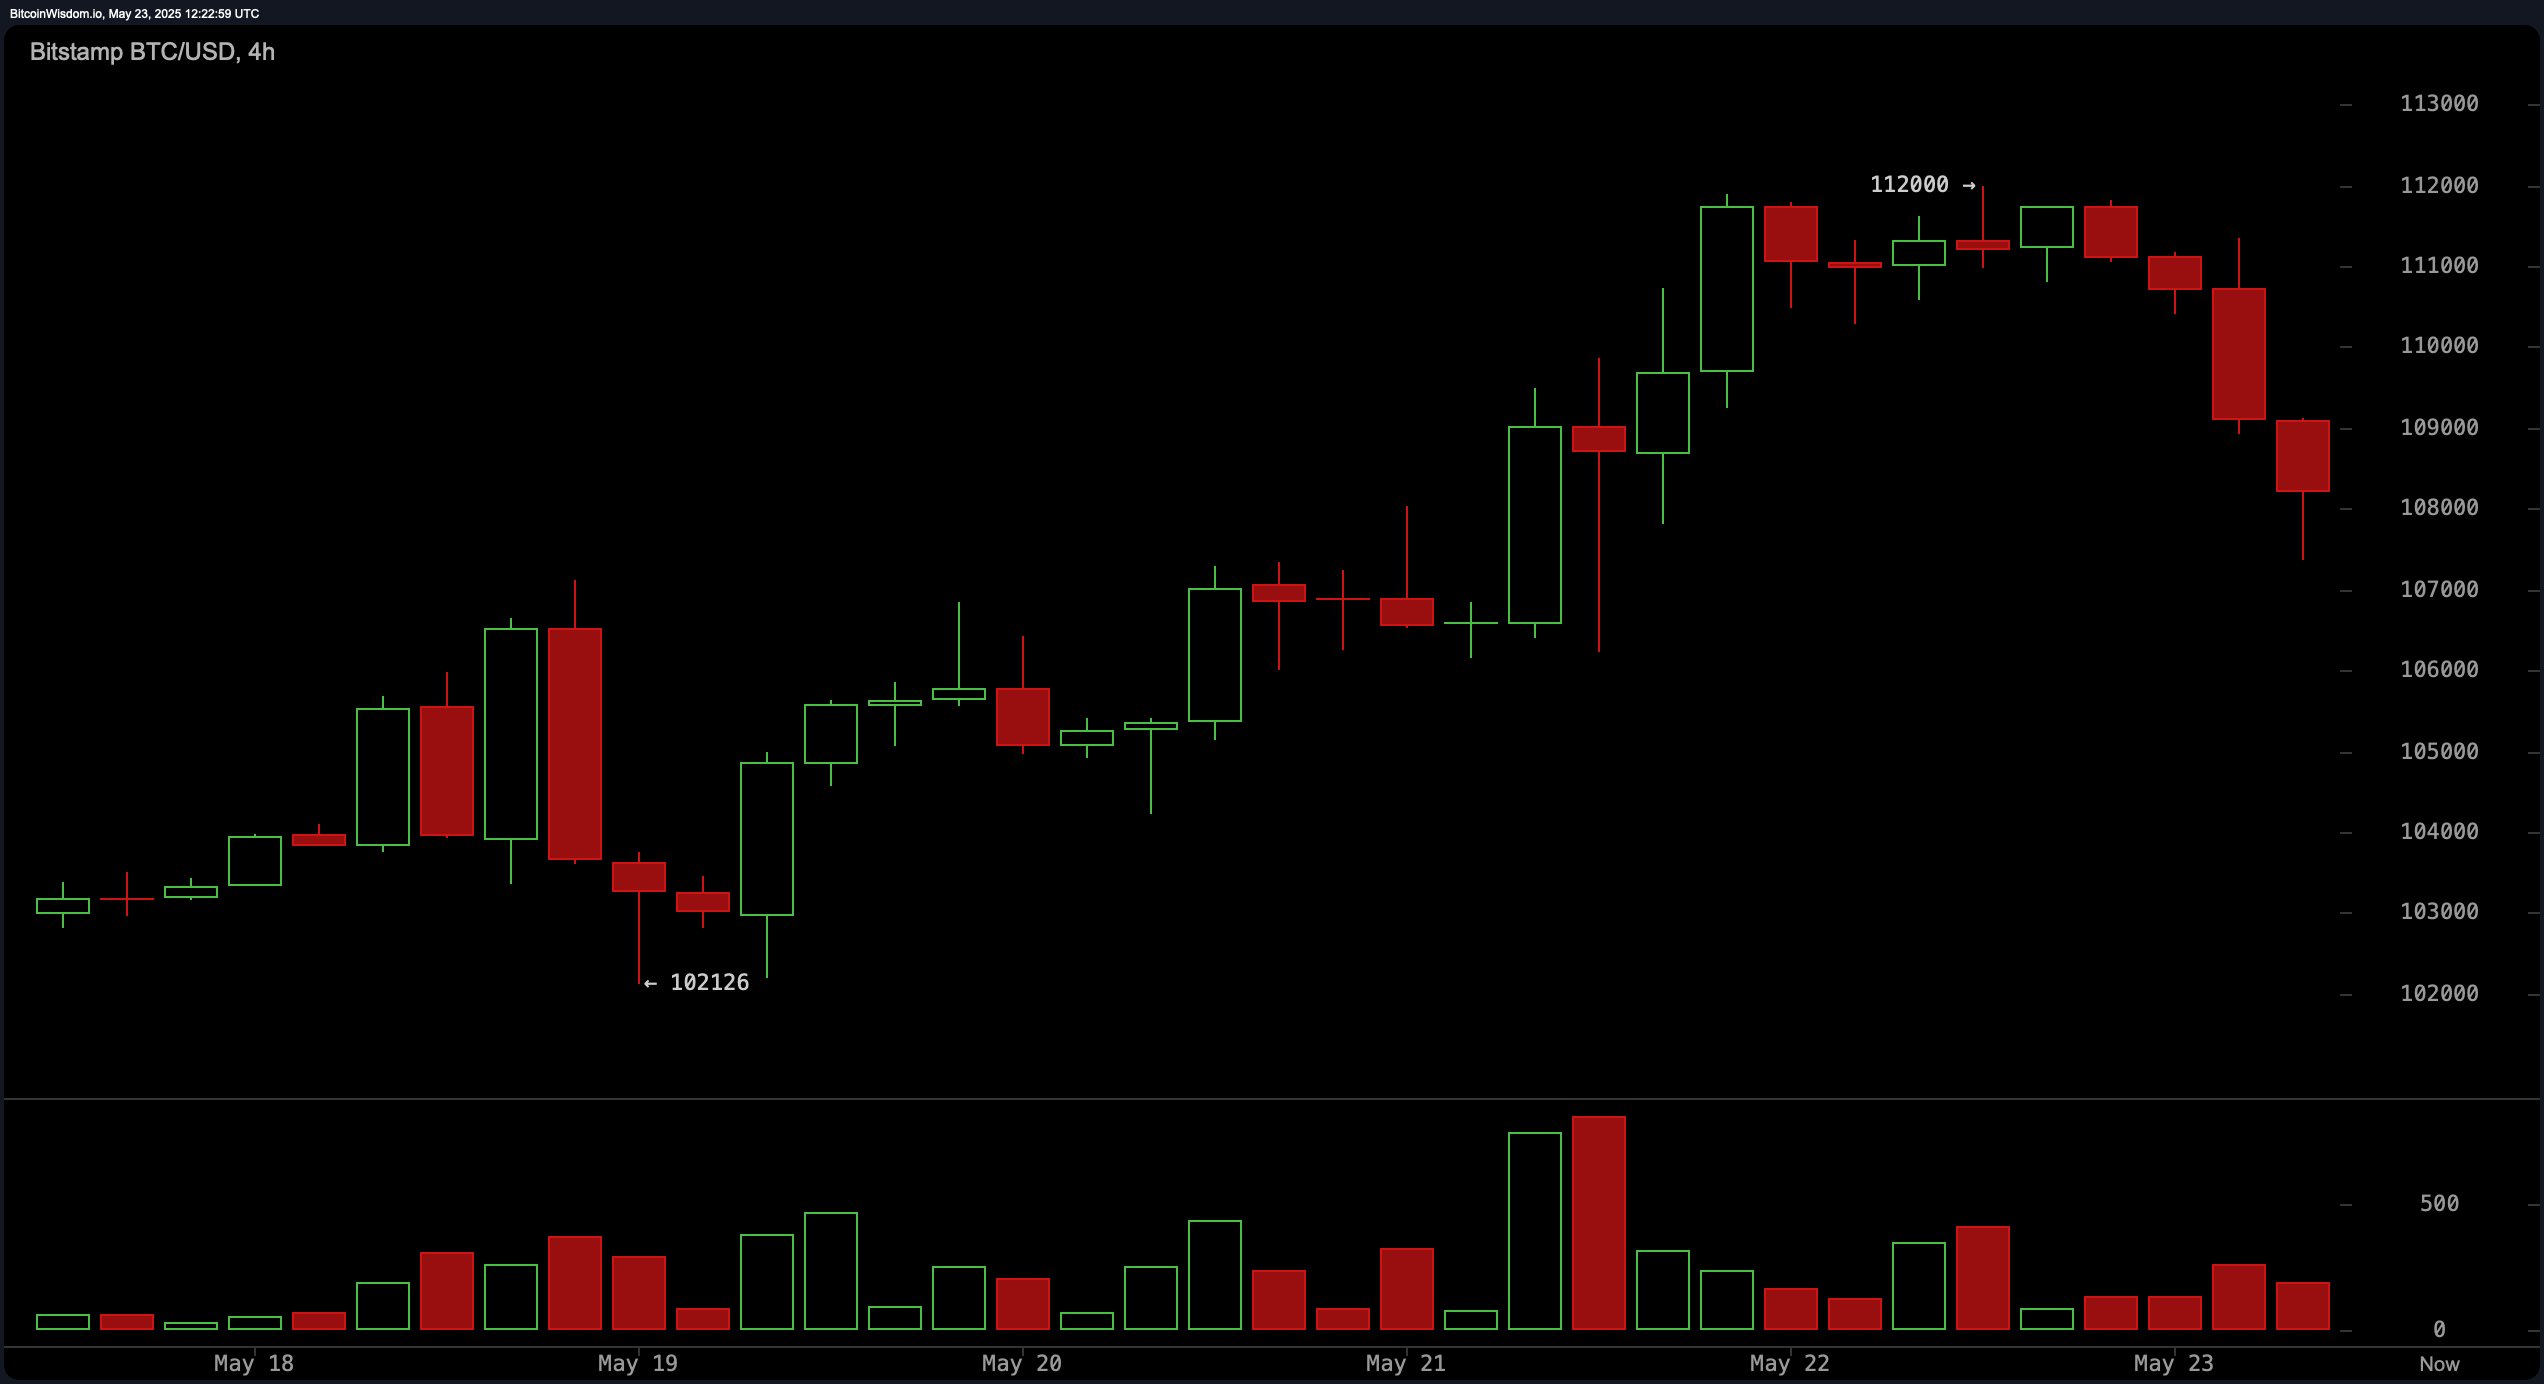
The 4-hour chart reveals a shift in sentiment, with bitcoin tracing a mid-term downtrend after peaking. This timeframe shows a clear sequence of lower highs and lower lows, reinforced by pronounced red volume bars that confirm active selling pressure. An ideal short-term re-entry level is identified near $106,500, provided that price action consolidates and signals reversal through patterns such as a hammer candle or bullish engulfing.

BTC/USD 4-hour chart on May 23, 2025.
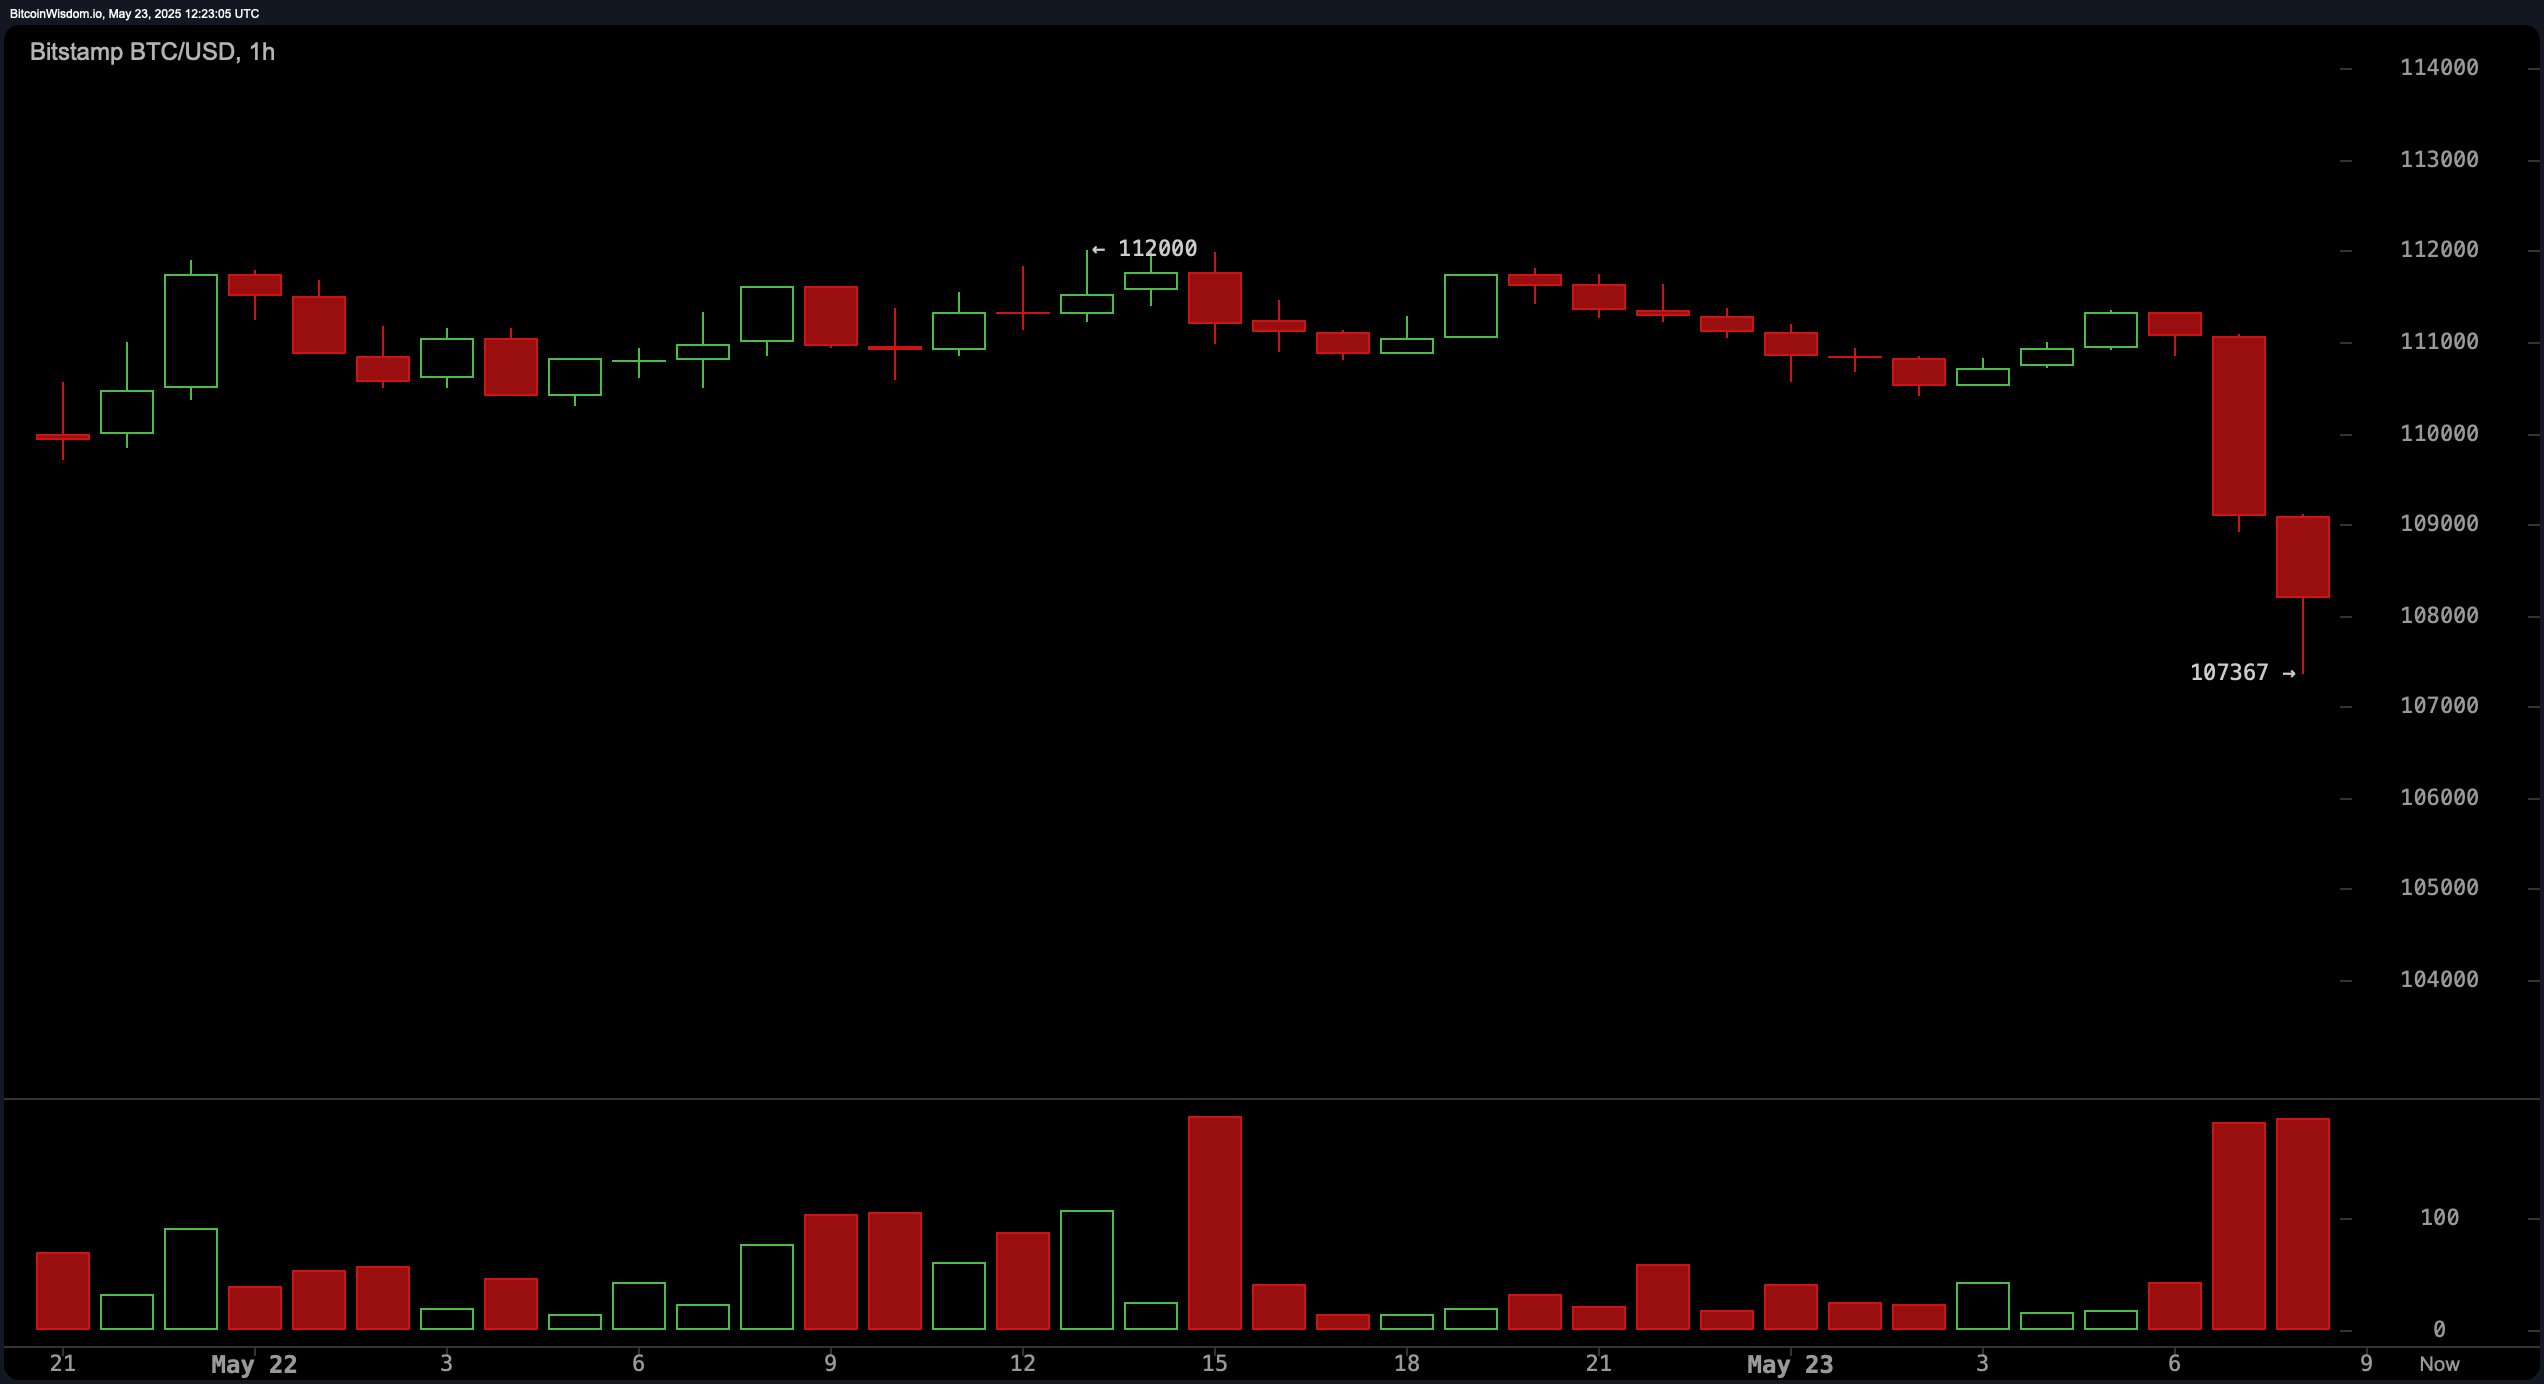
From a short-term perspective, the 1-hour chart highlights a sharper bearish momentum. A significant red candlestick drove bitcoin from approximately $111,000 to below the $108,000 zone, suggesting a high-volume capitulation event. This move is often interpreted as the culmination of a panic sell-off. Observers should be alert for a potential double bottom or a relative strength index (RSI) divergence near the $105,500 to $106,000 zone as early signs of a reversal.

BTC/USD 1-hour chart on May 23, 2025.
Technical indicators offer a mixed forecast. Oscillators such as the RSI at 67 and the average directional index (ADX) at 35 remain neutral, while others like the Stochastic at 87, the commodity channel index (CCI) at 140, and momentum at 4,628 suggest a selling bias.
Conversely, the moving average convergence divergence (MACD) level at 4,167 indicates a positive signal, reflecting some underlying bullish momentum. All moving averages, including the exponential moving average (EMA) and simple moving average (SMA) across 10 to 200 periods, are flashing bullish signals, indicating strong upward medium-to-long-term momentum.
In summary, bitcoin’s broader trend remains bullish, underpinned by strong support from moving averages. However, bearish patterns on shorter timeframes and cautionary signals from several oscillators suggest that traders should await confirmation of reversal before making fresh entries. The current consolidation phase may provide strategic entry points near and above the $108,000 level, contingent on technical confirmation of buyer re-emergence.
Bull Verdict:
Despite today’s 1% pullback, the prevailing trend in bitcoin remains bullish, supported by consistent buy signals across all key moving averages. If price action stabilizes above the $108,000 level and confirms a reversal with bullish candlestick patterns or oscillator divergence, bitcoin could resume its upward trajectory toward retesting the $112,000 resistance and potentially establishing new highs.
Bear Verdict:
The emergence of bearish candlestick formations across daily and intraday charts, coupled with sell signals from oscillators like the Stochastic and momentum, points to a potential short-term retracement. Should bitcoin fail to hold the $108,000 support, it risks slipping toward the $105,000 zone or lower, making caution warranted for bullish traders until clearer confirmation of support is established.
免责声明:本文章仅代表作者个人观点,不代表本平台的立场和观点。本文章仅供信息分享,不构成对任何人的任何投资建议。用户与作者之间的任何争议,与本平台无关。如网页中刊载的文章或图片涉及侵权,请提供相关的权利证明和身份证明发送邮件到support@aicoin.com,本平台相关工作人员将会进行核查。


