Bitcoin recently displayed a mini-golden cross between the 50-day and 100-day exponential moving averages (EMAs), which is a positive technical signal. This crossover is a powerful momentum indicator, particularly given the current bullish structure of Bitcoin, even though it is not as widely observed as the classic 50/200 EMA golden cross.
A clear move above the 100 EMA (orange) by the 50 EMA points to a short to midterm trend reversal confirmation. This crossover is taking place as Bitcoin continues to rise above $110,000, consolidating close to local highs after successfully breaching significant resistance levels - most notably the previous peak at $102,000.
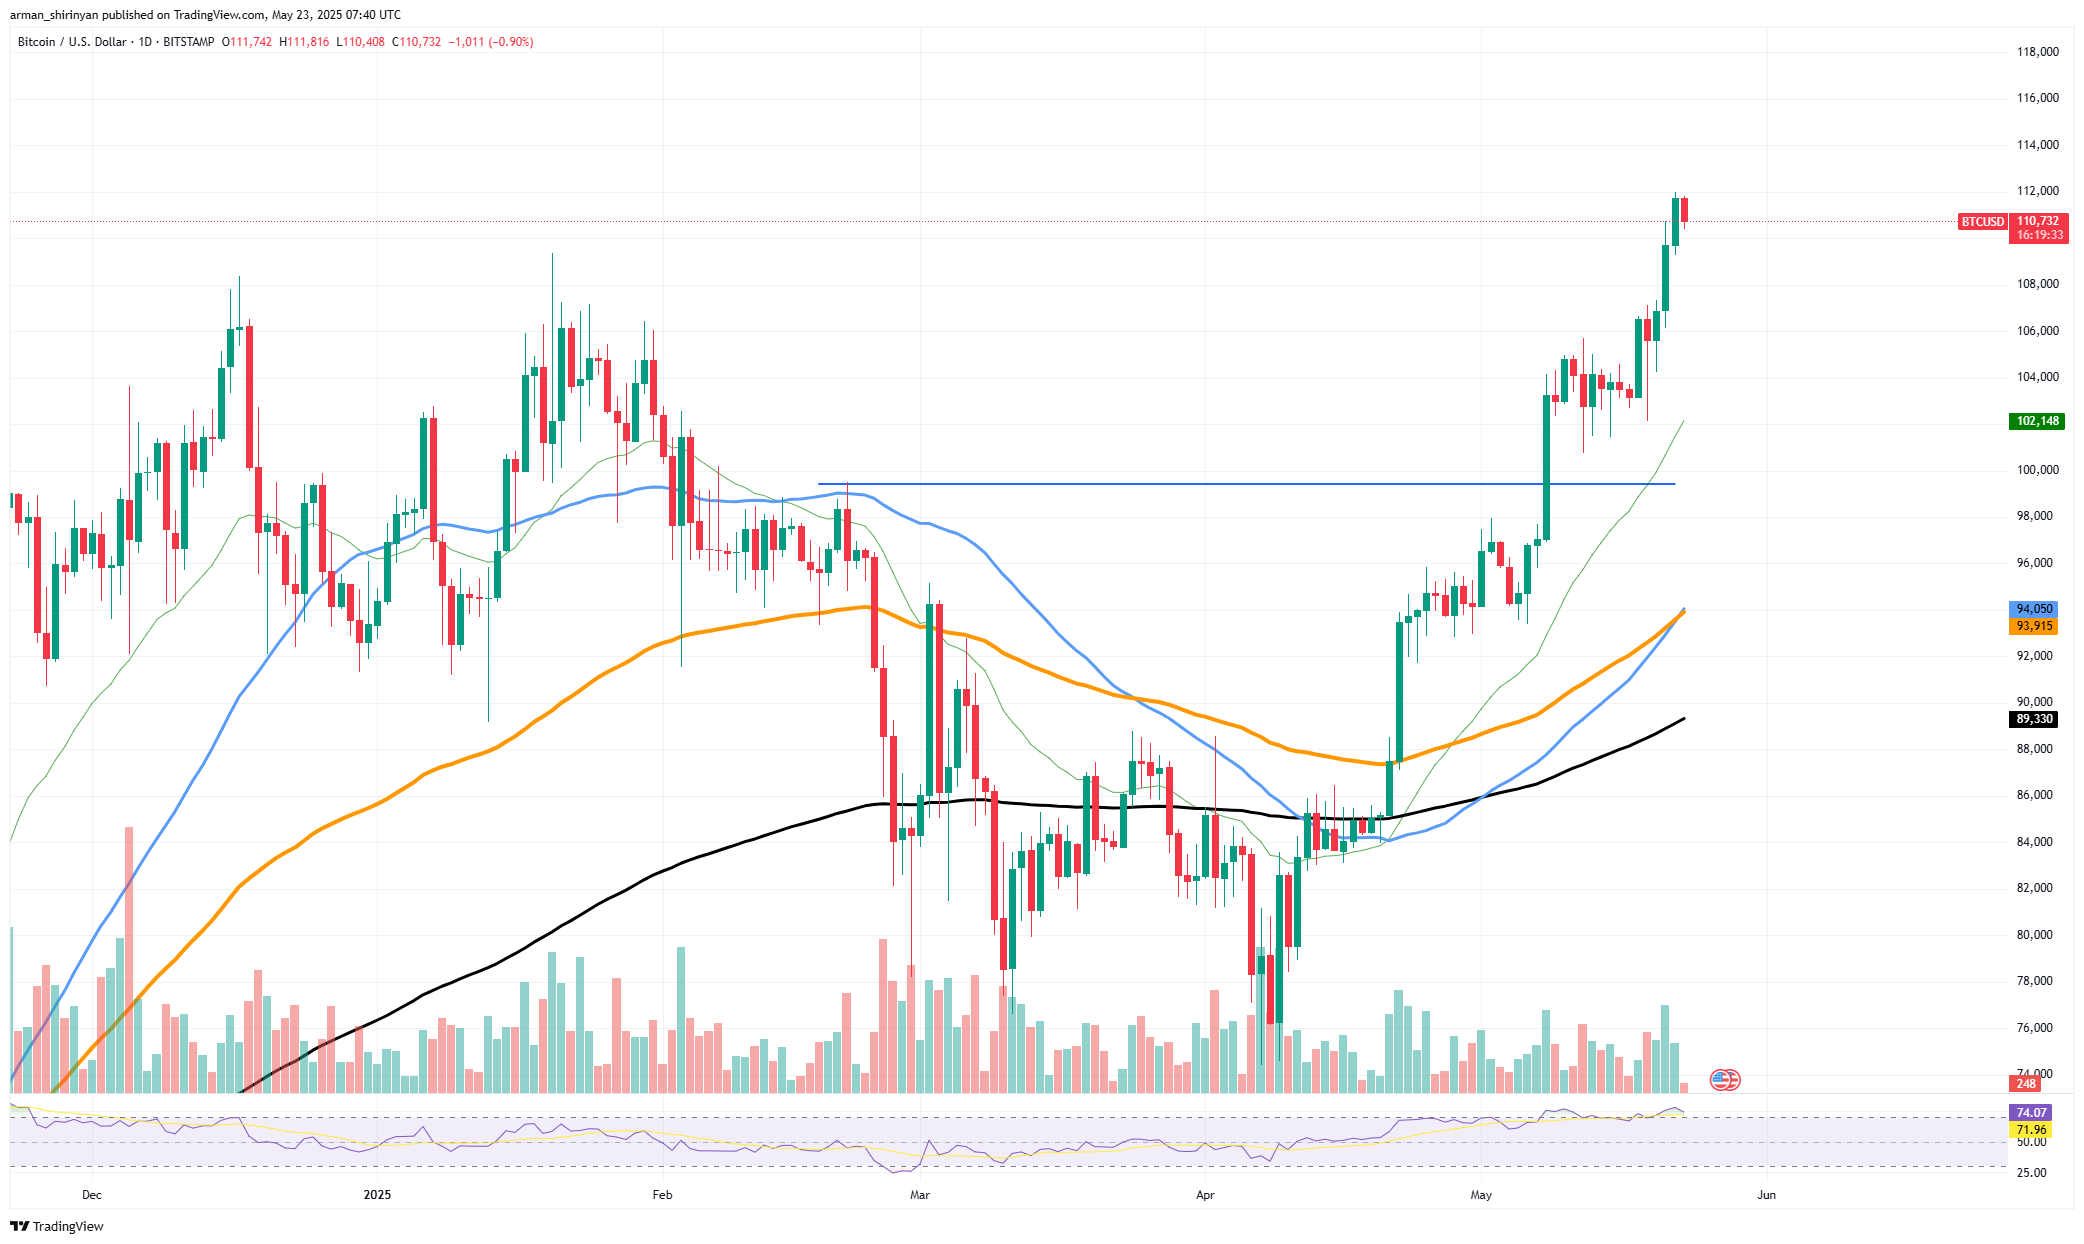
BTC/USDT Chart by TradingView
With strong follow-through, high volume breakouts and regular closes above previous resistance levels, the price structure appears to be stable. As long as the market does not overextend too soon, the RSI, which is located in the 70-74 range and is extended but not yet overheated, supports the notion of sustained momentum. The fire already stoked by institutional accumulation narratives and macroeconomic tailwinds is fueled by this golden cross.
HOT Stories Bitcoin ETFs Record Nearly $1 Billion Worth of Inflows Another XRP ETF Delayed. What's SEC Waiting for? XRP Targets $3 Following Major Developments Derivatives Behemoth CME Group Praises XRP's Utility
The market perceives EMA crossovers as confidence checkpoints, particularly in volatile areas like post-ATH discovery, where each crossover functions as a ladder rung. The next significant obstacle is the $120,000 psychological round number. The climb toward $130,000 becomes conceivable if Bitcoin clears it with significant volume, particularly if retail enthusiasm returns and the derivatives markets do not overheat with excessive leverage.
You Might Also Like

Fri, 05/23/2025 - 00:01 Bitcoin (BTC): New ATH Not That Important, Shiba Inu (SHIB) Growth Begins, Dogecoin's (DOGE) Path to $0.30 Begins Again ByArman Shirinyan
Given the obvious break above the $102,000 mark, which was once a very strong resistance, this rally may continue to grow if the outside environment continues to be favorable. However, traders should exercise caution. Such abrupt movements frequently result in short-term corrections.
Unless the market breaks on heavy selling volume, which would undermine the bullish thesis, any decline toward $102,000 would probably be a test of recently discovered support rather than a structural failure.
免责声明:本文章仅代表作者个人观点,不代表本平台的立场和观点。本文章仅供信息分享,不构成对任何人的任何投资建议。用户与作者之间的任何争议,与本平台无关。如网页中刊载的文章或图片涉及侵权,请提供相关的权利证明和身份证明发送邮件到support@aicoin.com,本平台相关工作人员将会进行核查。


