Under the multiple drivers of regulatory breakthroughs, structural capital inflows, and a recovery in market confidence, Bitcoin is once again approaching its historical high. As the "GENIUS Stablecoin Act" moves to the final voting stage in the Senate, a channel for hundreds of billions in capital to flow into the crypto market is about to open. The U.S. SEC has also simultaneously launched a new round of crypto rule drafting, releasing unprecedented policy-friendly signals.
Meanwhile, on-chain data shows that Bitcoin's non-liquid supply has reached a new high, with chips steadily migrating from short-term speculators to long-term holders. Spot ETFs continue to attract capital, and funding rates are operating at low levels, indicating that this round of price increase is not overheated but driven by institutional buying and structural tightening.
Bitcoin is moving away from early speculative logic and entering a new cycle that is more mature, stable, and capital-driven. While market sentiment remains restrained and volatility has not yet expanded, traders and institutions have differing judgments on new highs. BlockBeats has compiled this for readers' reference.
Trader Analysis
Position not breaking new highs, price breaks first = Healthy rise?
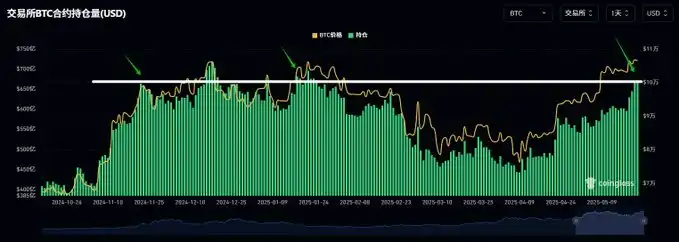
BTC's current total network position is finally approaching historical highs!
There is still $2.9 billion of potential to increase from the previous position of $69.568 billion when the price broke new highs;
The current price is only $2,000 away from breaking new highs, so even if it is completely driven by futures, it may not necessarily lead to a $2.9 billion increase in positions, meaning it is difficult to form a divergence between positions and price here;
If the price experiences a pullback, and after the pullback, positions begin to gradually increase or even exceed historical highs, then a divergence in positions may form, similar to the large structural bull top divergence that occurred at the end of 2021.
So the current logic is simple: if the price breaks new highs before the position does, it indicates that the market is still not overly FOMO, which is very healthy!
Conversely, if the position breaks new highs before the price does, it indicates that speculative sentiment is too strong, and a liquidation of positions could easily occur.
"Rising instead of falling": Active buying alleviates selling pressure
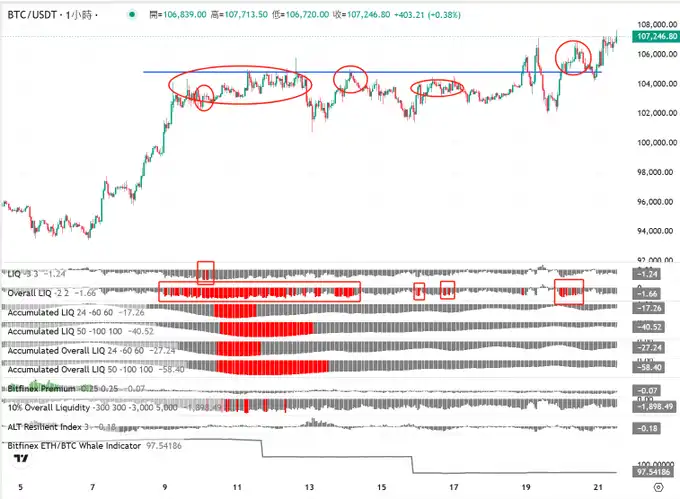
From the Coinkarma indicator, Bitcoin's "rising instead of falling" is ongoing.
Yesterday, during a Tencent meeting live broadcast, I mentioned that there would be a wave of upward breakthroughs testing previous highs in late May. On one hand, there is the expectation of a price surge before the Bitcoin conference, and on the other hand, from the CoinKarma indicator, Bitcoin's LIQ is continuously improving. LIQ measures the difference between the buy and sell orders. A "red" signal indicates that there are far more sell orders above than buy orders below (pending orders). Generally, this is a "dangerous" signal.
After the first breakthrough of 100,000 (from May 9 to 14), both Bitcoin and Overall (the "market") showed red - which is usually considered a "danger signal."
However, we also provided expectations for a main upward wave, referencing BTCUSDLONGS and ETHBTCLONGS. Therefore, we continue to observe, and we can see that there are still a few "scattered reds" appearing, but their frequency is decreasing, while Bitcoin remains above 102,000.
The most recent appearance of red was in the 106,000 range. It can be seen that although the price has risen, the red LIQ signal has significantly decreased. What is the reason for this? This is what I refer to as the "rising instead of falling" market, which is also key evidence of strong bullish momentum.
Generally, a red LIQ needs to be resolved through a price drop. When there are too many sell orders at a certain level (like 105,000), Bitcoin moves in the direction of less resistance (downward). When Bitcoin drops back to 99,000, the sell orders above decrease, and the buy orders below increase, allowing both sides to rebalance, which is why Bitcoin stops falling, and the LIQ indicator returns to normal values.
The understanding of "rising instead of falling" is that active buying has always been present, continuously impacting the sell walls, causing the pending orders at the critical level of 105,000 to decrease until they are completely absorbed. Therefore, when the price continues to rise, the LIQ actually shows improvement.
Having observed that red only appeared at 106,000 the day before yesterday, and that LIQ significantly improved when it pulled back to the 105,000 range, I am very confident in going long. This has also helped me hold onto a series of long positions like PEPE MOODENG, resulting in profits.
For future trends, based on seasonal and event-driven principles, I believe there is a possibility of continued upward movement at least until the 26th. After the 26th, caution is advised. (Regardless of whether it is a main upward wave, we must be pragmatic.)
Additionally, altcoins will only have a chance for significant rebounds if Bitcoin stabilizes above 110,000; before that, only short-term longs can be taken.
Limited contract outflows, main force has not left, cautiously bullish
Let's talk about the market situation. Just now, the S&P 500 opened down 1%, but Bitcoin did not follow the decline.
Currently, the accumulation data for Bitcoin contracts peaked between 6.6B-7B, with a maximum outflow of 1.7B, which is not a large proportion. Additionally, there is still a net inflow of 5.65B, which leads me to believe that the main force has not left, so I still lean towards being bullish.
Many friends say that BTC's main force drew many doors yesterday, but in reality, there is only one true door, which is the one I marked with an arrow. You need to look at the larger level of doors, not just the 15-minute and 1-hour charts; at least look at the 4-hour or 1-day charts.
So before the main force breaks through, they might create a false breakdown to trigger stop losses for longs and liquidate shorts, then their true intention will emerge: to rise. Moreover, we have always said that the main force's bottom chips have not exited, which likely indicates further increases.
Therefore, the overall direction is upward, and I will not short; I will keep looking for opportunities to go long on quality coins.
Key points stabilize, cannot be bearish before historical highs
Last night's judgment seems to have been "hasty." Bitcoin initially synchronized with the U.S. stock market, then started its independent trend at 11 PM, currently overturning my two viewpoints from yesterday:
The short-term topping signal has been overturned at both the hourly and daily levels.
The stablecoin legislation's impact on the market is still ongoing; prior to this, the market had not fully anticipated or priced it in.
Conclusions:
The price has broken and stabilized at 106,450, which is the second-highest point of 2025. The price breakthrough indicates that the accumulated chips here have formed effective turnover, and the price will further push upward, so it cannot be bearish in the short term.
The stablecoin legislation is not considered a favorable outcome until it is signed by Trump and becomes law. Once Trump signs the bill into law, attention should be paid to the favorable outcome.
The next key turnover resistance is the historical new high, which is a critical psychological expectation and a key turnover area.
Of course, my friends must ask if my short position is still there; the answer is yes, I am waiting to see the historical high before adding to my position.
Chip concentration pauses: Direction is critical, volatility is coming
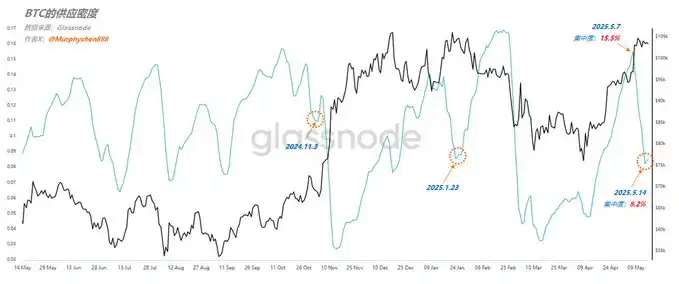
From May 7 to May 14, BTC's chip concentration dropped from a high of 15.5% to 8.2% in just 7 days. This indicates that as the price rises, it has gradually moved away from the chip concentration zone. If the concentration curve continues to decline, it is likely accompanied by a continued price rise.
However, we noticed that after May 14, the concentration curve suddenly stopped declining around 8.2% and seems to be turning upward again. An 8.2% concentration is neither high nor low.
If the price drops back into the concentration zone, the concentration curve will quickly rise again, brewing greater volatility. A similar situation occurred on January 23, 2025, where a price pullback led to a decrease in concentration from a high point, then turned upward again, amplifying price volatility thereafter.
Another possibility is that the price continues to rise, and the concentration curve only pauses briefly before continuing downward, similar to the situation marked on November 3, 2024.
In summary, the current concentration curve has not smoothly declined but has paused midway, bringing uncertainty to the market direction. Through this indicator, it is difficult to guess whether to be bullish or bearish; it only tells us that the market may be about to choose a direction.
However, when the concentration rises to a certain height, considering going long on volatility could be a good choice.
Institutional Observations
CryptoQuant: No signs of market overheating
Whenever the price of a coin experiences a strong rise, causing a large number of tokens that were previously at a loss to quickly turn profitable, the 30-day simple moving average (SMA) of the unspent transaction output (UTXO) profit and loss ratio will rise above 200. The higher this indicator spikes, the more likely the market is approaching a "overheated" or "selling pressure release" phase.
Currently, this indicator is at 99, so there are no signs of market overheating yet. If this moving average continues to break above 200, it will be a clear signal that market sentiment has entered a new round of frenzy. In other words, the market may still continue to set new highs, but the "easy fuel" that drives the profit and loss ratio higher has basically been exhausted, and stronger price momentum or significant volatility will be needed to push this indicator higher again.
As I mentioned yesterday, the third "compression period" of this cycle is the key elasticity that will push this indicator above 200 and into the overheating phase.
Matrixport: Spot buying drives, long-term capital gradually replaces short-term speculation
Bitcoin's market is showing historical trends again: the price is approaching new highs, and the open contracts have also risen to a historical high of $34 billion. However, the funding rate remains close to zero. This indicates that this trend is driven by spot buying rather than leveraged contracts.
The low funding rates indicate that the market's speculative bubble is limited, and the risk of sharp corrections triggered by leverage is relatively low. As a result, volatility has remained low in this cycle, and the likelihood of significant fluctuations in the short term is minimal.
The structure of the Bitcoin market is evolving, with long-term capital gradually replacing short-term speculation as the dominant driving force.
10x Research: The Holdings of Long-Term Holders Are Still Rising, the Cycle Is Not Over
On-chain data analysis shows that in 2025, Bitcoin's "OG" wallets—those belonging to early investors, miners, and established exchanges—have been continuously distributing Bitcoin. This is not a panic sell-off but a planned and rhythmic asset rotation, with Bitcoin steadily flowing to high-net-worth individuals, hedge funds, and corporate treasuries like MicroStrategy. Meanwhile, the amount of Bitcoin held on trading platforms remains low, and market volatility is being suppressed. This round is not characterized by the rapid rise driven by retail impulse seen in 2017 or 2021.
This market trend is slow, strategic, and institutionally driven. As long as large holders can continue to absorb selling pressure, there is still room for Bitcoin to rise. Historical patterns of Bitcoin indicate that the real risk is not when long-term holders start selling, but when they stop selling. That is when demand begins to weaken, absorption fails, and early investors are forced to revert to being "passive holders." We saw this situation in March 2024 and again in January 2025. Both signals were clear—we also turned bearish at that time.
Now, the holdings of long-term holders are still rising, indicating that this cycle has not yet ended. We accurately predicted Bitcoin breaking through $84,500, then rising to $95,000 and $106,000. Our next target is $122,000, and this judgment is still based on our analysis models of macro cycles and behavioral capital flows, which have successfully identified significant turning points multiple times.
QCP: Further FOMO After New Highs
The yield on 30-year Japanese government bonds (JGB) has surpassed 3%, breaking historical thresholds. Japan's ever-expanding debt problem has long been a potential concern and is now approaching a critical point. If this wave of bond selling continues and fiscal worries escalate, the market's reassessment of Japanese risk may drive the yen to appreciate in the short term. The turbulence in the Japanese market has already begun to affect global markets. The yield on 30-year U.S. government bonds has also broken above 5%, and investors are turning their attention to the U.S. debt trajectory.
Meanwhile, Bitcoin attempted to break through the $108,000 mark today but failed to maintain momentum. The current price trend is closely related to the increased holdings from Strategy and Metaplanet, which remain the primary sources of buying pressure. However, there are growing concerns that they may represent the last wave of "marginal buyers." If their purchasing slows down, it could trigger other investors to take profits, reversing the current upward trend.
Despite facing ongoing macro headwinds, including soaring bond yields, escalating tariffs, and potential stagflation risks in the U.S. in the third and fourth quarters of 2024, Bitcoin has shown remarkable resilience over the past month. That said, once the price successfully breaks through historical highs, it could trigger a new wave of FOMO, drawing sidelined capital into the market and further pushing up the price.
免责声明:本文章仅代表作者个人观点,不代表本平台的立场和观点。本文章仅供信息分享,不构成对任何人的任何投资建议。用户与作者之间的任何争议,与本平台无关。如网页中刊载的文章或图片涉及侵权,请提供相关的权利证明和身份证明发送邮件到support@aicoin.com,本平台相关工作人员将会进行核查。


