Original Title: "As Summer Approaches, the 'Star Map' on the BTC Chain is Drawn: Cost Line as the Base, HODLers as the Anchor, Where is the Bull Market Ship Heading? | WTR 5.19"
Original Source: WTR Research Institute
Weekly Review
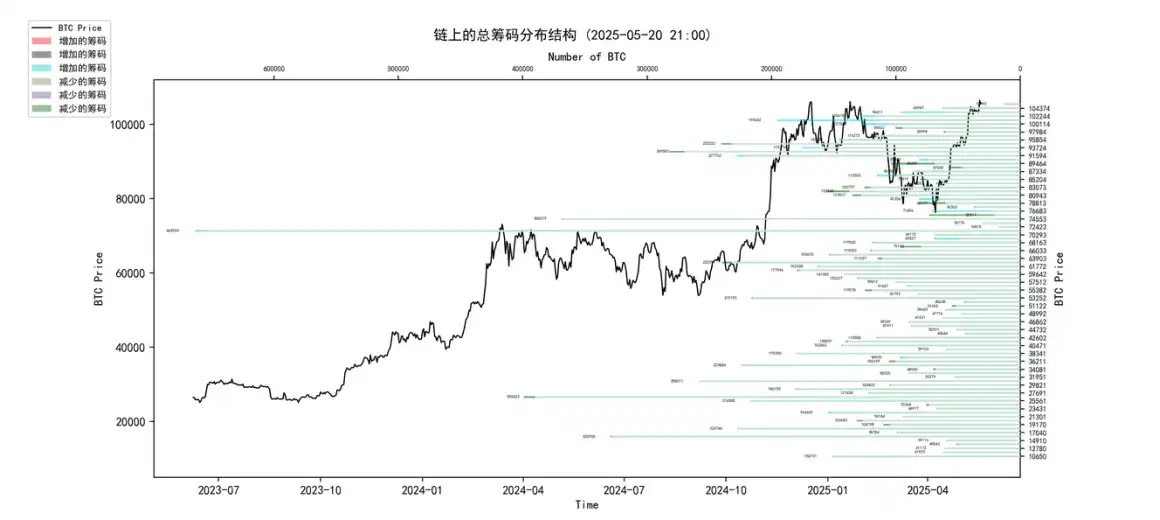
From May 12 to May 19 this week, the highest price of the ice sugar orange was around $107,108, and the lowest was close to $100,718, with a fluctuation range of about 6.34%. Observing the chip distribution chart, there is a large amount of chip transactions around 93,000, which will provide certain support or pressure.
• Analysis:
60,000-68,000 approximately 1.15 million coins;
76,000-89,000 approximately 1.08 million coins;
90,000-100,000 approximately 1.52 million coins;
• The probability of not breaking below 95,000~100,000 in the short term is 80%.
Important News
Economic News
- U.S. Sovereign Credit Rating Downgrade:
◦ Moody's downgraded the U.S. sovereign credit rating from Aaa to Aa1, with the outlook adjusted to "stable." (This is the latest downgrade.)
◦ Review: S&P downgraded the U.S. rating from AAA to AA+ in 2011. Fitch downgraded the U.S. rating from AAA to AA+ in August 2023, with a "stable" outlook (Fitch had placed the U.S. AAA rating on "negative watch" on May 24, 2023).
◦ Currently: The U.S. has lost all AAA top ratings from the three major credit rating agencies. ◦ Reason for downgrade (Moody's): The U.S. government's debt and interest payment ratio continues to rise, with the fiscal deficit expected to approach 9% of GDP by 2035.
◦ Federal Reserve officials' reactions:
▪ Federal Reserve Vice Chair: Moody's downgrade will be considered ordinary data in policy-making.
▪ Federal Reserve Bostic: Moody's downgrade of the U.S. rating will affect the entire economy and financial markets, impacting the cost of capital, and will observe the impact of the downgrade on U.S. Treasury demand.
▪ Federal Reserve Williams: Inflation has been slowly and gradually declining, tariffs may push up inflation and the U.S. unemployment rate, and the outlook will become clearer after June and July.
- U.S. Inflation and Monetary Policy Expectations:
◦ Federal Reserve officials (Williams/Waller): Inflation is slowly declining, the economy may slow down this year, and the Federal Reserve can remain calm in monetary policy decisions.
◦ Arthur Hayes (co-founder of BitMEX, also comments on macro): The 10-year U.S. Treasury yield has soared, and the Federal Reserve has been "reminded" that if it spreads to the MOVE volatility index, the printing press is expected to start.
◦ Trump comments: The general consensus in the market is that the Federal Reserve should cut interest rates, but Powell, who is already a step late, is likely to mess it up again.
◦ Comprehensive analysis: Factors such as Moody's downgrade, U.S. Treasury depreciation, tariff pressure, and economic slowdown, if U.S. inflation continues to maintain the current trend in May, June, and July (April U.S. CPI 2.3%), may be interpreted as a driving force for market trends. (That is, the market expects the Federal Reserve may turn to easing as a result.)
- U.S. Politics and Finance:
◦ The U.S. House of Representatives' subcommittee approved Trump's tax cut bill, preparing for a possible vote this week. Last Thursday, Trump's comprehensive tax bill encountered obstacles in Congress.
◦ The Washington Post reported: Media or photography equipment is not allowed at the TRUMP dinner held on May 22.
- U.S. Bond Market Performance:
◦ U.S. Treasuries: Depreciated, with the 10-year U.S. Treasury yield rising to 4.5%, and the 30-year U.S. Treasury yield rising to 5%.
- International Financial Cooperation and Innovation:
◦ The Federal Reserve Bank of New York and the Bank for International Settlements (BIS) jointly released a research report, Project Pine, testing the feasibility of implementing monetary policy using smart contracts in tokenized financial markets.
◦ The report points out that smart contracts have the ability to quickly deploy and adjust monetary policy tools, providing flexibility and efficiency for future central bank policy execution in tokenized financial systems, but also emphasizes the need to pay attention to interoperability, data standards, and potential operational risks.
Cryptocurrency Ecosystem News
- U.S. Cryptocurrency Legislation and Regulatory Dynamics:
◦ Stablecoin Legislation "GENIUS Act":
▪ U.S. Senators Bill Hagerty and Kirsten Gillibrand stated that the legislation regulating stablecoin issuers, the "GENIUS Act," may enter the debate and approval stage this week.
▪ Bo Hines, Executive Director of the U.S. Presidential Advisory Council on Digital Assets, stated that the purpose of the "GENIUS Act" is to safeguard the future of U.S. finance, modernize the outdated U.S. payment system, and that digital asset technology represents the next generation of financial systems, with the U.S. ready for this transformation.
◦ SEC Dynamics:
▪ The U.S. Securities and Exchange Commission (SEC) released FAQs related to cryptocurrency asset activities and distributed ledger technology, covering broker-dealer custody rules, physical purchases of crypto spot ETFs, net capital treatment of BTC and ETH, and rules for passing through securities by agents.
◦ Texas BTC Reserve Bill:
▪ The Texas Strategic BTC Reserve Bill (SB 21) will undergo a second reading in the House on May 20, which is a necessary step before the final vote. If the bill passes the full House vote before the Texas legislative session on June 2, it will be submitted to the governor for signing.
- Cryptocurrency Market Performance and Analyst Views:
◦ Analyst Daan Crypto Trades: Recently, there has been a consistent indication of a CB (Coinbase) spot premium, which is a good sign showing solid demand.
◦ Arthur Hayes' view: The altcoin season needs to wait for BTC to break through $110,000 and continue to rise to the $150,000-$200,000 range, which is expected to occur in the summer or early third quarter of this year, after which it will start to rotate into various altcoins.
◦ CryptoQuant report: ETH/BTC has dropped to a historically rare range, and historically, whenever this indicator reaches similar low levels, ETH has achieved significant increases. Currently, ETH/BTC has rebounded significantly, indicating that investors are betting that the market has bottomed out, and the altcoin season may arrive soon.
◦ Analyst Apsk32's view: BTC usually follows gold's rise a few months later, and as gold rises to a new high of $3,500 per ounce, if BTC continues along the momentum curve and gold maintains its current price, while BTC price returns to the leading support of the five-year track, the target price for BTC in 2025 may be around $220,000.
◦ Matrixport report: As the phase of downward risk eases, the upward path for BTC becomes clearer, and risk assets, especially BTC, are expected to welcome a favorable window before July, coinciding with the end of the 90-day tariff suspension agreement and the start of the second-quarter earnings season. Another important catalyst is the initiation of the debt repayment process by FTX around May 30, targeting accounts with debt amounts exceeding $50,000, with an expected issuance of about $5 billion in stablecoins, which may drive market momentum in June, and the trend is expected to continue into the summer.
◦ Overall market sentiment: "Bitcoin is firmly holding near historical highs waiting for a catalyst, and Ethereum is not weak either."
- Cryptocurrency ETFs and Fund Flows:
◦ Last week: The U.S. BTC spot ETF accumulated inflows of $608 million, and the U.S. ETH spot ETF accumulated inflows of $41.8 million.
◦ DeFiLlama data: The total market value of stablecoins reached $24.3838 billion, with a growth of 0.45% over the past 7 days.
- Institutional and Large Holder Position Dynamics:
◦ MicroStrategy (Strategy): Increased holdings by 7,390 BTC from May 12 to May 18, at a price of $103,498, totaling $764.9 million.
◦ Metaplanet: Increased holdings by 1,004 BTC, with a total holding of 7,800 BTC.
◦ Salvador: Increased holdings by 31 BTC in the past 30 days, with a total holding of 6,180.18 BTC.
Long-term Insights: Used to observe our long-term situation; bull market/bear market/structural changes/neutral state
Mid-term Exploration: Used to analyze what stage we are currently in, how long this stage will last, and what situations we will face
Short-term Observation: Used to analyze short-term market conditions; and the possibility of certain events occurring in a certain direction under certain premises
Long-term Insights
• Non-liquid long-term whales
• Total risk ratio of BTC spot sellers
• Fund flows of BTC U.S. spot ETFs
• Large inflows and outflows of trading platforms
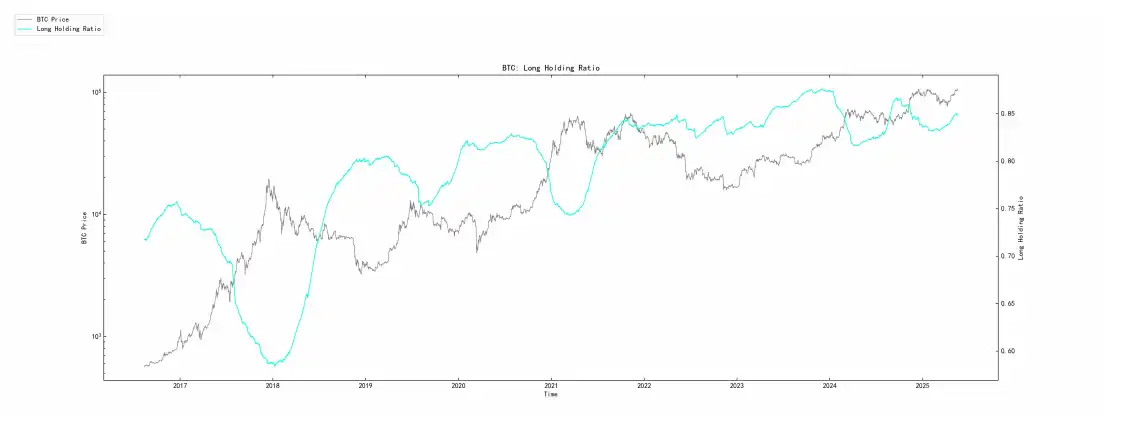
(The following image shows non-liquid long-term whales)
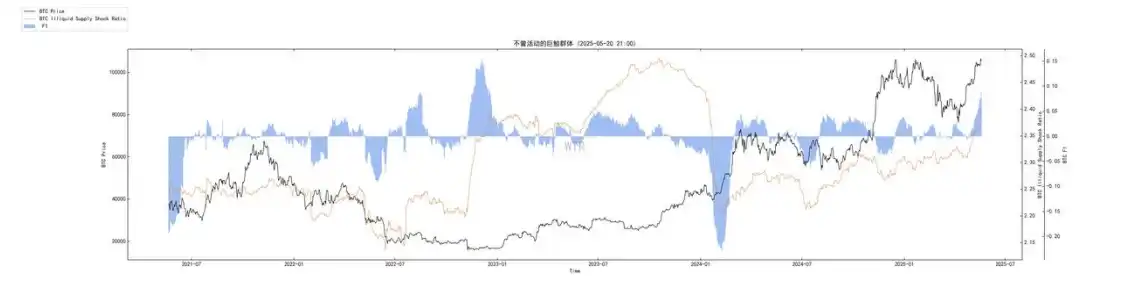
Recently, it has remained at a relatively high level, and the latest data shows a further upward trend. This indicates that the BTC held for the long term and not easily liquidated (long-term whales) are steadily increasing, HODLer confidence remains strong, and the potential selling pressure is relatively small. Non-liquid long-term whales are synchronized with moderate price increases, indicating healthy support and upward momentum.
(The following image shows the total risk ratio of BTC spot sellers)
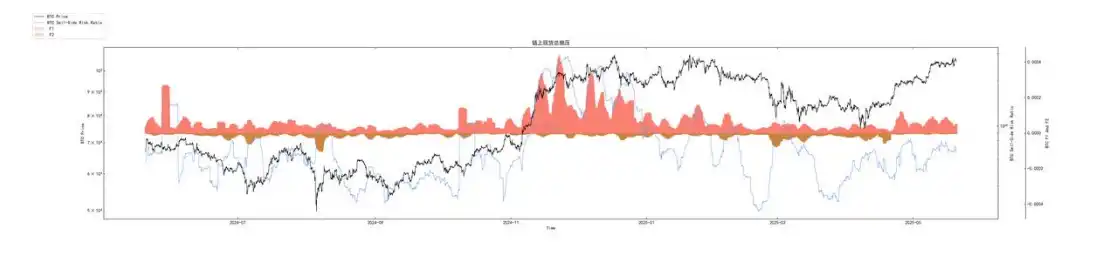
This ratio is currently at a relatively moderate level. Although it has risen somewhat with the price increase, it is far from reaching the high-risk area seen at historical bull market peaks. This indicates that the current market's rise is not dominated by excessive leverage or short-term speculative frenzy, and the profit-taking pressure is relatively controllable.
(The following image shows the fund flows of BTC U.S. spot ETFs)
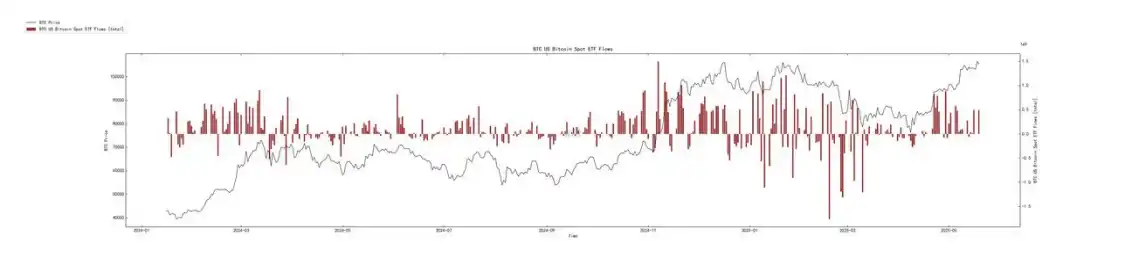
After experiencing a period of capital inflow volatility and even brief outflows, the far right shows that ETF fund net inflows have recovered and maintained a positive trend. Although the daily inflow may not reach the initial peak, the sustained net inflow indicates that capital from traditional financial markets is still actively and steadily allocating BTC. The price maintains a strong positive correlation with ETF fund flows, and the recent steady price recovery is synchronized with the continuous net inflow of ETF funds.
(The following image shows the net inflow and outflow of large trading platforms)
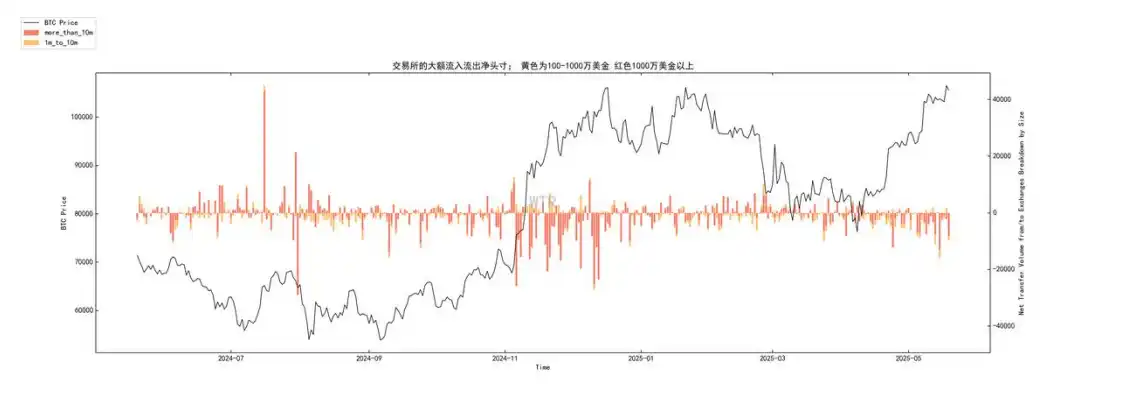
• Red bars (>10 million USD): After the price rose to a high level, although there were occasional intermittent net inflows (possibly representing some large holders' risk management or slight cashing out), there has not been a sustained trend of large-scale BTC transfers into trading platforms. In recent days, there has even been a slight net outflow or a balanced state.
• Orange bars (1-10 million USD): The performance is more mixed, but overall, there are no signs of panic selling or large-scale concentrated selling. Overall, the selling pressure from large addresses is relatively controllable, and there has not been a sustained selling pressure. On the contrary, the recent balance or slight net outflow indicates a reluctance to sell and potential accumulation behavior. During the price increase, the pressure from large net inflows into trading platforms is not significant, providing a good environment for further price support.
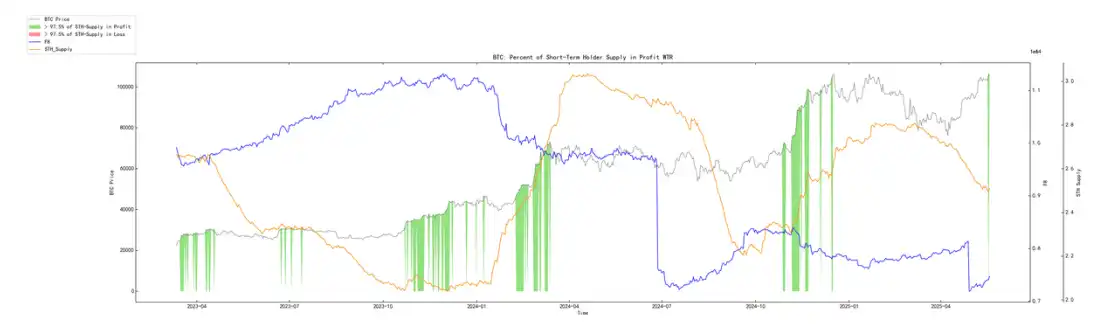
(The following image shows the cost realized by short-term holders)
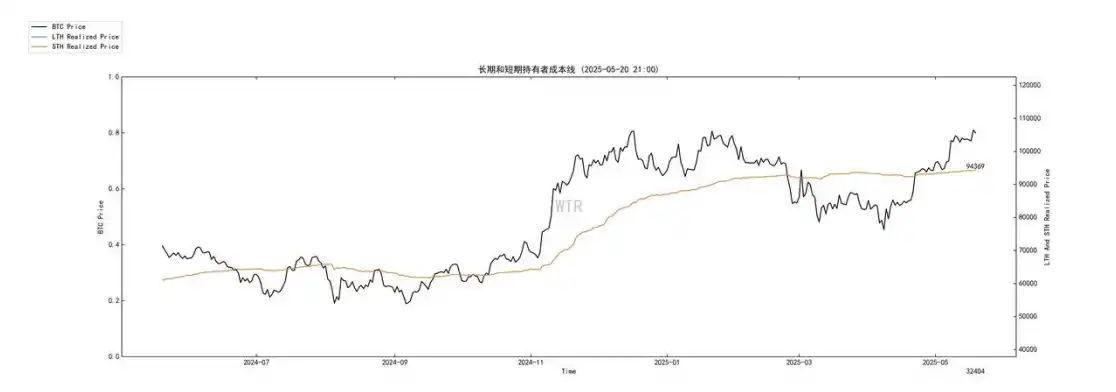
The cost line for short-term speculators (approximately $94,345, estimated from the chart) continues to rise slowly, indicating that the average holding cost for long-term holders is constantly increasing, which typically occurs in a bull market, where new long-term holders enter at higher prices. The current BTC price is far above the STH cost line. • BTC price > STH cost > LTH cost: This is a very typical bull market structure.
• The price is far above the STH cost: This indicates that short-term holders are currently in a significant profit state, which is one of the sources of their confidence to continue holding.
Analysis Combining News and On-Chain Data
- Starting Point: Easing Expectations Under Macroeconomic Uncertainty + Gradual Clarity in Regulation (News & Chart Three)
◦ News: The downgrade of the U.S. sovereign credit rating has raised concerns about the long-term credit of the dollar, and the market expects this may force the Federal Reserve to adopt a more accommodative monetary policy in the future (Arthur Hayes' "printing press" argument). At the same time, regulatory progress such as the stablecoin bill brings positive expectations to the market.
◦ Chart Three (ETF): The continuous net inflow of ETF funds is a direct response to macro expectations and positive regulatory signals, indicating that traditional capital is still entering the market.
◦ Analysis: The "bad news" on the macro level (credit risk) is interpreted by the market as "good news" for crypto assets (demand for hedging + easing expectations). The gradual clarity of regulation reduces uncertainty and enhances confidence in capital inflows.
- Support: HODLer Confidence Soars and Supply Continues to Tighten (Chart One & Chart Five)
◦ Chart One (Non-liquid Long-term Whales): The increasing non-liquid supply indicates that HODLers are not only not selling in large quantities at the current price level but are also showing strong reluctance to sell, even increasing their holdings, leading to a further reduction in the actual tradable BTC supply in the market.
◦ Chart Five (Short-term Speculator Cost): The BTC price is far above the average cost of long-term and short-term holders, meaning that the vast majority of market participants are in a profit state. In particular, the significant profits of long-term holders are an important basis for their firm holding. The STH cost line serves as a key bull market support, currently far behind.
◦ News: Institutions like MicroStrategy continue to increase their BTC holdings, confirming the optimism of long-term holders and smart capital.
◦ Analysis: Strong HODLing behavior + widespread profit state + supply shock effect leads to minimal market selling pressure, providing extremely strong support for prices.
- Verification: Large Holder Behavior is Stable and Market Risks are Controllable (Chart Two & Chart Four)
◦ Chart Four (Net Flow of Large Trading Platforms): There are no signs of sustained net inflows (selling) from large addresses on trading platforms; instead, there are occasional net outflows (accumulation or transfers to cold wallets), indicating that large holders remain optimistic about the future and are not in a hurry to cash out.
◦ Chart Two (Spot Seller Risk Ratio): The spot seller risk ratio is at a moderate level, indicating that although market sentiment is positive, it has not yet reached a level of frenzy or overheating, and short-term profit-taking pressure is not significant.
◦ Chart One (Non-liquid Long-term Whales): Also confirms that the market has not yet entered the frenzied phase of a bull market top (at least they haven't sold).
◦ Analysis: The stability of large holder behavior and the overall controllability of market risks provide a healthy internal environment for further price increases.
- Progression: Breakthrough Expectations and Rotation Potential (News)
◦ News: Analysts are generally optimistic about BTC breaking historical highs (Arthur Hayes' targets of $110,000, $150,000-$200,000) and expect that capital will rotate into altcoins afterward (the rebound in the ETH/BTC exchange rate is a signal). Short-term liquidity injection events such as FTX compensation are seen as potential catalysts.
◦ On-Chain Correlation: Currently, all on-chain indicators point to a healthy, poised bull market structure. Once BTC breaks upward, given its supply scarcity and strong buying support, it may quickly attract more attention and capital.
◦ Analysis: On-chain data provides a solid foundation for the optimistic expectations in the news. BTC is "waiting for a catalyst" to complete the final step, after which the rotation logic of altcoins is expected to be activated.
Future Outlook:
• Short to Mid-term Outlook:
◦ BTC has a considerable probability of continuing to rise and challenge/break historical highs: All on-chain indicators (non-liquid supply, LTH/STH costs far below current prices, moderate seller risk, continuous ETF inflows, and no significant selling pressure from large holders) support this judgment. The expected easing policies and favorable regulations in the news will be key catalysts.
◦ The STH cost line (approximately $94,369) is an important short-term support: Even if a pullback occurs, as long as it does not effectively break below this line, the short-term upward trend is expected to remain unchanged.
◦ Conditions for the start of the altcoin season are becoming increasingly mature: Once BTC effectively breaks through and stabilizes, the capital overflow effect will significantly increase. The performance of the ETH/BTC exchange rate will be an important directional indicator. FTX compensation (if it occurs as expected) may become the spark that ignites enthusiasm for altcoins.
◦ Attention Variables: Whether macro data (such as inflation, employment) supports easing expectations; the actual implementation of regulatory bills; whether ETF fund inflows can continue.
• Mid to Long-term Outlook:
◦ The certainty of the deep development of the bull market is increasing: The current on-chain structure (especially the STH cost shown in Chart Five being far below the current price) is a typical healthy characteristic of a mid-term bull market, indicating greater upward potential. The increase in non-liquid long-term whales also supports this judgment.
◦ The STH cost line (approximately $94,345) is the "lifeline" of this bull market: As long as the price can continue to stay above it and drive it to rise steadily, the bull market structure remains solid.
◦ Target Price and Risks: Analysts predict that BTC will exceed $200,000 by the end of the year or in 2025, which, supported by current on-chain data and macro expectations, is not a fantasy (though the current probability is still low). However, as prices continue to rise, it is necessary to closely monitor the long-term whales in Chart One and the spot seller risk ratio in Chart Two; if they quickly approach or enter historically high-risk areas, it would indicate a sharp accumulation of market risks, significantly increasing the pressure for a pullback.
◦ Long-term Drivers: The actual degree of monetary policy easing in the U.S., global demand for hedging against inflation and sovereign credit risks, and the improvement of the cryptocurrency regulatory framework will be the core factors determining the height and duration of this bull market.
Mid-term Exploration
• Long-term Participant Supply Ratio
• Liquidity Supply Volume
• Whale Trading Platform Net Positions
• ETH Trading Platform Circulation Ratio
• Short-term Profit Structure Composite Model
(The following image shows the long-term participant supply ratio)
The long-term supply chips in the market are gradually compressing the selling space of short-term chips, currently showing a large amount of support. From the current basic situation, an increase in long-term chips will make market pricing more stable. Of course, the premise is that short-term supply can be well supplemented. Overall, the compression of long-term supply may reduce the number of short-term chips available for sale in the market. Factors driving pricing may require some updated supply.
(The following image shows the liquidity supply volume)
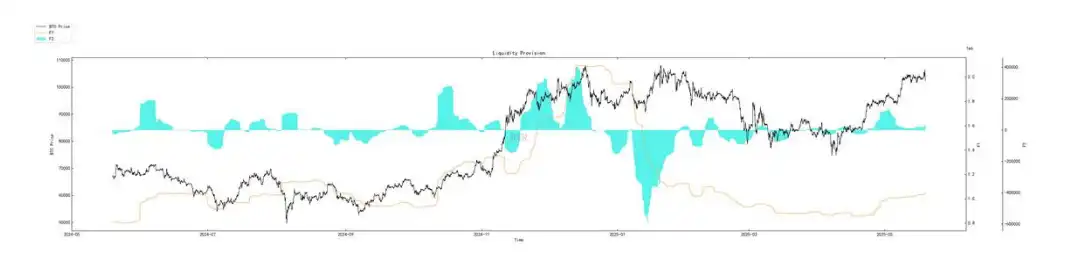
Currently, the liquidity supply volume is still in a healthy state, and the market may also have some new supply support. The current pricing in the market is likely to hover in a stable area.
(The following image shows the net positions of whales on trading platforms)
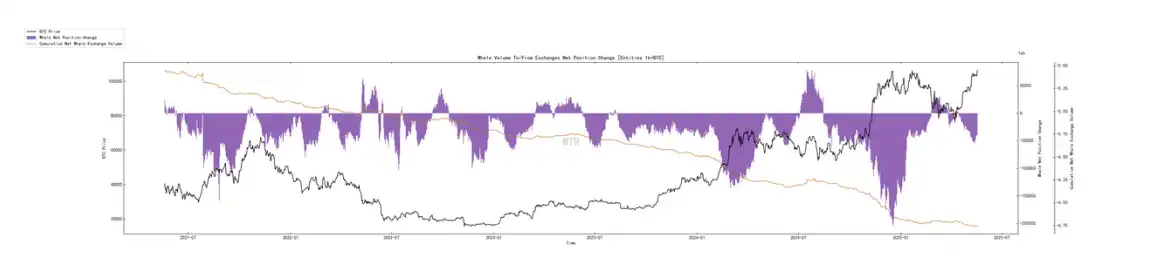
Whales are continuously accumulating the chips in their hands. This group has not shown signs of a trend shift towards "selling on trading platforms." Currently, it still appears to be a weak accumulation structure.
(The following image shows the circulation ratio of ETH on trading platforms)
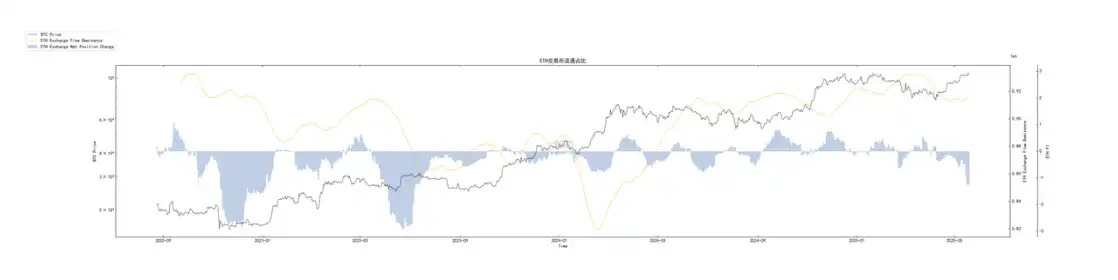
The circulation ratio of ETH on centralized trading platforms is decreasing. Even when BTC is at a high price, the market still tends to seek stability rather than aggressively participating in high-risk projects. Currently, the market is mainly hoarding BTC, and under this structure, BTC pricing is likely to remain stable, while altcoin projects may face a siphoning effect from BTC, resulting in a phase decline due to the inability to obtain the liquidity overflow from BTC.
(The following image shows the short-term profit structure composite model)
BTC is currently in a phase of profit overflow from short-term supply, which may lead to profit-taking selling pressure, causing the market to encounter upward resistance.
Short-term Observation
• Derivative Risk Coefficient
• Options Intent Transaction Ratio
• Derivative Trading Volume
• Options Implied Volatility
• Profit and Loss Transfer Volume
• New Addresses and Active Addresses
• Ice Sugar Orange Trading Platform Net Positions
• Auntie Tai Trading Platform Net Positions
• High-weight Selling Pressure
• Global Purchasing Power Status
• Stablecoin Trading Platform Net Positions
• Off-chain Trading Platform Data
Derivative Rating: Risk coefficient is in the red zone, indicating high derivative risk.
(The following image shows the derivative risk coefficient)
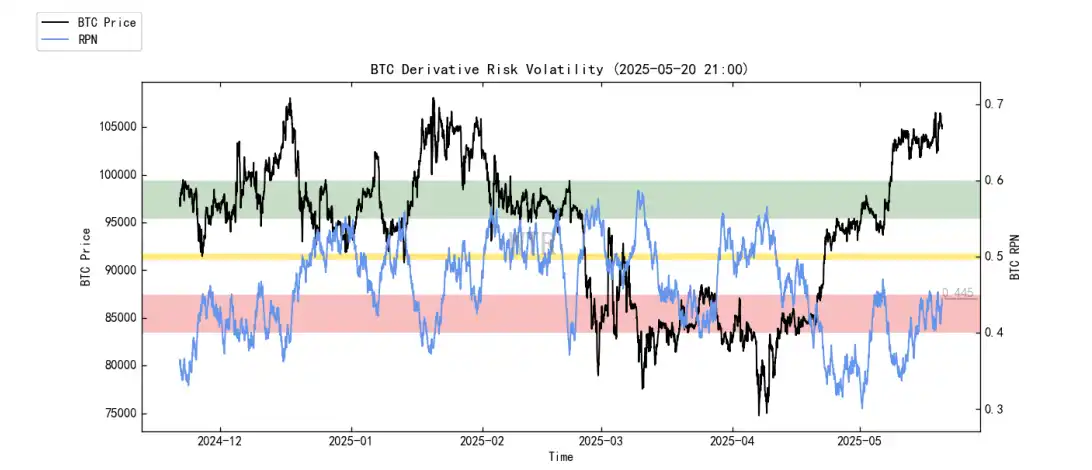
The risk coefficient has been oscillating in the red zone for a week, and there has been no liquidation of either shorts or longs. It remains in the red zone, and significant volatility is expected in the derivatives market this week, leading to liquidations for derivatives participants.
(The following image shows the options intent transaction ratio)
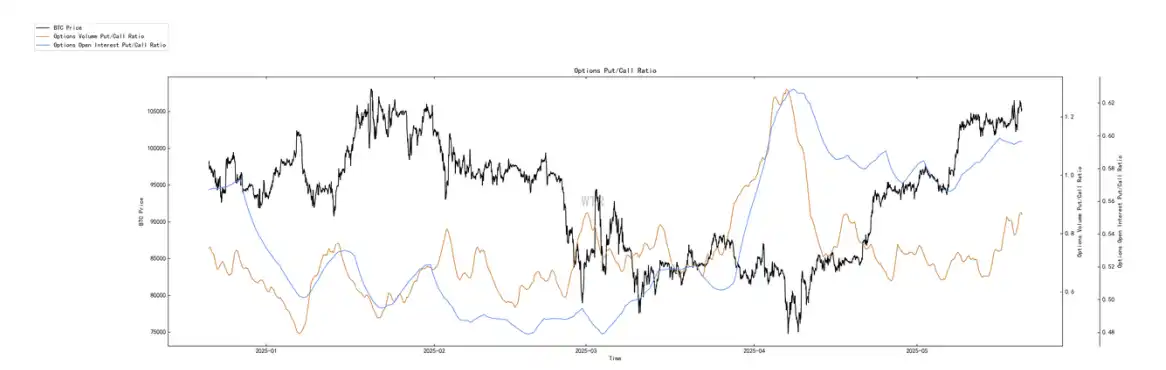
The proportion of put options has slightly increased, with a moderate increase in trading volume.
(The following image shows the derivatives trading volume)
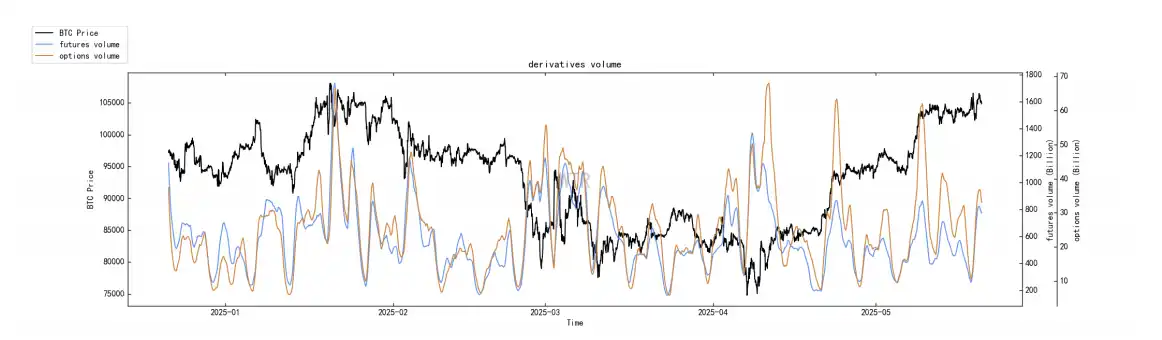
The derivatives trading volume is at a median level.
(The following image shows the options implied volatility)
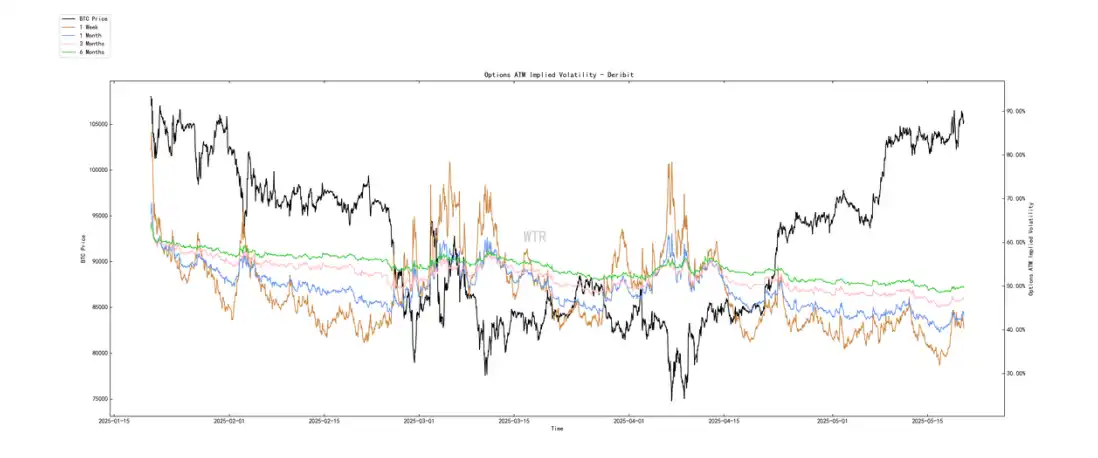
The options implied volatility has only shown low fluctuations in the short term.
Sentiment state rating: Neutral
(The following image shows the profit and loss transfer volume)
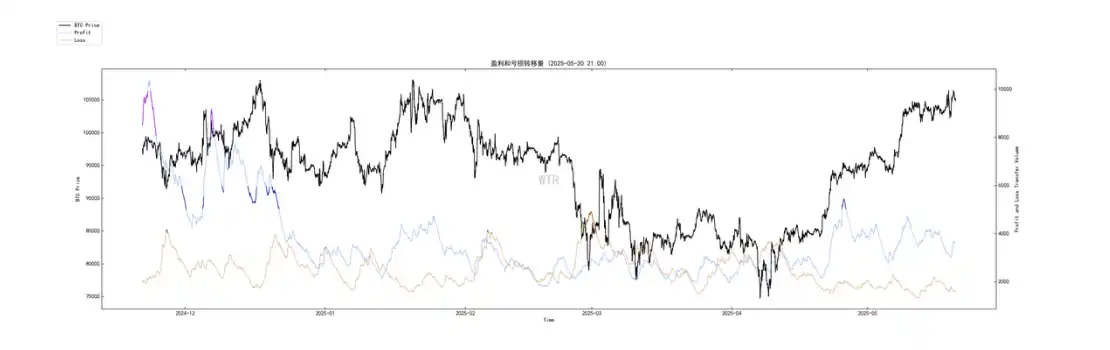
Although prices are gradually rising, the market's positive sentiment (blue line) has been in a "divergent" state with BTC prices. This may have no impact on prices in the short term, but it is not a good phenomenon in the medium term.
(The following image shows new addresses and active addresses)
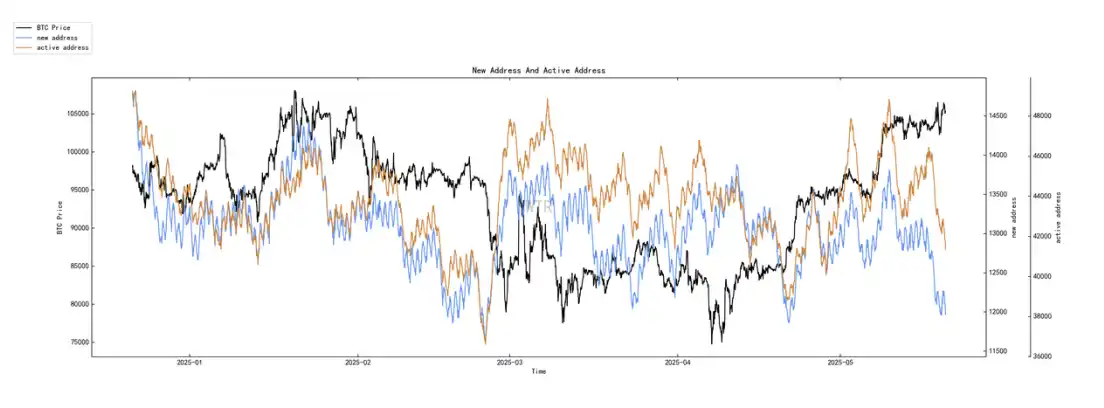
New active addresses are at a low level.
Spot and selling pressure structure rating: BTC and ETH are in a state of continuous large outflows.
(The following image shows the net positions on the Pionex trading platform)
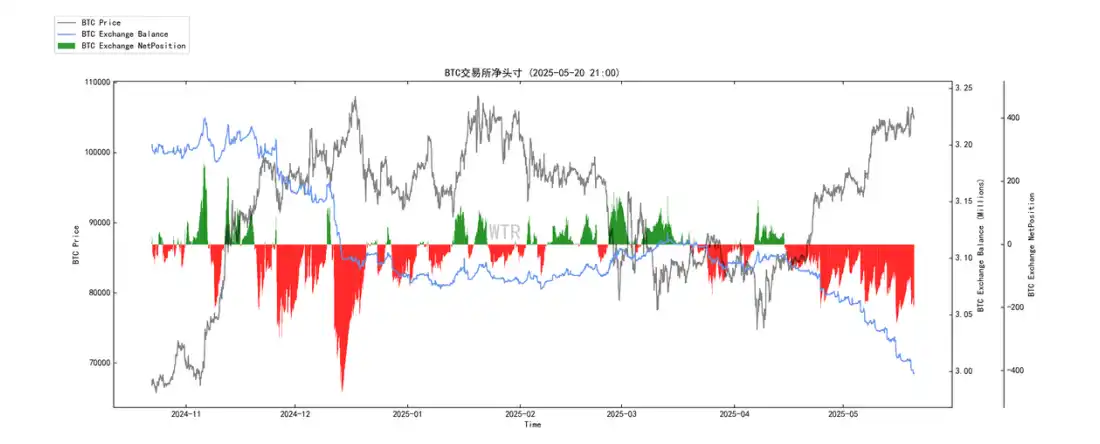
Currently, BTC is experiencing continuous large outflows.
(The following image shows the net positions on the Auntie Tai trading platform)
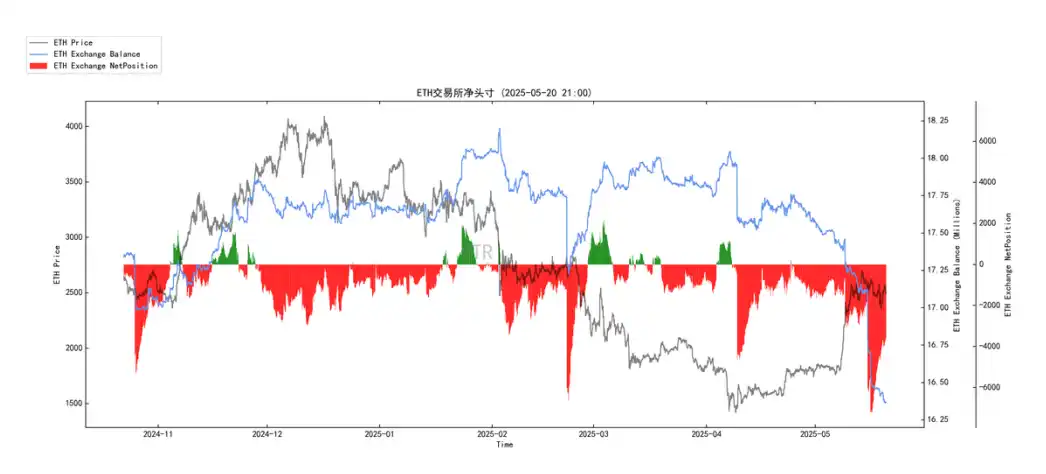
Currently, ETH is experiencing continuous large outflows.
(The following image shows high-weight selling pressure)
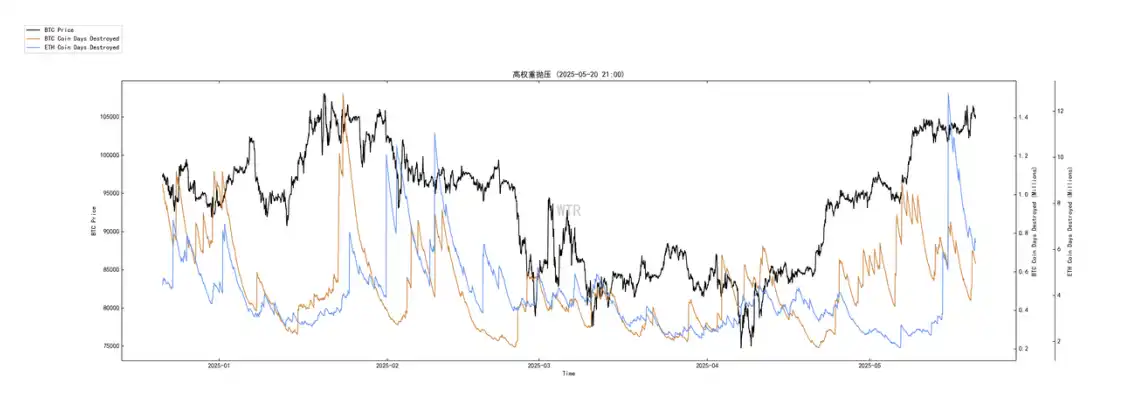
ETH has significant high-weight selling pressure, but it has currently eased.
Purchasing power rating: Global purchasing power has slightly rebounded compared to last week, while stablecoin purchasing power has slightly declined.
(The following image shows the global purchasing power status)
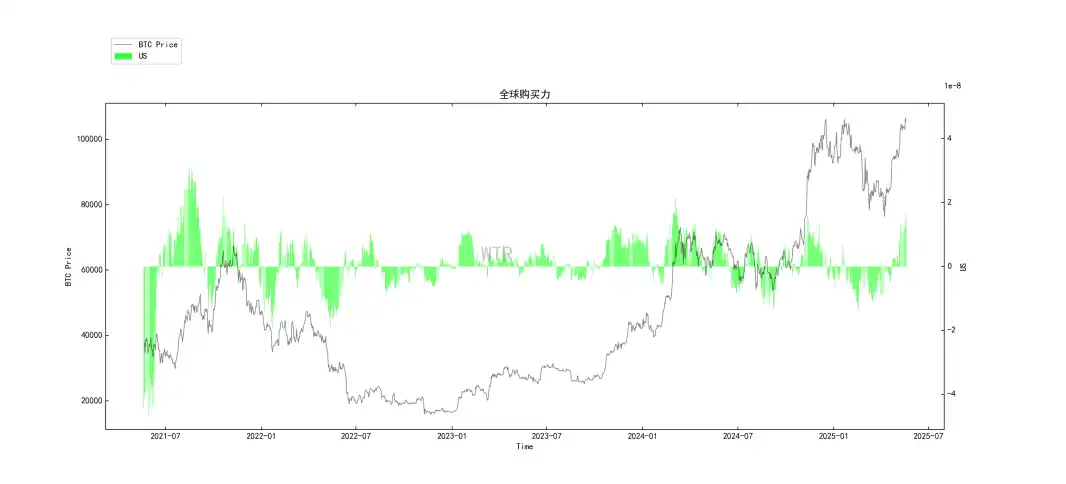
Global purchasing power has slightly rebounded compared to last week.
(The following image shows the net positions of USDT on trading platforms)
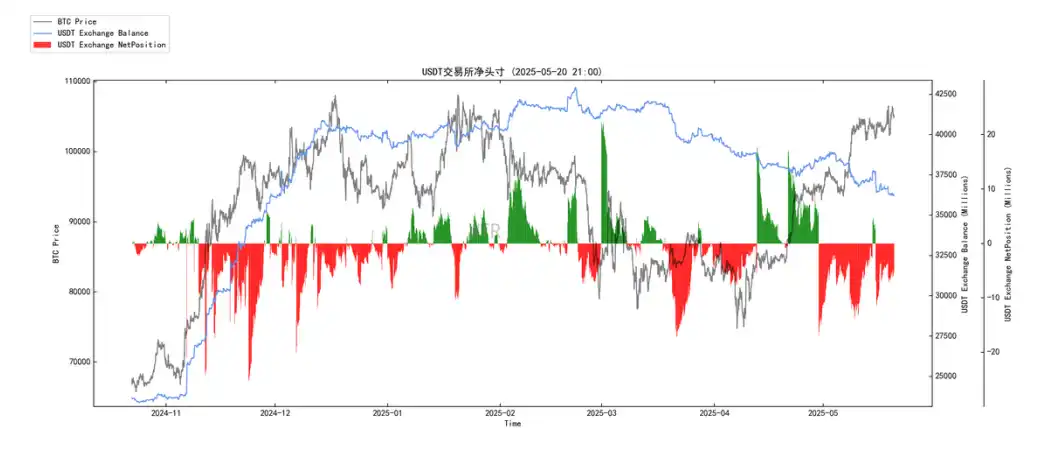
Stablecoin purchasing power has slightly declined.
Off-chain trading data rating: This week's data website is down, and there is currently no off-chain trading data.
Summary of This Week:
Analysis and Summary of News:
- Starting Point: Macroeconomic Pressure Forces Policy Shift Expectations
◦ The U.S. sovereign credit rating has completely lost its AAA status + ongoing debt and red pressure + potential economic slowdown signals. The market expects the Federal Reserve will be forced to adopt a more accommodative monetary policy in the future (possibly manifesting in the summer or later), despite cautious official statements in the short term.
- Transmission to the Crypto Market: Dual Benefits of Safe-Haven Attributes and Liquidity Expectations
◦ Expectations of long-term credit damage to the dollar may lead some funds to seek alternative value storage, bringing renewed attention to BTC's narrative as "digital gold."
◦ The market's expectations for future easing by the Federal Reserve and improved liquidity expectations are favorable for risk assets, with the crypto market benefiting as a high-beta asset.
- Positive Internal Factors in Crypto: Regulatory Clarity and Continuous Capital Inflows
◦ Legislative progress such as the stablecoin bill + clearer SEC operational guidelines reduce regulatory uncertainty and pave the way for institutional entry.
◦ Continuous capital inflow into BTC/ETH ETFs + institutional/national level accumulation provides real buying support for the market.
◦ Expectations of short-term liquidity injections such as FTX compensation further enhance market confidence.
- Market Sentiment and Capital Signals Resonating: Expectations for Breakthroughs and Rotations Heating Up
◦ Analysts are generally bullish + rebound in ETH/BTC exchange rate + high expectations for altcoin season, leading to positive market sentiment.
◦ BTC is consolidating near historical highs, waiting for a catalyst to complete the breakthrough. Once it breaks through, it may trigger capital rotation into ETH and other altcoins.
• Short to Mid-term Outlook:
◦ The core driving force of the "summer offensive" is the resonance of "easing expectations" and "regulatory clarity."
◦ BTC may attempt to break historical highs: Any dovish remarks or data from the Federal Reserve under macro pressure (such as inflation remaining below expectations) and positive regulatory developments (such as the passage of the stablecoin bill) could serve as catalysts for BTC's breakthrough. The path proposed by Arthur Hayes for BTC to break $110,000 and surge to $150,000-$200,000 is worth noting.
◦ Window for Altcoin Season to Start: If BTC successfully breaks through and stabilizes, the capital rotation effect is expected to manifest. The ETH/BTC exchange rate is a key observation indicator. The stablecoin compensation from FTX (if it occurs in June) may become one of the direct ignition points for the altcoin market. The favorable window period pointed out by Matrixport before July is also worth looking forward to.
◦ Risks: The Federal Reserve may adopt unexpectedly hawkish policies in the short term (though the likelihood is reduced, it cannot be completely ruled out), unexpected negative regulatory news, or a failed BTC breakthrough could lead to market pullbacks.
• Mid to Long-term Outlook:
◦ The actual direction of U.S. monetary policy is key: If the Federal Reserve indeed begins a rate-cutting cycle and resumes balance sheet expansion ("printing press starts"), it will provide continuous macro liquidity support for the crypto market.
◦ Gradual Maturity of the Regulatory Framework: As legislation such as the stablecoin bill is implemented, the U.S. crypto regulatory framework will become clearer, helping to attract larger traditional capital inflows. Central bank explorations like Project Pine into tokenized finance also indicate the direction of future financial system reforms.
◦ Long-term Value Narratives of BTC and ETH: BTC's value storage attribute as "digital gold" may be favored against the backdrop of exposure to sovereign credit risks. ETH, with its strong ecosystem and deflationary mechanism (if EIP-1559 continues to be effective), as well as potential ETF narratives (although the current approval of ETH ETFs was not directly mentioned, there was previous information), has the potential to outperform other assets (such as Arthur Hayes predicting ETH will surpass SOL) in the later stages of the bull market.
◦ Target Prices Given by Market Sentiment: Analysts' target prices for BTC by the end of the year or in 2025 ($220,000-$250,000) indicate optimistic expectations for the height of this bull market, but this requires continuous coordination of macro, regulatory, and internal market factors.
Core Logic:
Macroeconomic factors (U.S. credit risk exposure → easing policy expectations) + internal crypto factors (regulatory clarity → continuous capital inflows) enhance market confidence, resonating with safe-haven and speculative demand. BTC awaits a catalyst to break historical highs (if successful), leading to capital rotation and the start of the altcoin season, with summer market trends to look forward to. The depth of the mid to long-term bull market depends on the degree of macro liquidity release and the maturity of the regulatory framework. The current market is at a critical game point, where the "bad news" on the macro level (U.S. credit issues) may be interpreted by the market as "good news" for the crypto market (forcing easing). The positive internal factors provide a foundation for this optimistic expectation. Summer will be an important window to validate these expectations.
On-Chain Long-term Insights:
Macroeconomic pressure expectations for easing + gradual improvement in regulation with continuous ETF capital inflows;
Strengthening market confidence with continuous tightening of on-chain supply (HODLer reluctance to sell, increase in non-liquid long-term whales) and widespread profitability among market participants (prices far above LTH and STH costs);
Minimal selling pressure with stable large holder behavior, and controllable market risks, providing BTC with upward momentum;
Awaiting a catalyst to break new highs (if successful) to trigger altcoin season rotation;
Summer market trends are worth looking forward to, with the depth of the mid to long-term bull market depending on macro liquidity and regulatory maturity, while the STH cost line serves as a relatively short-term key reference.
• Market Tone: This round of on-chain data further strengthens the bullish logic of the market, especially the STH cost chart, which clearly shows the healthy structure and strong support of the current bull market. The market is, to some extent, fully prepared, only lacking the "east wind" (key catalyst).
On-Chain Mid-term Exploration:
The increase in long-term chip ratios compresses the short-term selling space, enhancing market support, requiring new supply to drive price breakthroughs.
Liquidity volume maintains a healthy level, with new supply continuously supporting, and current prices may continue to oscillate within a range.
Whales continue to accumulate at low levels but have not shown concentrated selling pressure; the market remains in a mild accumulation phase without forming a trend reversal.
The circulation of ETH on trading platforms is shrinking, with capital concentrating on BTC for safe-haven, while altcoins may face downward pressure from liquidity siphoning.
Short-term profit accumulation in BTC forms selling pressure, limiting the upward price space due to profit-taking demands.
• Market Tone:
Hesitant, oscillating
BTC maintains a central oscillation, with structural differentiation intensifying, and liquidity risks in altcoins needing caution.
On-Chain Short-term Observations:
The risk coefficient is in the red zone, indicating high derivative risk.
New active addresses are at a low level.
Market sentiment state rating: Neutral.
Net positions of BTC and ETH on trading platforms are in a state of continuous large outflows.
Global purchasing power has slightly rebounded compared to last week, while stablecoin purchasing power has slightly declined.
The probability of not breaking below the range of $95,000 to $100,000 in the short term is 80%;
• Market Tone: Currently, there are few chips choosing to take profits at the current price level, and purchasing power is sufficient to support. Although the market's positive sentiment and prices are in a "divergent" state, due to the accumulation in the derivatives market, rapid market volatility is imminent. This week's expectations are basically consistent with last week, with further short squeezes still possible, while the probability of a direct large pullback is low.
Risk Reminder: The above is all market discussion and exploration, and does not constitute directional opinions for investment; please approach with caution and guard against market black swan risks.
This article is from a submission and does not represent the views of BlockBeats.
免责声明:本文章仅代表作者个人观点,不代表本平台的立场和观点。本文章仅供信息分享,不构成对任何人的任何投资建议。用户与作者之间的任何争议,与本平台无关。如网页中刊载的文章或图片涉及侵权,请提供相关的权利证明和身份证明发送邮件到support@aicoin.com,本平台相关工作人员将会进行核查。


