Bitcoin
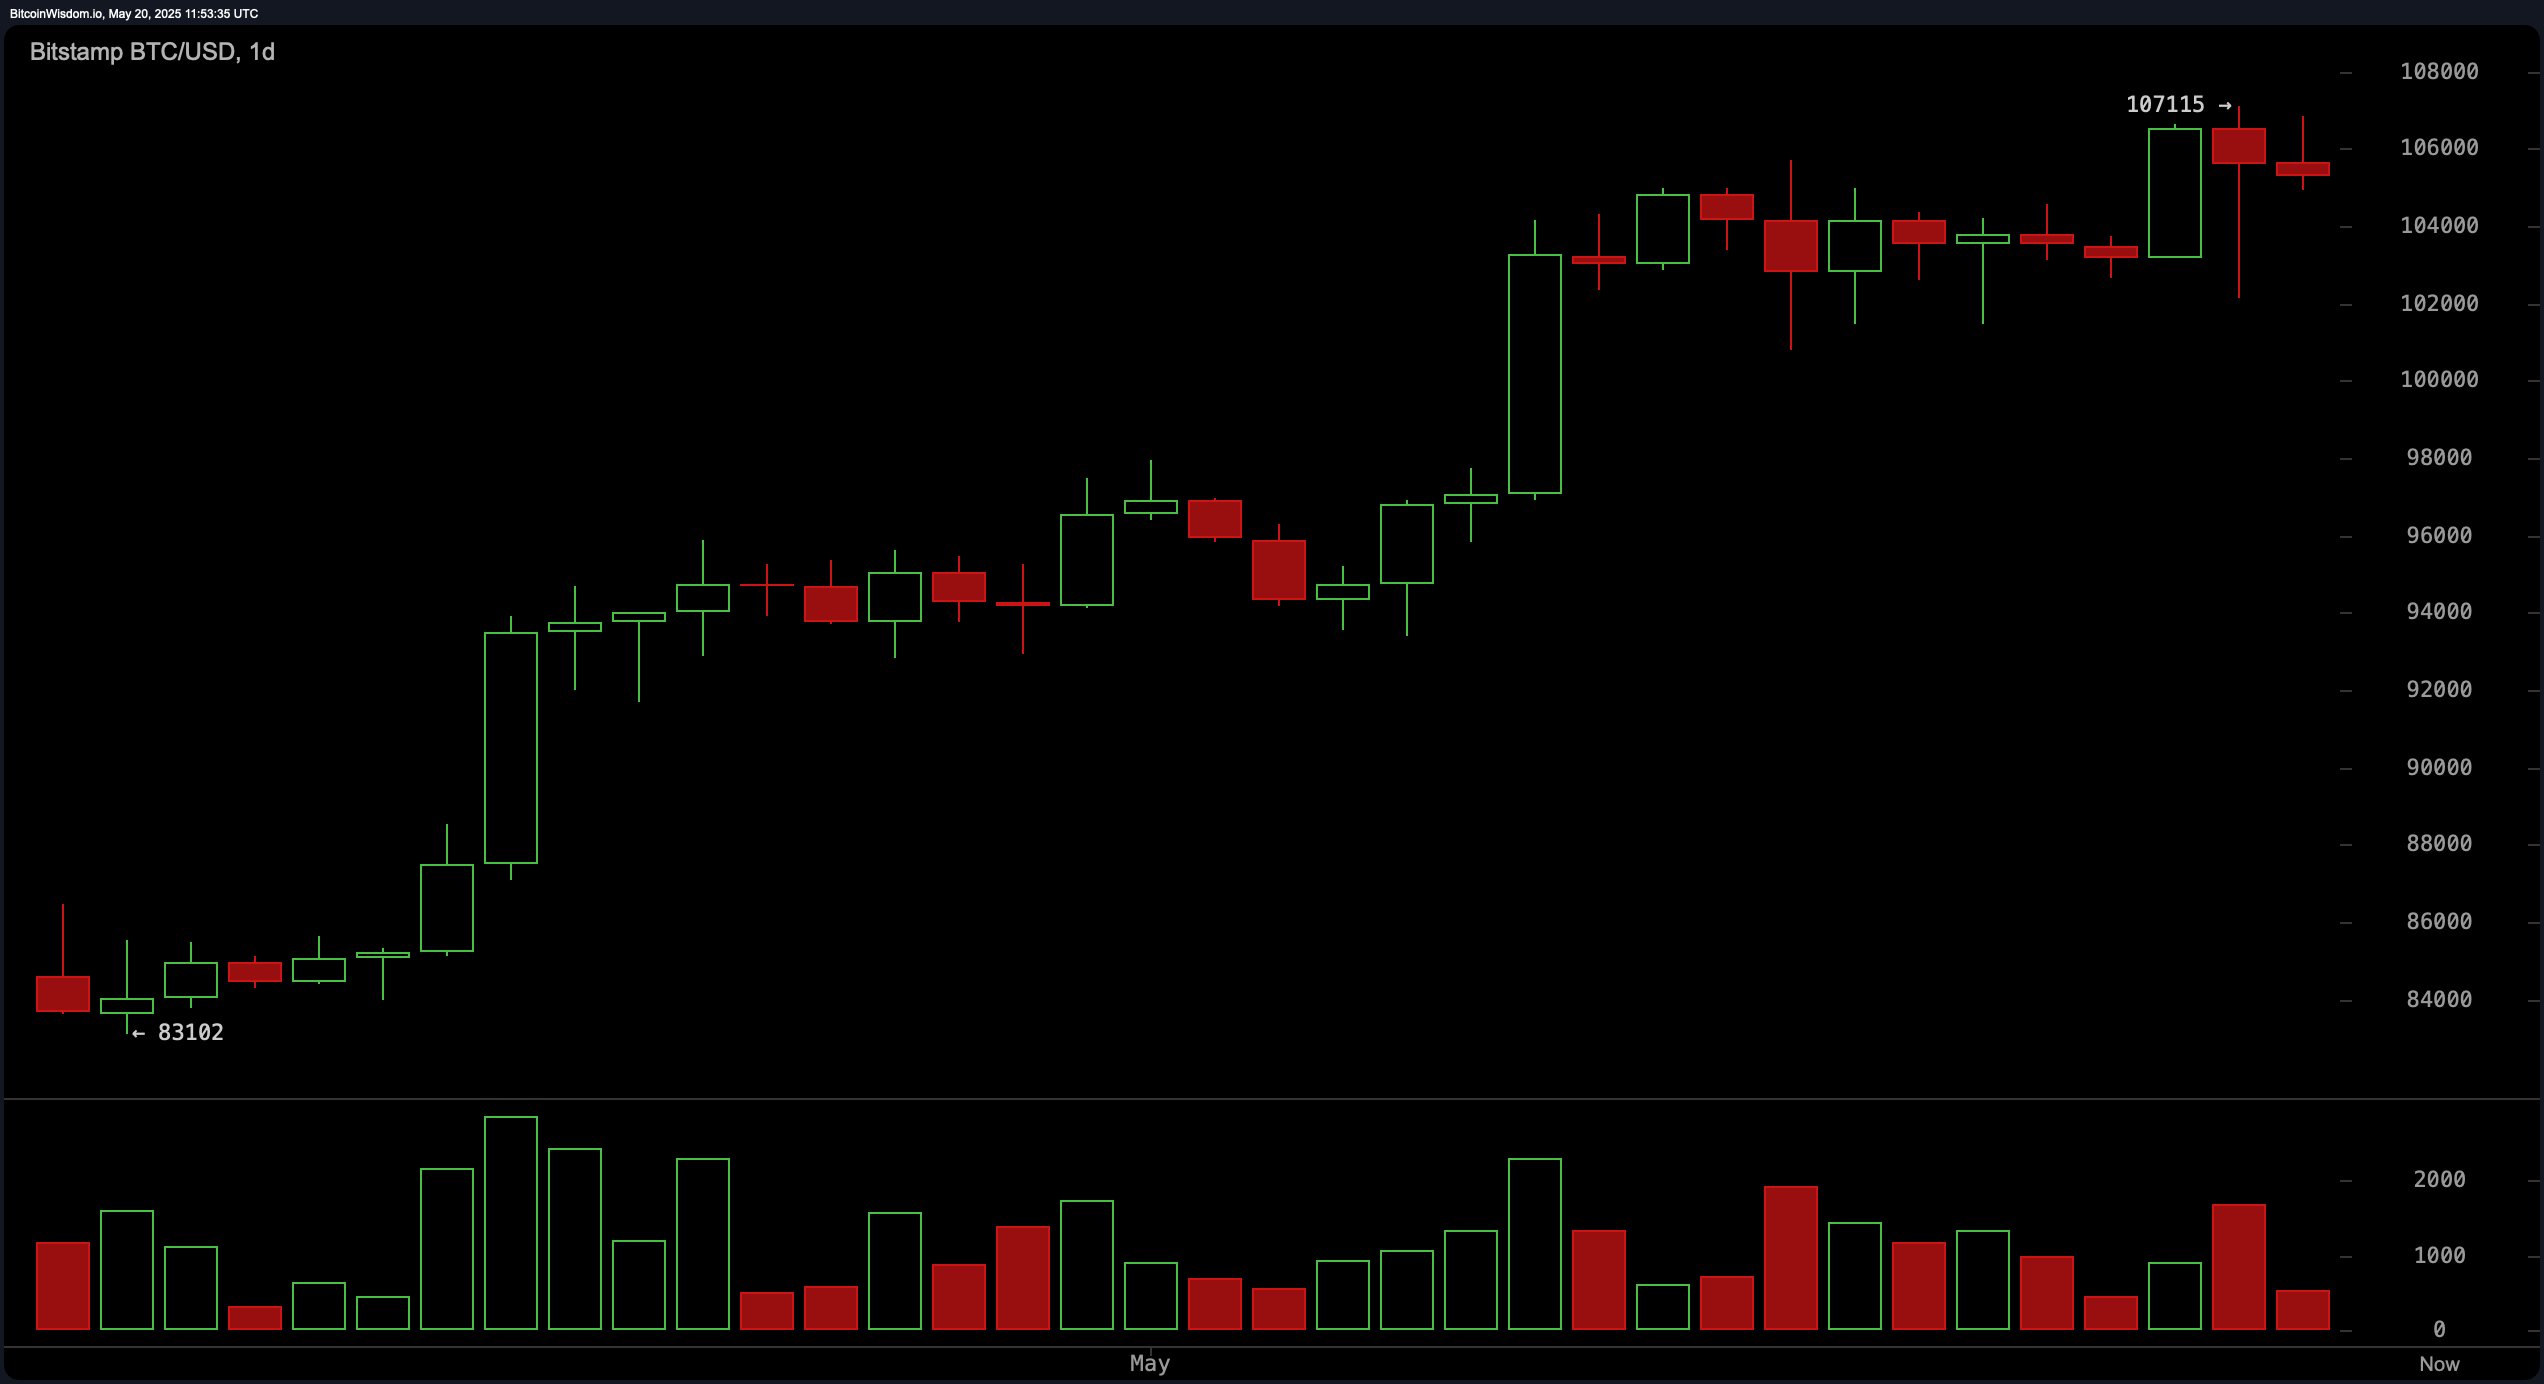
The daily chart confirms bitcoin is in a pronounced uptrend, rising from a base near $83,102 to a high of approximately $107,115. Volume analysis reveals that green candles accompanied by expanding volume reflect sustained buying interest, although recent candles exhibit upper wicks and waning momentum. This suggests a degree of buyer fatigue or hesitation at current price levels. Technical traders might consider entries around the $100,000 to $102,000 range, where previous consolidation offers a strong support base, especially if supported by a bullish candlestick pattern and healthy volume.

BTC/USD 1D chart via Bitstamp on May 20, 2025.
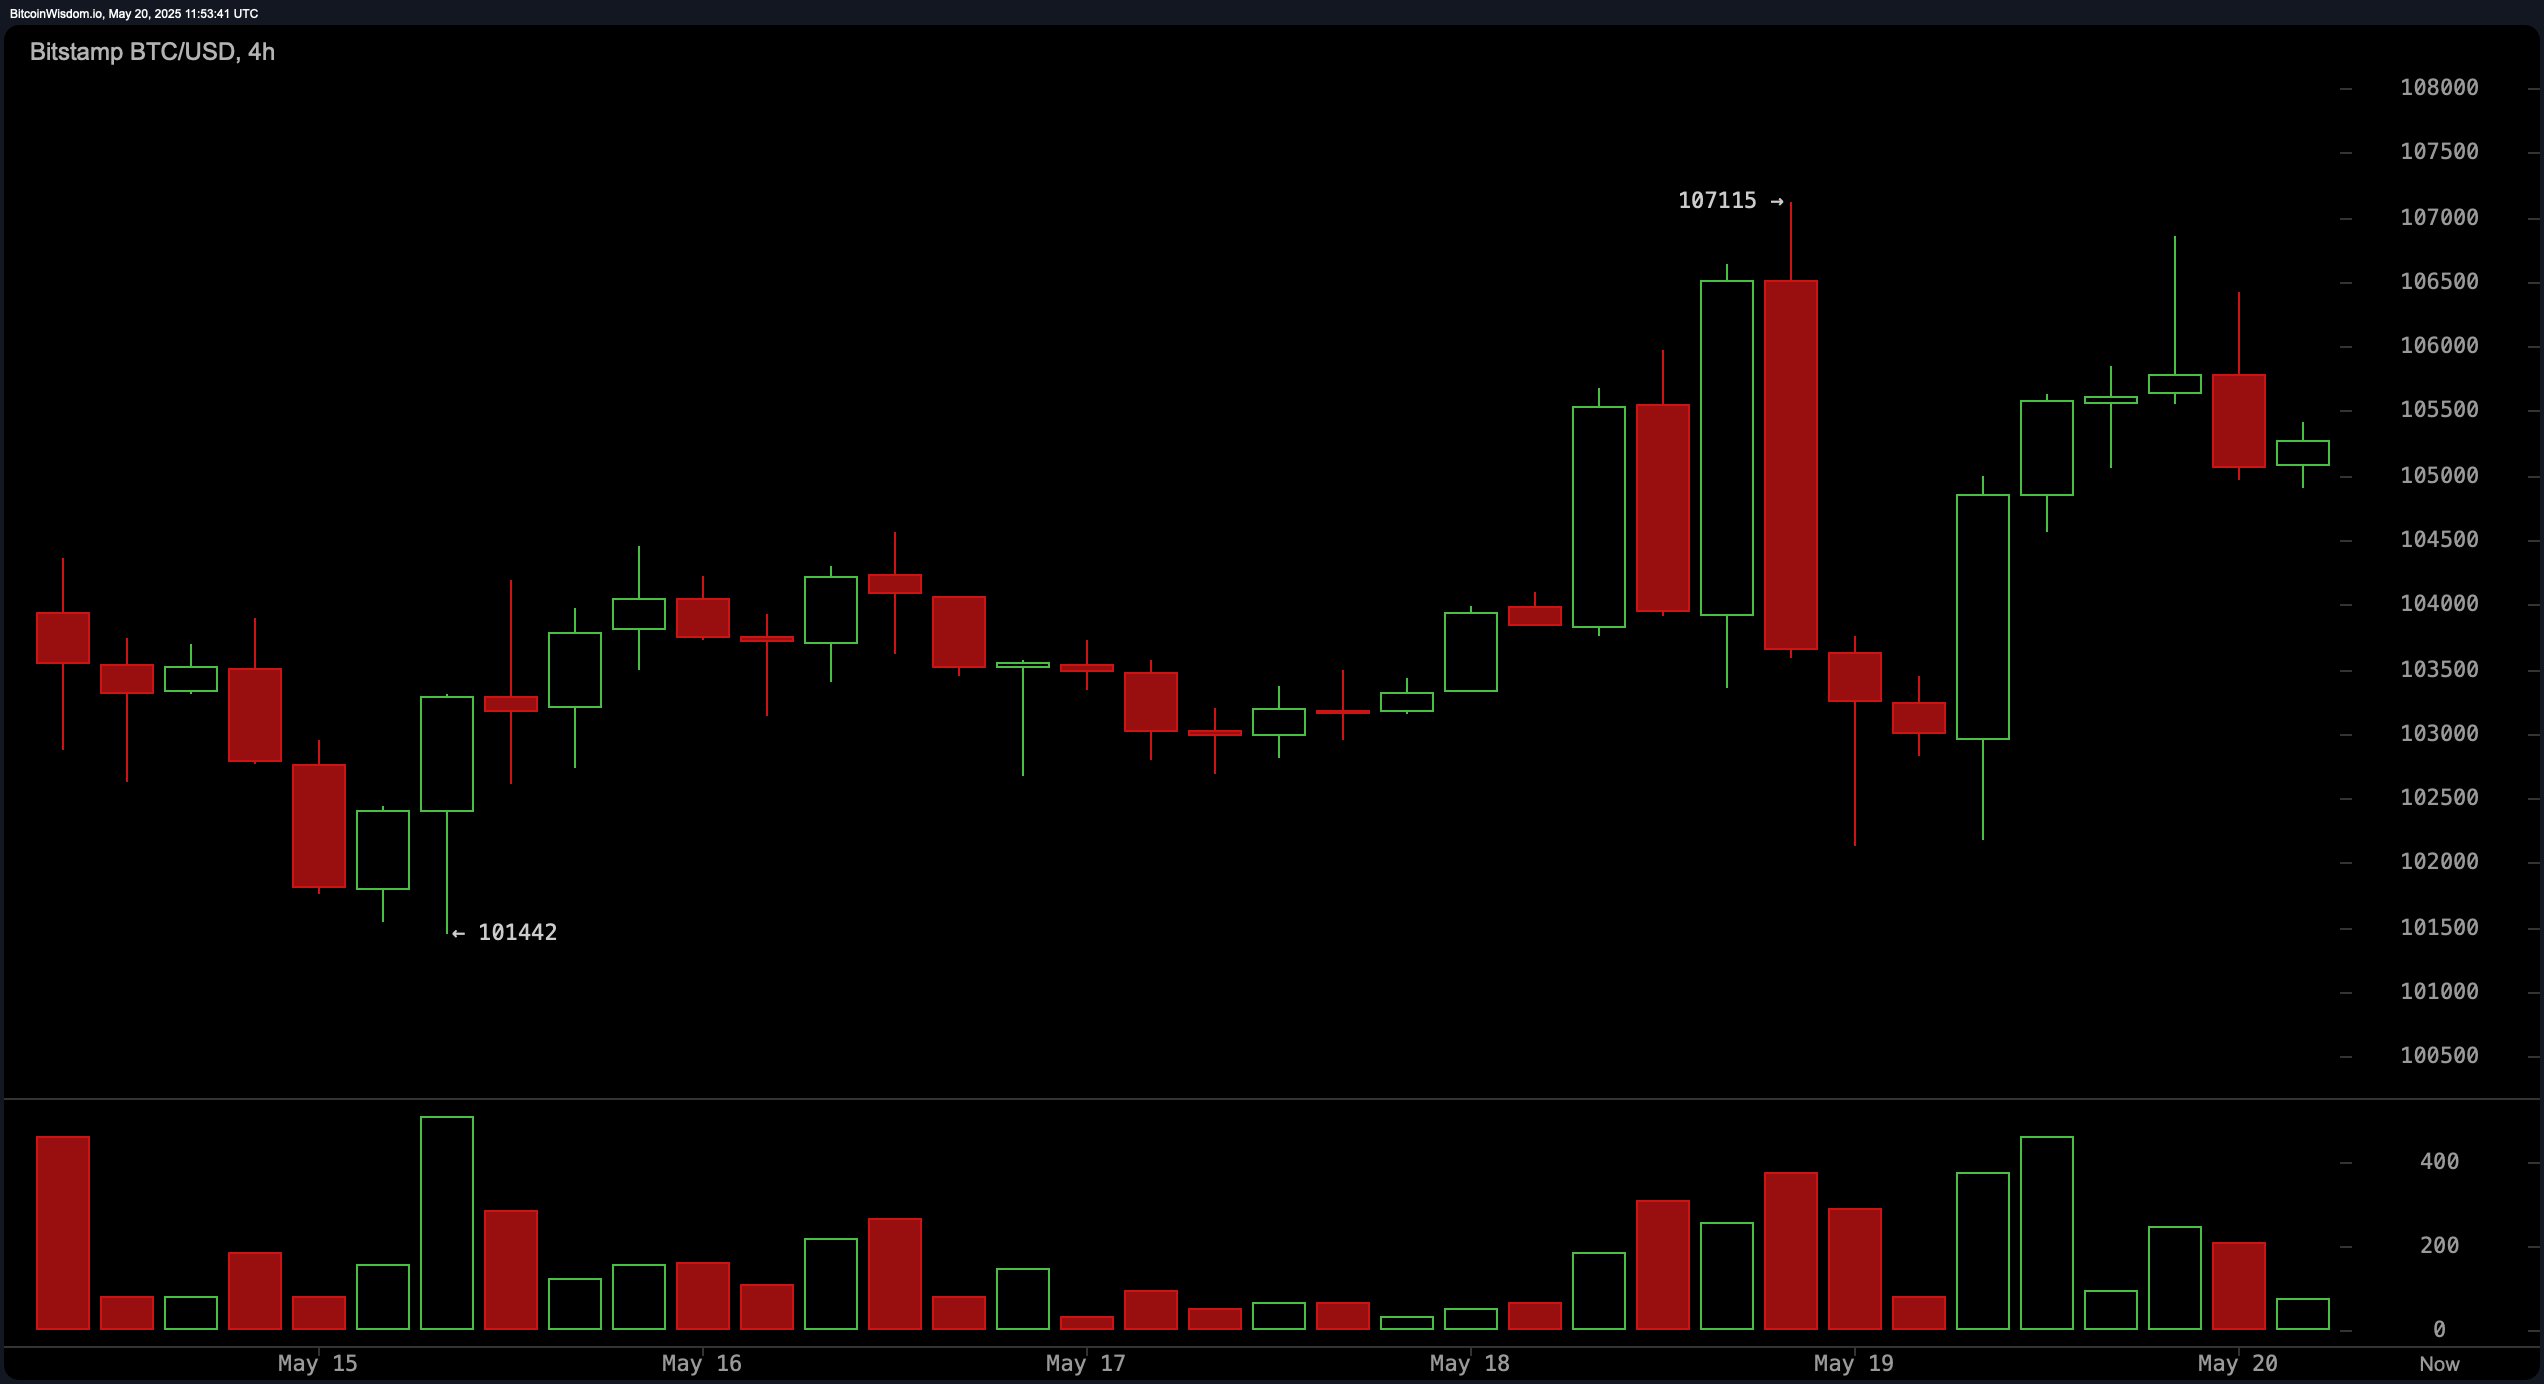
From a short-term view on the four-hour chart, bitcoin has retreated from its recent highs, printing a lower high pattern—a possible early sign of weakening bullish momentum. The aggressive selling near $107,000 on May 19, coupled with a notable volume spike, points to resistance at this zone. Short-term support has formed around $102,500, with a stronger foundation between $101,000 and $101,500. Traders are advised to watch these levels for bullish reversals, using confirmation patterns such as a morning star or bullish engulfing for potential entries.

BTC/USD 4H chart via Bitstamp on May 20, 2025.
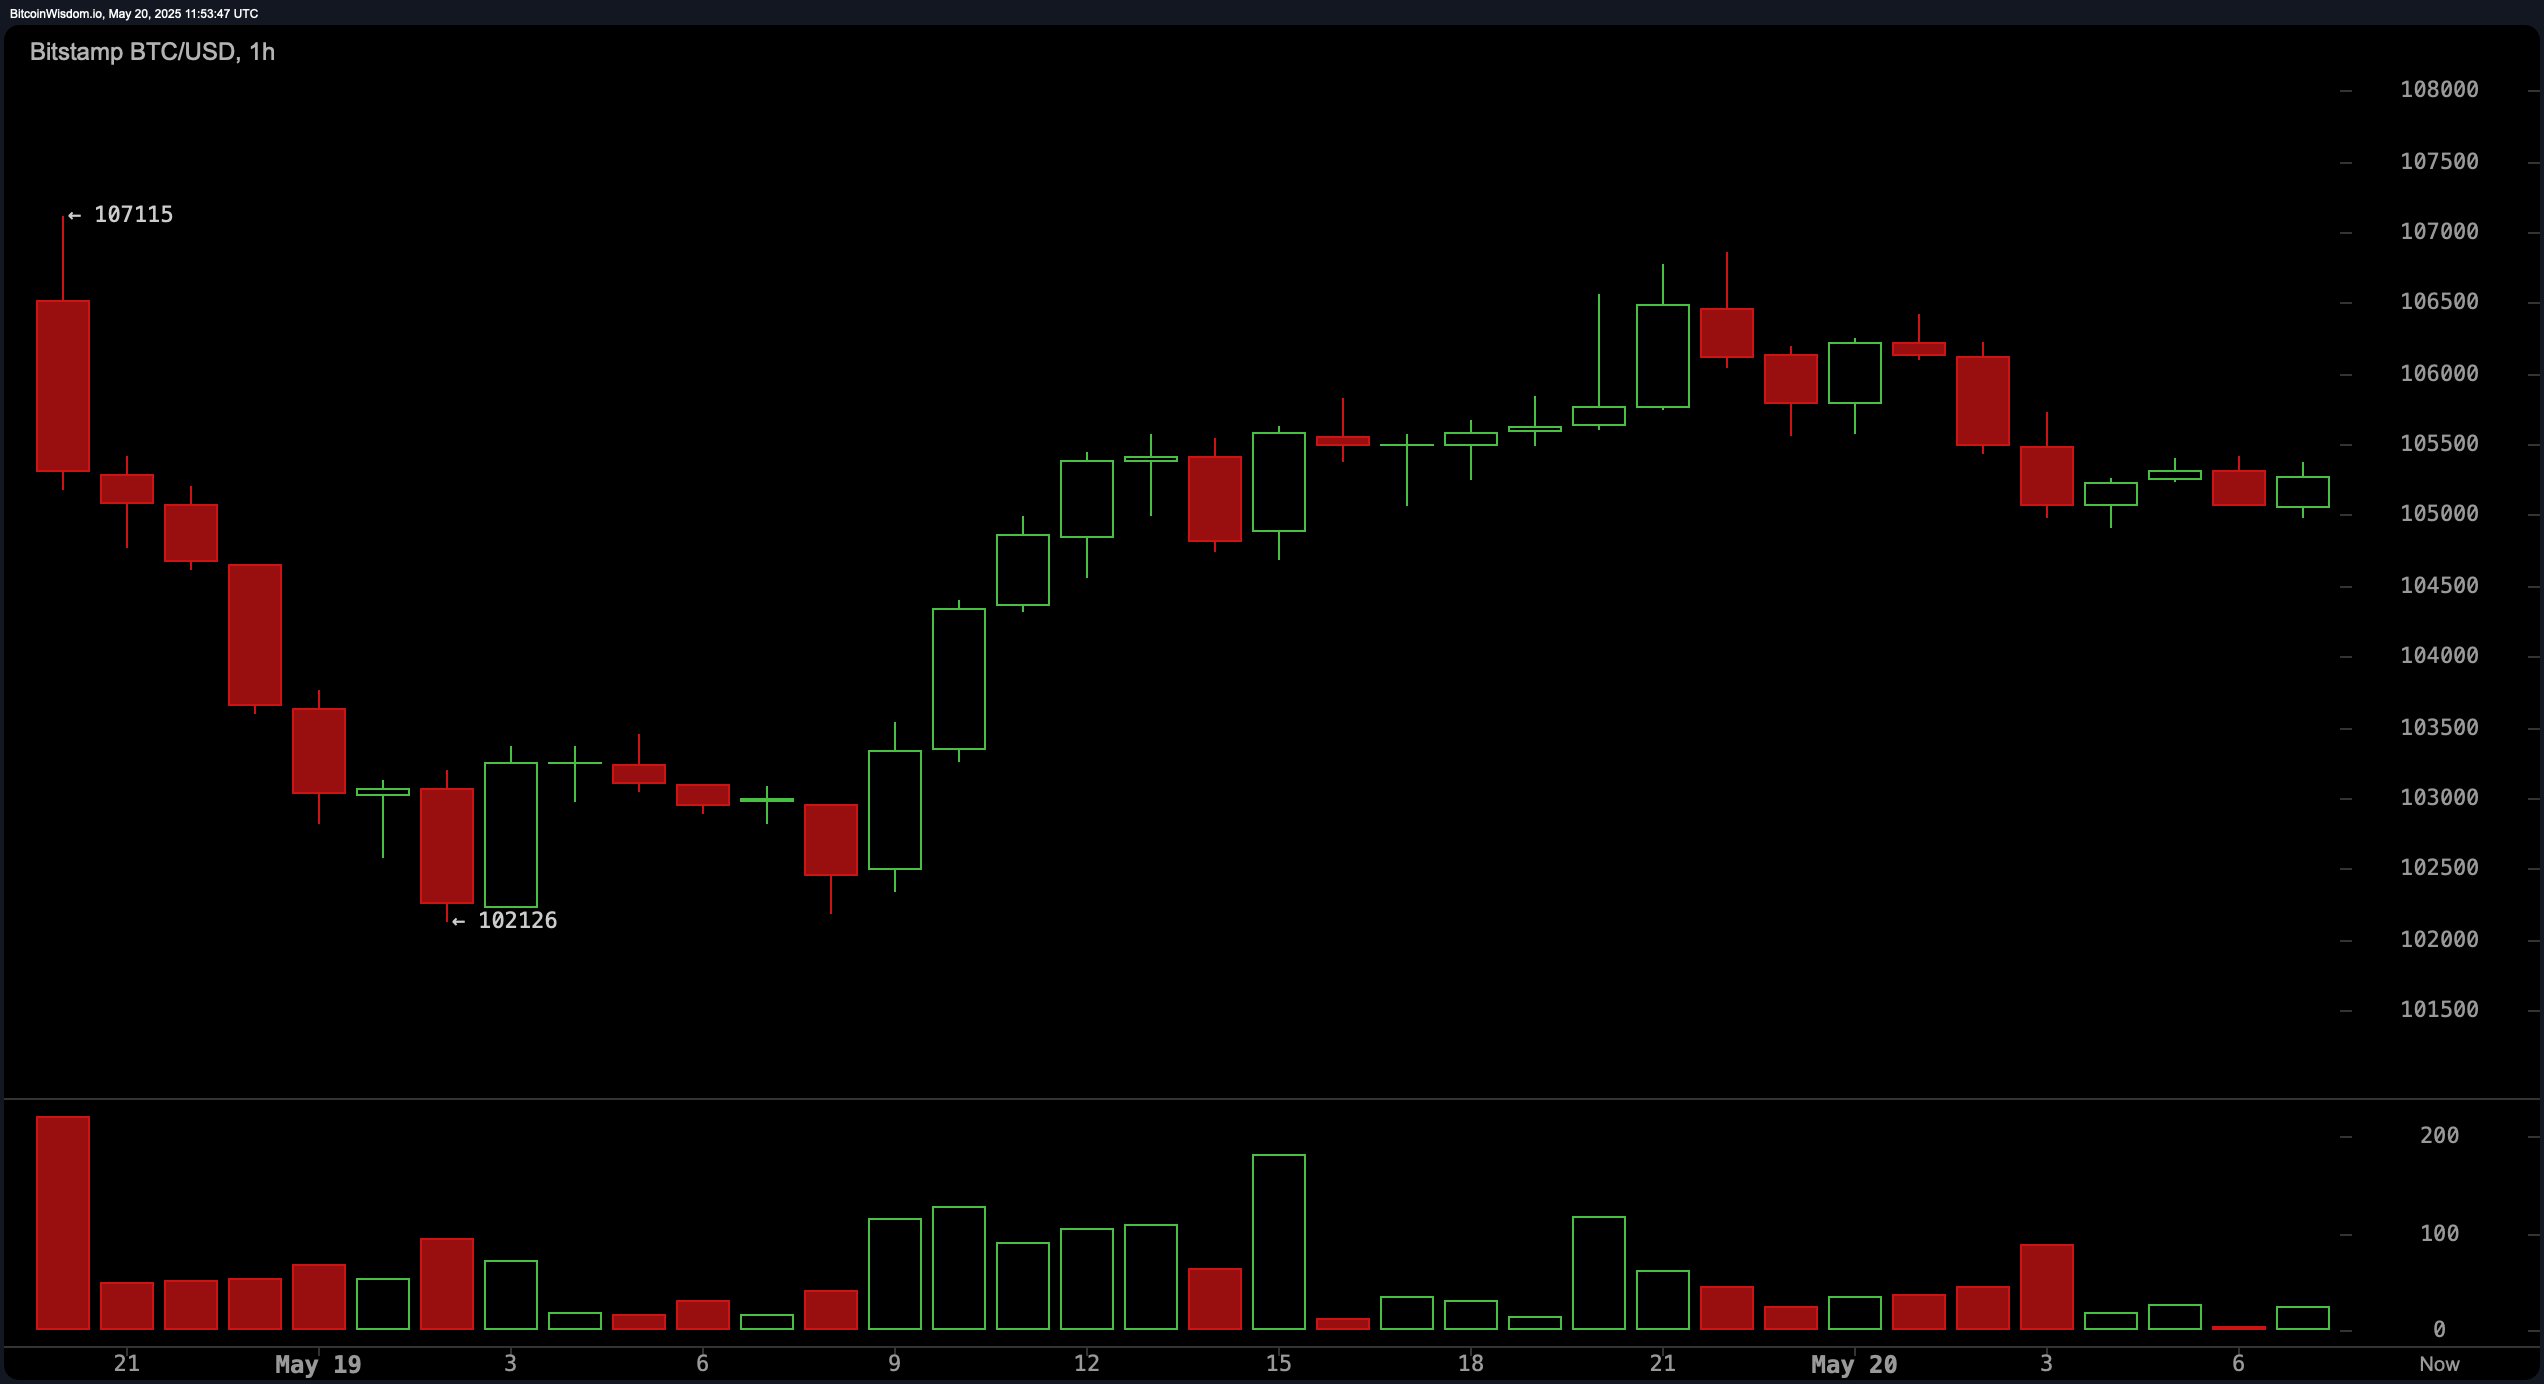
The one-hour chart reveals a sharp drop from $107,115 to approximately $102,126, followed by a subdued recovery. The pattern currently resembles a bearish flag or pennant, with price action climbing gradually on decreasing volume—typically a sign of potential breakdown. The critical intraday pivot lies at $105,000. A sustained breach below this level could invalidate bullish setups and increase the risk of revisiting the $101,500 zone. Until then, caution is warranted for intraday positions.

BTC/USD 1H chart via Bitstamp on May 20, 2025.
Oscillator readings across multiple indicators offer a mixed picture. The relative strength index (RSI), Stochastic, commodity channel index (CCI), average directional index (ADX), and Awesome oscillator are all in neutral territory, reflecting market indecision. However, momentum and the moving average convergence divergence (MACD) both signal a sell, indicating possible short-term weakness. In contrast, moving averages, both exponential (EMA) and simple (SMA), from the 10-period to the 200-period, uniformly suggest a buying environment, underscoring the broader bullish trend despite temporary pullbacks.
In summary, bitcoin’s technical posture remains broadly positive in the medium term, contingent on the integrity of the $101,000–$102,000 support region. Near-term risks persist, especially if momentum continues to fade and intraday breakdowns occur. The recommended approach is defensive: avoid chasing rallies and instead watch for retracements toward key support zones to structure more favorable entries.
Bull Verdict:
If bitcoin maintains support above $101,000 and reclaims momentum with a breakout above $107,000, the bullish trend remains intact. The alignment of all key moving averages pointing upward reinforces long-term strength, making any near-term pullback a potential buying opportunity.
Bear Verdict:
A failure to hold above $101,000 coupled with sustained weakness in momentum and MACD could shift the bias to bearish in the short term. If bitcoin breaks below key support levels with rising sell volume, it may signal the start of a broader correction from recent highs.
免责声明:本文章仅代表作者个人观点,不代表本平台的立场和观点。本文章仅供信息分享,不构成对任何人的任何投资建议。用户与作者之间的任何争议,与本平台无关。如网页中刊载的文章或图片涉及侵权,请提供相关的权利证明和身份证明发送邮件到support@aicoin.com,本平台相关工作人员将会进行核查。


